

Abstract
Transient receptor potential melastatin 2 (TRPM2) ion channel has an essential function in modulating cell survival following oxidant injury and is highly expressed in many cancers including neuroblastoma. Here, in xenografts generated from neuroblastoma cells in which TRPM2 was depleted with CRISPR/Cas9 technology and in in vitro experiments, tumor growth was significantly inhibited and doxorubicin sensitivity increased. The hypoxia-inducible transcription factor 1/2α (HIF-1/2α) signaling cascade including proteins involved in oxidant stress, glycolysis, and mitochondrial function was suppressed by TRPM2 depletion. TRPM2-depleted SH-SY5Y neuroblastoma cells demonstrated reduced oxygen consumption and ATP production after doxorubicin, confirming impaired cellular bioenergetics. In cells in which TRPM2 was depleted, mitochondrial superoxide production was significantly increased, particularly following doxorubicin. Ectopic expression of superoxide dismutase 2 (SOD2) reduced ROS and preserved viability of TRPM2-depleted cells, however, failed to restore ATP levels. Mitochondrial reactive oxygen species (ROS) were also significantly increased in cells in which TRPM2 function was inhibited by TRPM2-S, and pretreatment of these cells with the antioxidant MitoTEMPO significantly reduced ROS levels in response to doxorubicin and protected cell viability. Expression of the TRPM2 pore mutant E960D, in which calcium entry through TRPM2 is abolished, also resulted in significantly increased mitochondrial ROS following doxorubicin treatment, showing the critical role of TRPM2-mediated calcium entry. These findings demonstrate the important function of TRPM2 in modulation of cell survival through mitochondrial ROS, and the potential of targeted inhibition of TRPM2 as a therapeutic approach to reduce cellular bioenergetics, tumor growth, and enhance susceptibility to chemotherapeutic agents.
Keywords: mitochondria, neuroblastoma, oxidative stress, reactive oxygen species (ROS), transient receptor potential channels (TRP channels), TRPM2
Introduction
Transient receptor potential (TRP)3 channels are a superfamily of monovalent and divalent cation-permeable ion channels. Members of the melastatin subfamily, TRPM, have been shown to have important roles in cell proliferation and survival (1–5). The second member of this subfamily to be cloned, TRPM2, is a 1503-amino acid channel permeable to Ca2+, Na+, and K+ (6) and is widely expressed in many cell types including brain, hematopoietic cells, heart, and endothelial cells (7, 8). Its role in normal physiological conditions as well as in oxidative stress is under investigation in many cell types (9). Oxidative stress, TNFα, and amyloid β-peptide are among the key extracellular signals known to activate TRPM2 (10–13). Stimulation with these extracellular signals results in production of adenosine diphosphate-ribose (ADPR), which activates the channel by binding to the TRPM2 C-terminal NUDT9-H domain (7, 13–19). A rise in intracellular Ca2+ and calmodulin also positively regulate TRPM2 (20–22), and acidification can inhibit channel activity (23–25). TRPM2 functions as a tetramer and six splice variants of full-length TRPM2 (TRPM2-L) have been discovered to date, although their physiological roles in modulation of its function are not known (12, 26–29). TRPM2-S (short, 845 residues) is missing four C-terminal transmembrane domains and the C terminus inhibits calcium influx through the full-length channel, and functions as a dominant-negative isoform (26).
Oxidative stress results from imbalance between the amount of oxidants produced and antioxidants, leading to tissue injury depending on severity and duration (7). Major sources of reactive oxygen species (ROS) are the mitochondrial electron transport chain and NADPH oxidases (NOX), which are key regulators of non-mitochondrial ROS. ROS play a major role in tissue injury through protein oxidation, lipid peroxidation, and DNA oxidation and mutagenesis. A number of chemotherapeutic agents including doxorubicin contribute to cell death by increasing ROS (30, 31).
Although early studies supported the paradigm that activation of TRPM2 induced cell death through a sustained increase in intracellular calcium (10, 32) or enhanced cytokine production aggravating tissue injury (33), more recent reports suggested that calcium entry through TRPM2 may be protective rather than deleterious in a number of physiological model systems. In pyramidal neurons subjected to oxidant injury, inhibition of TRPM2 enhanced cellular damage (34). In wild type mice challenged with intraperitoneal injection of endotoxin, the survival was five times greater than that of TRPM2 knock-out mice due to reduced NOX-mediated ROS production in wild type phagocytes (35). TRPM2 channels also protected the heart from ischemia/reperfusion (I/R) injury, and the mechanism was through maintenance of mitochondrial function and reduced levels of mitochondrial oxidants (36–38). TRPM2 channels are highly expressed in a number of cancers including melanoma (39), breast cancer,4 and neuroblastoma (40–42). Previously, TRPM2 function has been studied in cancer cells with either shRNA down-regulation or expression of the dominant-negative TRPM2-S (40, 41). TRPM2-L protected neuroblastoma SH-SY5Y cells from physiological oxidative stress through increased levels of Forkhead box transcription factor 3a (FOXO3a) and superoxide dismutase 2 (SOD2, MnSOD) (40), whereas cells expressing the dominant-negative TRPM2-S isoform had reduced FOXO3a and SOD2 levels and enhanced ROS, increasing susceptibility to oxidant injury. Tumor growth was diminished by expression of dominant-negative TRPM2-S in a xenograft model, and the mechanisms involved reduced HIF-1/2α expression and mitochondrial function (41). Reduction of TRPM2 with shRNA may yield inconclusive results if depletion is not complete or sustained, and results depend on the level of endogenous protein required for function. The use of dominant-negative constructs has additional potential pitfalls, which include the possibility of off target effects and the risk of incomplete inhibition. Because the effect of a dominant-negative is competition-based, it can potentially be modified by increased expression of the target protein.
Here, we utilized a fundamentally different approach to study the role of TRPM2 in cancer cell growth, survival, and bioenergetics, namely, depletion of TRPM2 with targeted CRISPR/Cas9 technology. TRPM2 was knocked out in neuroblastoma cells as a model to explore its role in tumor growth and cell survival after doxorubicin. Our major findings are: 1) depletion of TRPM2 significantly inhibits tumor growth and increases chemotherapy sensitivity; 2) TRPM2 depletion results in decreased levels of HIF-1/2α and downstream proteins that modulate oxidant injury and mitochondrial bioenergetics; 3) mitochondrial ROS levels are increased and play a key role in reduced cell survival in neuroblastoma tumor cells in which TRPM2-L is depleted or inhibited; and 4) calcium entry through TRPM2 plays an important role in modulation of cell viability, mitochondrial bioenergetics, and mitochondrial ROS levels. A recent search of the OncoGenomics database (Khan lab, Center for Cancer Research, National Cancer Institute) complements these findings and showed that low TRPM2 expression in human neuroblastoma tumors was associated with significantly better patient survival than high expression. The experimental findings presented here strongly support the conclusion that targeted inhibition of TRPM2 function in cancer cells has a significant impact on tumor growth and response to chemotherapy through modulation of mitochondrial ROS and cellular bioenergetics.
Results
Generation and Characterization of TRPM2-depleted Neuroblastoma Cells
To study the function of TRPM2 in neuroblastoma tumor growth and chemotherapy sensitivity, we generated SH-SY5Y neuroblastoma cells in which TRPM2 was depleted with CRISPR technology. The area chosen for deletion of TRPM2 genomic DNA encoded the first 40 amino acids and the remaining TRPM2 sequence was frameshifted. Deletion of this segment was confirmed by real-time reverse transcriptase-polymerase chain reaction (RT-PCR), and by Western blotting of TRPM2-L protein (Fig. 1, A and B).
FIGURE 1.
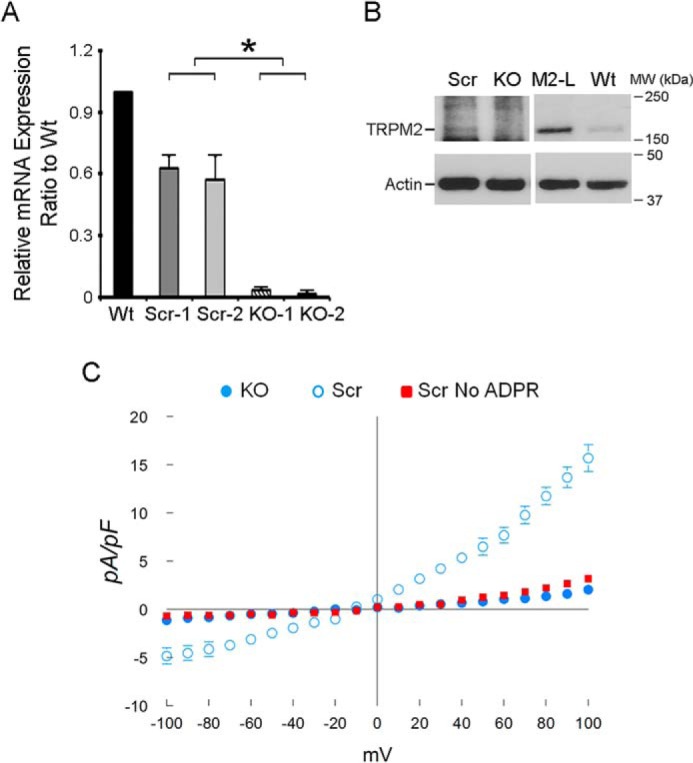
Characterization of ADPR-activated cationic currents in neuroblastoma cells in which TRPM2 is depleted with CRISPR or in scrambled control cells. A, depletion of TRPM2 in SH-SY5Y cells compared with scrambled control cells was demonstrated by real-time RT-PCR (two individual clones, Scr clones 1,2; KO-1,2; primers for RT-PCR under “Experimental Procedures”). B, Western blotting of lysates from representative scrambled (Scr) and KO clones compared with TRPM2-L transfected (M2-L) and parental wild type (Wt) SH-SY5Y cells (same amount of protein loaded/lane on same gel but lighter exposure of lanes M2-L and Wt shown). C, SH-SY5Y cells in which TRPM2 was depleted or scrambled control cells were studied with the standard patch clamp whole cell configuration. Composition of pipette and external solutions and voltage ramp protocols are given under “Experimental Procedures.” I-V relationships of cationic current (mean ± S.E.) from TRPM2 depleted (●, n = 5) or scrambled (○, n = 4) cells stimulated with 300 μm ADPR are shown. Error bars are not shown if they fell within the boundaries of the symbol. Two-way ANOVA indicates p < 0.0001 for TRPM2 depleted versus scrambled control cells. Omission of ADPR in pipette solutions resulted in much smaller currents in scrambled SH-SY5Y control cells (■, n = 4).
Cationic current was characterized in SH-SY5Y cells in which TRPM2 was depleted with CRISPR/cas9 technology and in scrambled SH-SY5Y control cells. Under our experimental conditions, intracellular application of ADPR (300 μm) elicited large inward and outward cation currents in scrambled SH-SY5Y control cells expressing endogenous TRPM2, but not in TRPM2-depleted cells (Fig. 1C). ADPR-activated current displayed the characteristic TRPM2 linear I-V relationship with reversal potential close to 0 mV (43, 44). Omission of ADPR in pipette solutions resulted in nearly absent current in scrambled control cells, similar to TRPM2-depleted cells exposed to ADPR. Together, these data demonstrate that (i) ADPR-activated current is mediated through endogenous TRPM2, and (ii) TRPM2 current activated by ADPR was successfully reduced in SH-SY5Y cells in which TRPM2 was depleted with CRISPR. Reduced current in TRPM2-depleted cells was similar to that observed in cells expressing the dominant-negative isoform TRPM2-S; TRPM2-S does not have the calcium pore and inhibits calcium entry through TRPM2-L (41).
TRPM2 Depletion Reduced Cell Proliferation and Increased the Sensitivity of Neuroblastoma Cells to Doxorubicin
To evaluate the impact of TRPM2 depletion on SH-SY5Y cell growth, two individual clones in which TRPM2 was depleted and two scrambled control clones were cultured. By 2,3-bis(2-methoxy-4-nitro-5-sulfophenyl)-2H-tetrazolium-5-carboxanilide (XTT) analysis, cells in which TRPM2 was depleted grew slower than scrambled control cells (also grown in puromycin), and had significantly greater sensitivity to doxorubicin at 24 h (Fig. 2A). Because XTT measures cell viability through detection of cellular metabolic activity, cell number was also quantified by trypan blue exclusion. Live cell number was variably greater in scrambled controls cells compared with TRPM2-depleted cells; doxorubicin treatment resulted in a significant reduction in live TRPM2-depleted cells compared with live scrambled control cells (Fig. 2B). These in vitro studies demonstrate that cell proliferation and viability after doxorubicin are significantly decreased when TRPM2 is depleted with CRISPR technology.
FIGURE 2.
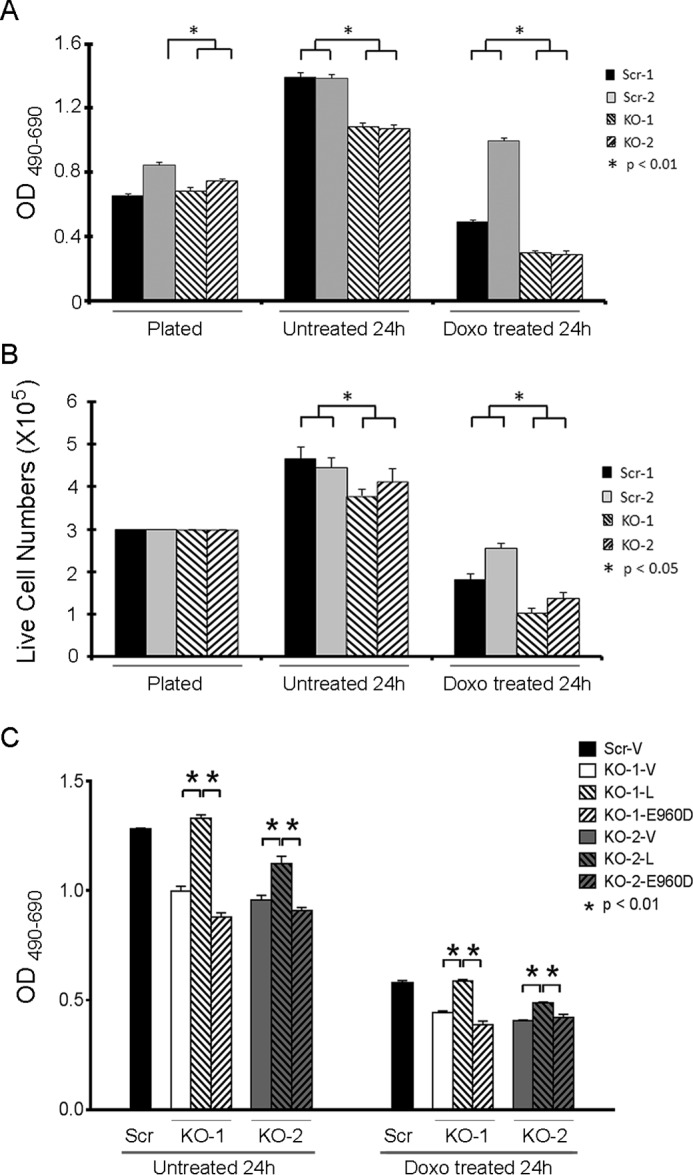
TRPM2 depletion increases doxorubicin sensitivity in vitro. SH-SY5Y cells in which TRPM2 was depleted (KO clones 1 and 2) or scrambled control cells (Scr clones 1 and 2) were studied at plating, and at 24 h without treatment or after 0.3 μm doxorubicin. C, KO clones were transfected with empty vector, wild type TRPM2, or the inactive TRPM2 pore mutant E960D, and one scrambled clone was transfected with empty vector. Cell proliferation was measured by XTT assay (A and C) or trypan blue exclusion (B). Results are expressed as OD reading of plated cells (A and C; 5 × 10⁴ cell plated) or as live cell number (B; 3 × 10⁵ cells plated at time 0). Values are mean ± S.E. for one representative experiment of two performed with XTT (A and C) and two with trypan blue exclusion, each performed and analyzed in triplicate. *, significance at p ≤ 0.05.
To rule out the possibility that these observations were due to secondary off-target effects occurring during CRISPR/Cas9 treatment or subsequent selection, SH-SY5Y cells in which TRPM2 was depleted (KO) were transfected with empty vector, wild type TRPM2, or the TRPM2 inactive pore mutant E960D. The E960D construct was previously generated by our laboratory and the loss of function has been authenticated (38, 45). Expression of wild type TRPM2 but not E960D in the KO reconstituted cell viability at or close to the level observed in the scrambled control (Fig. 2C), demonstrating that the reduced viability in the KO was not due to off-target effects, and the critical role of TRPM2-mediated calcium entry.
To evaluate the effects of TRPM2 depletion on xenograft tumor growth, athymic female mice were injected in one flank with either two different clones of TRPM2-depleted SH-SY5Y cells, two scrambled control clones, or parental wild type (WT) SH-SY5Y cells. Tumor size was measured twice weekly for 6 weeks. Tumors from TRPM2-depleted cells demonstrated significantly reduced tumor volume (Fig. 3A) and tumor weight (Fig. 3B) compared with scrambled control cells, which were similar to SH-SY5Y parental wild type cells. Differences in tumor sizes were visually apparent (Fig. 3C). These in vivo studies demonstrate that tumor growth is significantly decreased when TRPM2 is depleted.
FIGURE 3.

TRPM2 depletion significantly reduces growth of SH-SY5Y neuroblastoma xenografts. Athymic female mice were injected with 1.5 × 10⁷ SH-SY5Y cells in which TRPM2 was depleted with CRISPR (two individual clones, KO-1 and -2), scrambled control cells (two individual clones, Scr-1 and -2), or wild type parental cells (Wt) (A and B). Tumor volume (A) was measured over 6 weeks and tumor weight (B) was measured at the end of the experiment. Two experiments were performed and mean ± S.E. of one experiment (n = 11 Wt xenografts, 14 Scr-1, 13 Scr-2, 14 KO-1, 13 KO-2) are shown. *, p ≤ 0.01. Photographs of representative tumors are shown in C for visual size comparison.
HIF-1/2α and Downstream Signaling Pathways Are Down-regulated in TRPM2-depleted Xenografts
To determine the mechanisms responsible for the reduced growth of TRPM2-depleted tumors, Western blotting was performed on lysates of xenograft tumors harvested 6 weeks after SH-SY5Y cell injection. A statistically significant decrease in expression of the transcriptional regulators HIF-1α and HIF-2α was observed in tumors from cells in which TRPM2 was depleted. Scrambled control cells expressing endogenous TRPM2-L demonstrated more HIF-1α and -2α (Fig. 4) and formed larger tumors (Fig. 3), consistent with reports that HIF-2α promotes a more aggressive tumor phenotype in patients with neuroblastoma (46, 47). Western blotting confirmed modulation of expression of proteins downstream of HIF-1α including reduced expression of antioxidants (SOD1/2, FOXO3a) (48, 49), mitochondrial proteins (Bcl2/adenovirus E1B 19-kDa interacting protein 3, BNIP3), proteins involved in mitochondrial electron transport chain activity (complex IV, cytochrome oxidase 4.1/4.2, COX4.1/4.2) (50–55), and in glycolysis (enolase 2, ENO2) in TRPM2-depleted cells. By contrast, there were no differences in Nox2 or Nox4 between knock-out and scrambled cells, suggesting that TRPM2 is unlikely to be involved in regulation of Nox activities. These data show that TRPM2 plays an important role in regulation of HIF-1/2α expression and downstream signaling transducers, many of which are involved in regulation of oxidant stress, mitochondrial function, and bioenergetics that modulate cell survival.
FIGURE 4.

Tumors depleted of TRPM2 demonstrate reduced expression of HIF-1α and HIF-2α and downstream signaling proteins. Lysates were prepared from tumors xenografts harvested 6 weeks after injection with SH-SY5Y cells depleted of TRPM2 or scrambled control cells. Western blotting analysis was performed and blots were probed with anti-HIF-1α, anti-HIF-2α, and antibodies to the downstream target genes FOXO3a, SOD1, SOD2, COX 4.1/4.2, BNIP3, ENO2, and Nox2 and Nox4. Cl0RF43 was probed to confirm equivalent loading. Western blotting was performed on at least nine tumors for each cell type. Protein expression was quantitated by densitometry and the mean ± S.E. of protein was calculated. *, p ≤ 0.05.
Mitochondrial O2 Consumption Is Lower in TRPM2-depleted Neuroblastoma Cells
Because of reduced mitochondrial protein expression in TRPM2-depleted SH-SY5Y neuroblastoma cells, we examined whether mitochondrial complex activities are also affected. Basal and maximal oxygen consumption rates (OCR) were significantly reduced in TRPM2-depleted cells compared with scrambled control cells or wild type parental cells (Fig. 5). These findings suggest that when TRPM2 expression or function is reduced, the mitochondrial oxygen consumption rate is decreased. Because doxorubicin reduces viability of TRPM2-depleted cells, the effect of doxorubicin on OCR was examined. Basal and maximal OCRs were measured in TRPM2-depleted and scrambled control cells with and without doxorubicin treatment. Doxorubicin treatment significantly reduced OCRs in all cells, but the OCR of TRPM2-depleted cells was significantly less than scrambled after doxorubicin. Results of a representative experiment using one knock-out and scrambled control clone are shown (Fig. 6A).
FIGURE 5.
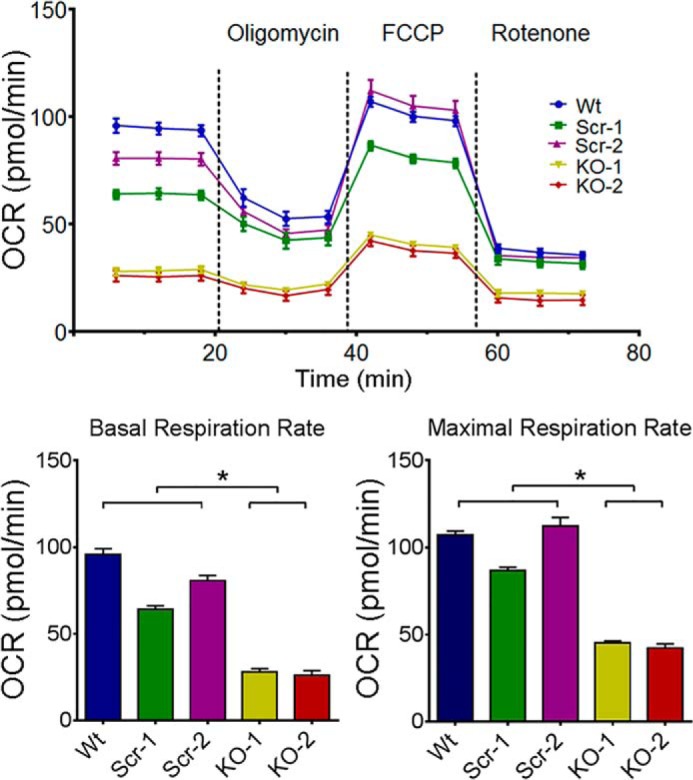
O2 consumption rate is lowest in TRPM2-depleted neuroblastoma cells. O2 consumption rate was measured in SH-SY5Y cells depleted of TRPM2 (two clones, KO-1 and -2), scrambled control cells (two clones, Scr-1 and -2), and in parental wild type cells (Wt). Top, after basal OCR was obtained, oligomycin (2 μm) was added to inhibit F0F1-ATPase (Complex V). The uncoupler FCCP (0.5 μm) was then added and maximal OCR was measured. Rotenone (0.5 μm) was then added to inhibit NADH dehydrogenase (Complex I). Six experiments were performed and results from a representative one are shown. Each point in the traces represents the average of 6 different wells. Summary of basal (bottom left) and maximal (bottom right) OCR of 5 groups of cells from this experiment (n = 6 each). *, p < 0.05.
FIGURE 6.
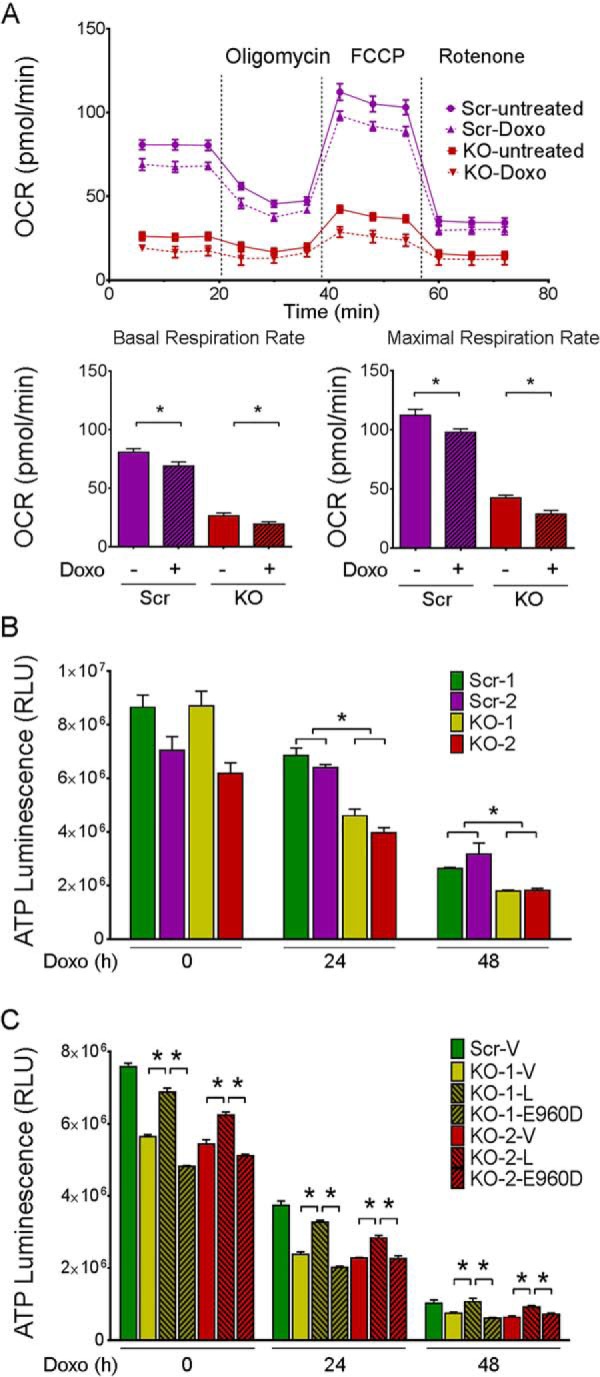
O2 consumption rate and ATP production are reduced by doxorubicin in TRPM2-depleted neuroblastoma cells. A, O2 consumption rate was measured in SH-SY5Y cells depleted of TRPM2 (KO) and scrambled control (Scr) cells treated with or without 0.3 μm doxorubicin. Basal OCR was obtained in untreated cells or studied 24 h after doxorubicin treatment; oligomycin (2 μm) was then added to inhibit F0F1-ATPase (Complex V). The uncoupler FCCP (0.5 μm) was then added and maximal OCR was measured, followed by rotenone (0.5 μm) to inhibit NADH dehydrogenase (Complex I). Five experiments were done and a representative comparison of KO(2) and Scr(2) cells from one experiment is shown. Each point in the traces represents the average of 6 different wells. *, p < 0.05. Summary of basal (bottom left) and maximal (bottom right) OCR from this experiment are shown. B, SH-SY5Y cells depleted of TRPM2 (two clones, KO-1 and -2) or scrambled control cells (Scr-1 and -2) were treated for 24 or 48 h with doxorubicin (0.3 μm). ATP levels were measured with the Cell Titer Glow Assay and results are expressed as ATP Luminescence Units for each group. Three experiments were performed with similar results and a representative experiment is shown. *, p < 0.05. C, two clones of TRPM2 KO cells were transfected with empty vector (V), wild type TRPM2 (L), or the TRPM2 inactive pore mutant E960D, treated with doxorubicin, and ATP measured as described above. One clone of scrambled cells was transfected with empty vector as control. Two experiments were performed and results of one are shown. Results are expressed as mean ± S.E.; *, p < 0.01.
Neuroblastoma Cells Depleted of TRPM2 Have Lower ATP Levels
Because TRPM2-depleted SH-SY5Y cells demonstrated reduced OCR, the bioenergetic capacity was further examined by measurement of ATP. ATP levels were measured in TRPM2-depleted or scrambled control cells at 24 h, and 48 h after doxorubicin (0.3 μm) treatment. ATP levels progressively declined with time after doxorubicin treatment in all cells, but the rate of decline was significantly faster in TRPM2-depleted compared with scrambled control cells (Fig. 6B). These findings demonstrate that endogenous TRPM2 is important in maintenance of cellular bioenergetics after doxorubicin treatment. SH-SY5Y cells in which TRPM2 was depleted (KO) were transfected with empty vector, wild type TRPM2, or the TRPM2 inactive pore mutant E960D (Fig. 6C). Expression of wild type TRPM2 but not E960D in the KO-reconstituted ATP production, at or close to the level observed in the scrambled control, demonstrated that reduced ATP production in the KO was not due to secondary effects.
Reduced TRPM2 Results in Increased Mitochondrial ROS after Doxorubicin
To determine the level and origin of ROS in SH-SY5Y cells in which TRPM2 is depleted (40), mitochondrial superoxide was quantitated with MitoSOX Red at baseline and following doxorubicin using confocal microscopy. At baseline, TRPM2-depleted SH-SY5Y cells loaded with MitoSOX Red showed a small but significantly greater level of mitochondrial ROS compared with scrambled control cells (Fig. 7). In TRPM2-depleted cells treated with doxorubicin, a further significant increase in mitochondrial ROS was seen compared with scrambled cells. Cellular ROS was not quantitated in TRPM2-depleted cells because of interference with 5,6-chloromethyl-2′,7′-dichlorodihydrofluorescein diacetate (CM-H2DCF-DA) by GFP in the CRISPR vector.
FIGURE 7.
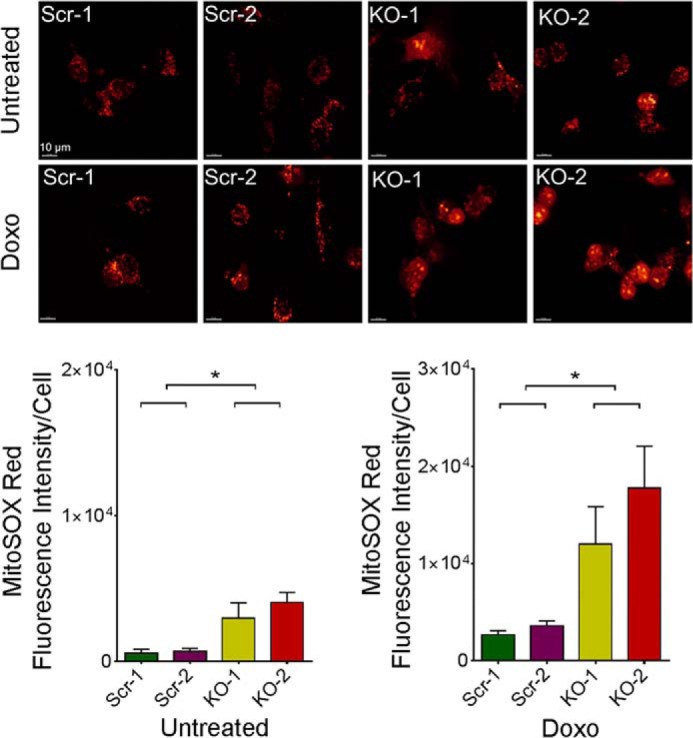
TRPM2 depletion results in increased mitochondrial ROS. SH-SY5Y cells depleted of TRPM2 (2 clones, KO-1 and -2) and scrambled control cells (Scr-1 and -2) loaded with MitoSOX Red were studied at baseline and 24 h after treatment with 0.3 μm doxorubicin. Intensity of MitoSOX fluorescence was quantitated with confocal microscopy. Representative fields are shown at the top. Mean ± S.E. fluorescence intensity of a minimum of 100 cells in at least 10 fields in each group was quantified and analyzed for untreated (bottom left) and doxorubicin-treated cells (bottom right) for each experiment. Four different experiments with each group of cells were performed and results of a representative experiment are shown. *, p < 0.05
SOD2 Restores Cell Viability and Reduces ROS Levels in TRPM2-depleted Cells in Vitro
To evaluate the role of elevated mitochondrial ROS in modulation of cell viability, TRPM2-depleted SH-SY5Y cells and scrambled control cells were stably transfected with empty vector, SOD1, SOD2, or both. Expression of SOD1 and SOD2 was confirmed by Western blotting (Fig. 8D). Viability of untreated cells or cells treated with doxorubicin for 24 h was analyzed by XTT. Scrambled control cells expressing empty vector, SOD1, SOD2, or both had similar viability by XTT analysis at 24 h after doxorubicin (Fig. 8A). TRPM2-depleted cells transfected with empty vector had significantly lower viability compared with scrambled control cells. However, expression of SOD1, SOD2, or both significantly increased the survival of TRPM2-depleted cells after doxorubicin. In fact, the viability of TRPM2-depleted cells transfected with SOD2 was not significantly different from that of scrambled control cells at 24 h (Fig. 8A, p = 0.07). Levels of mitochondrial superoxide were quantitated at baseline and following doxorubicin with MitoSOX Red fluorescence and confocal microscopy. Without doxorubicin treatment, TRPM2-depleted SH-SY5Y cells transfected with empty vector showed significantly greater levels of mitochondrial ROS compared with scrambled control cells (Fig. 8B). In contrast, TRPM2-depleted cells expressing SOD1, SOD2 or both showed similar levels of ROS compared with scrambled control cells stably expressing the same SOD constructs. Cells expressing SOD2 had significantly lower levels of ROS compared with empty vector or SOD1 expressing cells. After doxorubicin, TRPM2-depleted cells transfected with empty vector had significantly greater levels of superoxide than scrambled control cells. In TRPM2-depleted cells treated with doxorubicin, the lowest levels of ROS were found in SOD2-transfected cells. TRPM2-depleted cells transfected with SOD2 had ROS levels similar to scrambled control. ROS levels in cells expressing SOD1 were slightly reduced compared with vector-transfected TRPM2-depleted cells, but results did not reach statistical significance. These results confirm that higher levels of mitochondrial ROS in TRPM2-depleted cells play a major role in reduced viability and increased sensitivity to doxorubicin. Of note, the decline in ATP production was significantly greater in TRPM2-depleted cells compared with scrambled cells (Fig. 8C). TRPM2-depleted cells transfected with SOD1 or both SOD1 and -2 showed modest increases in ATP levels compared with cells transfected with empty vector, but ATP production in all of the TRPM2-depleted cell lines remained significantly reduced compared with scrambled control cells transfected with the same constructs. Whereas expression of SOD2 reduced mitochondrial ROS and maintained viability of TRPM2-depleted cells in culture, the defect in ATP production was not rescued by SOD2 expression.
FIGURE 8.

SOD2 expression increases viability of TRPM2-depleted cells and reduces ROS. A, SH-SY5Y cells in which TRPM2 was depleted (KO) or scrambled (Scr) control cells were transfected with empty vector, SOD1, SOD2, or both. Cell proliferation was measured by XTT assay in untreated cells and at 24 h after treatment with 0.3 μm doxorubicin. Results are expressed as OD readings after doxorubicin treatment normalized to untreated control. Mean ± S.E. are shown for one representative experiment of two, each performed and analyzed in quadruplicate. *, p ≤ 0.05. B, SH-SY5Y cells depleted of TRPM2 or scrambled control cells transfected with SOD1, SOD2, or both were loaded with MitoSOX Red and studied at baseline and 24 h after treatment with 0.3 μm doxorubicin. Intensity of MitoSOX fluorescence was quantitated with confocal microscopy. Mean ± S.E. fluorescence intensity of a minimum of 100 cells in at least 10 fields in each group was quantified and analyzed for untreated and doxorubicin-treated cells. *, p < 0.05. C, ATP levels were measured with the Cell Titer Glow Assay at baseline and 24 h after treatment with 0.3 μm doxorubicin. Two experiments were performed with similar results and a representative one is shown. Results are expressed as mean ± S.E.; *, p < 0.05. D, Western blot analysis of lysates from SH-SY5Y cells depleted of TRPM2 or scrambled control cells stably transfected (Tx'd) with empty vector, SOD1, SOD2 or both. Blots were probed with anti-SOD1 or SOD2 antibodies. Actin was probed to confirm equivalent loading.
MitoTEMPO Reduces Mitochondrial ROS and Preserves Viability of TRPM-S Expressing Cells
To verify that the increase in ROS in TRPM2-depleted cells was from the mitochondria, a second approach to reduce TRPM2 function was utilized, inhibition with TRPM2-S. Expression of TRPM2-S was previously shown to inhibit TRPM2-L channel gating (26) and suppress cell viability, mitochondrial function, and ATP production (41). Here, superoxide levels were measured with MitoSOX Red in SH-SY5Y cells stably transfected to express vector (V), full-length TRPM2 (L), or TRPM2-S (S) (Fig. 9A). No differences in baseline superoxide levels were observed between V, L, or S expressing cells. However, a significant increase in mitochondrial ROS was seen in TRPM2-S expressing cells following doxorubicin treatment (Fig. 9B). Cellular ROS levels were also measured with CM-H2DCF-DA (DCF). In cells expressing S, cellular ROS levels were slightly increased at baseline (Fig. 9D) and dramatically after doxorubicin treatment (Fig. 9E) compared with TRPM2-L (L) or empty vector (V)-transfected cells.
FIGURE 9.

TRPM2 inhibition with TRPM2-S results in increased mitochondrial and cytoplasmic ROS, which is reduced by MitoTEMPO. SH-SY5Y cells transfected with empty vector (V), TRPM2-L (L), or TRPM2-S (S) were loaded with MitoSOX Red (A–C) or CM-H2DCF-DA (DCF; D–F) and studied at baseline (A and D) or after treatment with 0.3 μm doxorubicin for 24 h (B, C, E, and F). Some SH-SY5Y cells were pretreated with the mitochondrial antioxidant MitoTEMPO prior to doxorubicin (C and F). Intensity of MitoSOX fluorescence and DCF were quantitated with confocal microscopy. Representative fields are shown on the left. Mean ± S.E. fluorescence intensity of a minimum of 100 cells in at least 10 fields for each group was quantified and analyzed. Four different experiments for each group of cells were performed with MitoSOX, three with DCF, and results (mean ± S.E.) of a representative experiment are shown on the right. *, p < 0.05.
SH-SY5Y cells expressing L, S, or V were then pretreated with the mitochondrial superoxide scavenger MitoTEMPO, and mitochondrial and cellular ROS levels were determined after doxorubicin. Mitochondrial ROS levels quantitated with MitoSOX were reduced in all groups by MitoTEMPO, but greater in TRPM2-S expressing cells than in V or L expressing cells (Fig. 9C). Following pretreatment with MitoTEMPO, the increase in cellular ROS measured with DCF was also significantly reduced in S expressing cells compared with V or L (Fig. 9F). This supports the conclusion that the major source of the ROS increase in cells following TRPM2 inhibition was mitochondrial, rather than secondary to increased Nox activity. This is consistent with the finding that Nox2 and Nox4 expression are not increased in TRPM2-depleted cells (Fig. 4). To further examine the source of ROS, cells expressing TRPM2-S were pretreated with MitoTEMPO, the Nox inhibitor diphenyleneiodium chloride (DPI), or vehicle DMSO, and then treated with doxorubicin. MitoTEMPO significantly reduced the rise in both mitochondrial and cellular ROS levels following treatment with doxorubicin, but pretreatment with DPI reduced neither (Fig. 10, A and B). The importance of the ROS increase in reducing viability of cells in which TRPM2 is inhibited was then studied. MitoTEMPO pretreatment significantly increased the survival of TRPM2-S expressing cells treated with doxorubicin (Fig. 10, C and D), demonstrating the important role of mitochondrial ROS in reducing cell viability following TRPM2 inhibition.
FIGURE 10.

MitoTEMPO but not DPI significantly reduces ROS and preserves cell viability after doxorubicin treatment in cells in which TRPM2 is inhibited. TRPM2-S expressing cells loaded with MitoSOX Red (A) or CM-H2DCF-DA (DCF) (B) were pretreated with MitoTEMPO, DPI, or vehicle (DMSO), and then treated with 0.3 μm doxorubicin. Intensity of MitoSOX fluorescence and DCF were quantitated with confocal microscopy. Mean ± S.E. fluorescence intensity of a minimum of 100 cells in at least 10 fields is shown for each group of untreated or doxorubicin-treated cells for a representative experiment. Viability of cells pretreated with MitoTEMPO or vehicle was measured with trypan blue exclusion and percentages of live and dead cells are shown (C and D). Three experiments were performed, and representative results are shown. *, p < 0.05. SH-SY5Y cells expressing empty vector (V), TRPM2-L (L), TRPM2-S (S), or the TRPM2 pore mutant E960D were untreated (E) or treated with 0.3 μm doxorubicin for 24 h (F). Mitochondrial ROS levels were quantitated with MitoSOX fluorescence and confocal microscopy. Two experiments were performed. Mean ± S.E. fluorescence intensity of a minimum of 100 cells in at least 10 fields is shown for each group of untreated and doxorubicin-treated cells from a representative experiment. *, p < 0.05.
Ca2+ Entry via TRPM2 Is Required for Reduction of Mitochondrial ROS Post-doxorubicin
To establish whether calcium influx through TRPM2 is involved in maintaining low levels of mitochondrial ROS, the TRPM2 pore mutant E960D was expressed in SH-SY5Y wild type parental cells and ROS measured in untreated cells and following doxorubicin exposure. No differences in mitochondrial ROS were observed in untreated E960D expressing cells compared with cells expressing the L or S isoforms (Fig. 10E). However, following doxorubicin, mitochondrial ROS levels were much greater in cells expressing TRPM2-S or E960D compared with V or L (Fig. 10F). These data support the conclusion that calcium entry through activated TRPM2 is involved in maintaining lower mitochondrial ROS after doxorubicin. This is consistent with the ability of TRPM2-L but not E960D to restore cell viability and ATP production in the KO.
SK-N-DZ and SK-N-FI Neuroblastoma Cells Also Demonstrate Decreased Cell Viability and Bioenergetics and Increased ROS Production after Doxorubicin when TRPM2 Is Inhibited
To confirm these findings in additional neuroblastoma cell lines, SK-N-DZ and SK-N-FI cells were transiently transfected with empty vector, wild type TRPM2, or TRPM2-S. In both of these cell lines, cell viability measured by XTT assay was significantly reduced in cells expressing TRPM2-S compared with vector or TRPM2-L expressing cells, both before and after doxorubicin treatment (Fig. 11A). Whereas SK-N-DZ cells expressing TRPM2-L had greater viability at 24 and 48 h than vector-expressing cells, viability of SK-N-FI cells expressing TRPM2-L was slightly reduced at 0 and 24 h compared with vector-expressing cells, although still significantly greater than TRPM2-S-expressing cells. This may be due to the high level of TRPM2-L overexpression. Mitochondrial ROS levels and ATP levels in empty vector, TRPM2-L, or TRPM2-S expressing cells were not significantly different in untreated cells. After doxorubicin, mitochondrial ROS levels in SK-N-DZ and SK-N-FI cells expressing TRPM2-S were significantly increased compared with levels in empty vector or TRPM2-L expressing cells, which were similar to each other (Fig. 11B). After doxorubicin, ATP production was significantly reduced in TRPM2-S expressing cells compared with empty vector or TRPM2-L-transfected cells, which were not statistically different (Fig. 11C). These experiments demonstrate that TRPM2 inhibition reduces viability, and influences mitochondrial function and ROS in multiple neuroblastoma cell lines.
FIGURE 11.
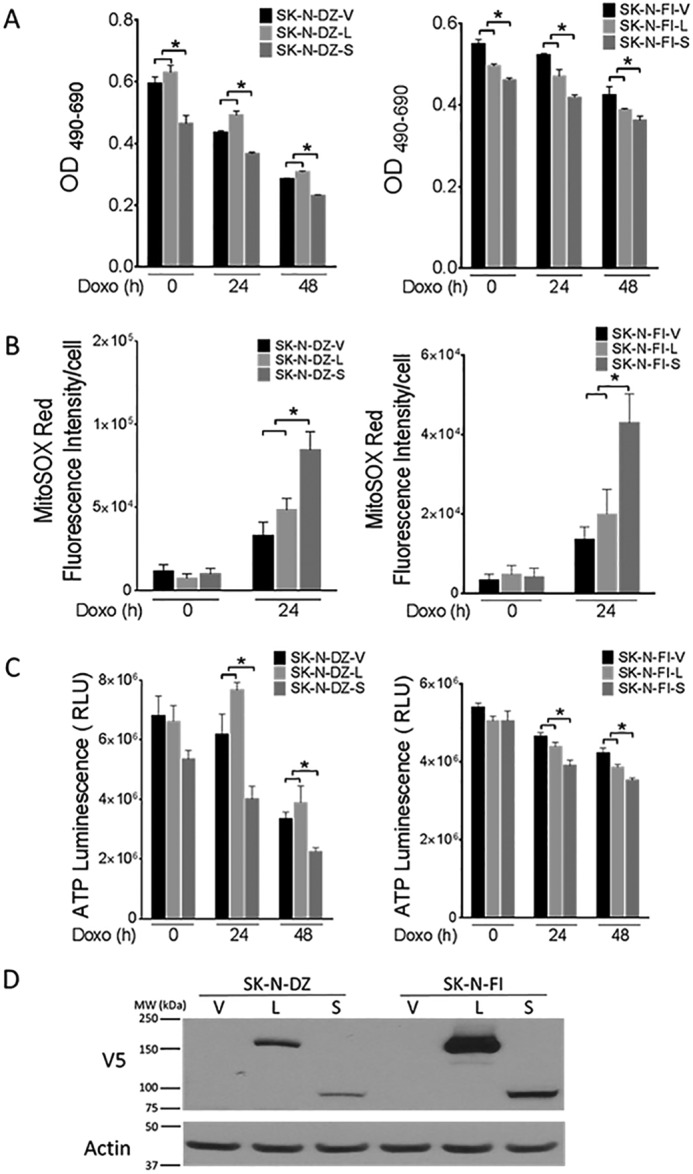
SK-N-DZ and SK-N-FI neuroblastoma cells in which TRPM2 is inhibited demonstrate decreased cell viability and ATP levels, and increased ROS production after doxorubicin. A, SK-N-DZ and SK-N-FI cells were transiently transfected with empty vector, wild type TRPM2, or TRPM2-S. Cell proliferation was measured by XTT assay in untreated cells and at 24 and 48 h after treatment with 1 μm doxorubicin. Results are expressed as OD readings after doxorubicin treatment. Mean ± S.E. are shown for one representative experiment of two, each performed and analyzed in quadruplicate. *, p ≤ 0.01 (SK-N-DZ); p ≤ 0.05 (SK-N-FI). B, SK-N-DZ and SK-N-FI cells transfected with empty vector, wild type TRPM2, or TRPM2-S were loaded with MitoSOX Red and studied at baseline and 24 h after treatment with 1 μm doxorubicin. Intensity of MitoSOX fluorescence was quantitated with confocal microscopy. Mean ± S.E. fluorescence intensity of a minimum of 100 cells in at least 10 fields in each group was quantified and analyzed for untreated and doxorubicin-treated cells. *, p < 0.05. C, ATP levels were measured with the Cell Titer Glow Assay at baseline, 24 and 48 h after treatment with 1 μm doxorubicin. Two experiments were performed with similar results and a representative one is shown. Results are expressed as mean ± S.E.; *, p < 0.04. D, Western blot of lysates from SK-N-DZ and SK-N-FI cells transfected with empty vector, wild type TRPM2, or TRPM2-S. Blots were probed with anti-V5 and anti-actin antibodies to confirm equivalent loading.
Discussion
TRPM2 has an important role in cell survival following oxidative stress or ischemic injury (35–37, 40). Recent studies have shown that TRPM2 is highly expressed in a number of malignancies including melanoma, lung, neuroblastoma, and breast cancer (39, 41, 42), suggesting that it plays a role in promoting tumor growth, and that inhibition may be a novel therapeutic approach. Here, TRPM2 was depleted in neuroblastoma cells with CRISPR/Cas9 technology as a model to explore its role in tumor growth and cell survival after doxorubicin. These studies convincingly demonstrated the significant impact of TRPM2 inhibition on reduction of mitochondrial function, impairment of cellular bioenergetics, enhancement of mitochondrial ROS production, and its potential role as a novel therapeutic approach in cancer. This is very consistent with past and present work that elucidated the importance of mitochondrial energy reprogramming in cancer growth and the recognition that drugs that target mitochondrial function may have great clinical potential as potent anti-cancer agents (56).
The first major finding of this work is that TRPM2 depletion reduces tumor growth in xenografts and significantly increases neuroblastoma sensitivity to doxorubicin. The mechanism involved a reduction in HIF-1/2α, and proteins involved in glycolysis (ENO2), oxidative stress (FOXO3a, SOD 1/2), and mitochondrial function downstream of HIF. HIFs are frequently up-regulated in cancer, important in tumor progression, and mediate expression of a number of genes involved in many processes promoting tumor growth including oxidative stress, mitochondrial function, and ROS production (50, 54, 57). Our findings are consistent with the reports that HIF-1/2α promotes a more aggressive phenotype including disseminated disease and poor outcome in neuroblastoma patients (46, 47, 58). They are also consistent with a recent report that targeting the TRPM2 channel fostered cell death in T cell leukemia (59). The second important finding here is that mitochondrial function is significantly impaired by TRPM2 depletion; mitochondrial proteins including BNIP3 and COX4.1/4.2, oxygen consumption rate, and ATP levels after doxorubicin were all significantly reduced in the knock-out. A proposed scheme for the impact of TRPM2 inhibition on mitochondrial function, ROS production, and cell viability is shown in Fig. 12. The significant decrease in expression of COX4.1/4.2, involved in complex IV activity (50), may contribute significantly to the decrease in ATP production and to increased ROS due to reaction of electrons with oxygen prior to complex IV (55). Reduced BNIP3, a key regulator of mitophagy, may further impact mitochondrial function in TRPM2-depleted cells through impaired removal of dysfunctional mitochondria. When TRPM2 was inhibited with a different approach, use of dominant-negative TRPM2-S, mitochondrial defects were also found (41). In these cells, a HIF-1α target gene NDUFA4L2 (NADH dehydrogenase (ubiquinone) 1α subcomplex, 4-like 2) was decreased. NDUFA4L2 can attenuate mitochondrial oxygen consumption through inhibition of Complex I activity, limiting ROS production under low-oxygen (50). Together, these data confirm that TRPM2 is essential for normal mitochondrial function and cellular bioenergetics, particularly under oxidant stress.
FIGURE 12.

Scheme of the influence of TRPM2 inhibition on mitochondrial function, ROS production, and cell survival. Inhibition of TRPM2 results in reduced intracellular calcium entry and mitochondrial calcium uptake in response to TRPM2 activation. Decreased intracellular calcium results in reduced HIF-1/2α expression as well as genes transcriptionally regulated by HIF-1/2α including FOXO3a, which modulates SOD1/2 expression, and mitochondrial genes including BNIP3 and COX 4.1/4.2 (Complex IV). Decreased mitochondrial calcium uptake together with decreased expression of mitochondrial genes impairs mitochondrial function including the electron transport chain. This contributes to reduced ATP production and increased mitochondrial superoxide production, particularly with reduced SOD1/2, and subsequently results in a rise in cellular ROS. Decrease in BNIP3 contributes to impaired mitophagy and accumulation of dysfunctional/damaged mitochondria, which further results in increased ROS and susceptibility to chemotherapeutic agents, and reduced cell survival and tumor growth.
The third key finding of this report is that TRPM2 inhibition with two fundamentally different approaches, depletion or inhibition with a dominant-negative, both resulted in significant increases in mitochondrial ROS. MitoSOX measures mitochondrial superoxide anion, which is dismutated in the mitochondria to hydrogen peroxide by SOD2. SOD1 catalyzes superoxide anion conversion to hydrogen peroxide primarily in the cytoplasm. Increased expression of SOD2 had a significant impact on reducing superoxide production and increasing cell viability in TRPM2-depleted cells, confirming the importance of mitochondria as the source of ROS. However, expression of SOD2 affected ATP production minimally. A possible explanation is that the defect in mitochondrial function (the electron transport chain) resulting in increased superoxide production, and reduced ATP production was not repaired by increased SOD2 (Fig. 12). The mitochondrial antioxidant MitoTEMPO also inhibited the increase in mitochondrial ROS and preserved cell viability when TRPM2-inhibited cells were treated with doxorubicin, further confirming the important contribution of mitochondrial ROS in reduced cell survival. In contrast, pretreatment with DPI, an inhibitor of NADPH oxidase, did not significantly inhibit the cellular rise in ROS after doxorubicin. These data, together with the observation that Nox2 and Nox4 levels were not altered in TRPM2-inhibited cells, strongly support the conclusion that the increase in cellular ROS predominantly originates in mitochondria and is associated with significantly reduced mitochondrial function.
Expression of TRPM2-L restored cell viability and cellular bioenergetics in the TRPM2 KO, but E960D did not, demonstrating the role of TRPM2-mediated calcium entry in maintenance of cell viability and ATP production. Also, experiments with the TRPM2 pore mutant E960D and TRPM2-S showed that calcium influx through TRPM2 is involved in TRPM2-mediated suppression of mitochondrial ROS. One potential pathway through which TRPM2 may influence cell viability and energetics is calcium-mediated regulation of HIF-1/2α expression (60–63). Stabilization of HIF-1/2α expression by calcium activation of calcineurin (60) is a potential mechanism responsible for the greater expression of HIF-1/2 and the mitochondrial genes it regulates including BNIP3 and NDUFA4L2 (53, 64) in TRPM2 full-length expressing cells. This would help sustain mitochondrial function and reduce ROS in the presence of oxidative stress. Alternatively, low level mitochondrial Ca2+ uptake has been shown to have a role in regulation of cell bioenergetics (65–67). Mitochondrial function may be impaired by the very low calcium uptake in TRPM2-depleted cells. Although evidence suggests that TRPM2 is not present on mitochondrial membranes, TRPM2 could influence mitochondrial calcium by its localization in the ER (41), for example, through the close spatial relationship between ER and mitochondria (ER-mitochondrial tethering) (68, 69). TRPM2-mediated Ca2+ influx could also have a role in regulation of the mitochondrial calcium uniporter (70). The mechanisms through which calcium influx through TRPM2 regulates mitochondrial ROS are currently under investigation. The decreased proliferation of untreated SK-N-DZ and SK-N-FI cells expressing TRPM2-S (Fig. 11A) may be due to reduced calcium influx leading to lower levels of mitochondrial proteins including HIF-1/2α and mitochondrial function, as shown for SH-SY5Y cells expressing TRPM2-S (40, 41).
Previous work has shown that ROS are often increased in malignant cells, possibly as a result of the increased metabolism required to support accelerated cell growth (71), and play a key role in maintaining signaling pathways that promote proliferation and survival. However, when ROS in cancer cells increase above a certain threshold, cells become more susceptible to oxidative stress-induced cell death (72, 73). Recent evidence suggests that antioxidant treatment may be harmful and actually increase tumor burden (74–77), whereas raising ROS levels may induce cancer cell death (78–80). Our experiments here with inhibition of TRPM2, which is highly expressed in a number of cancers, support this conclusion. After exposure to doxorubicin, which increases oxidative stress, depletion or inhibition of TRPM2 resulted in a large increase in ROS levels, enhancing cell death significantly. In neuroblastoma xenograft experiments shown here and in ones utilizing the breast cancer cell line MCF-7,4 we observed that tumor growth was significantly reduced in cells in which TRPM2 was inhibited. A theoretical concern with this mechanistic approach is that if ROS levels are not sufficiently raised, tumorigenesis could be promoted (81); this was not observed in our experiments with TRPM2 inhibition thus far. In all of our experiments with neuroblastoma cell lines, treatment of TRPM2-depleted or inhibited cells with doxorubicin resulted in reduced cancer cell survival compared with TRPM2 expressing cells.
In summary, we demonstrate a dramatic effect on in vitro survival and in vivo xenograft growth of TRPM2 depletion, resulting from reduced calcium entry, mitochondrial dysfunction, compromised cellular bioenergetics, and increased ROS. Future research efforts will focus on understanding the pathways through which reduced calcium entry decreases HIF-1/2α expression, impairs mitochondrial function, and enhances mitochondrial and cellular ROS levels. Because TRPM2 is up-regulated in many types of cancer (42), exploration of the functional role of TRPM2 in cell survival and development of an effective inhibitor will have broad applicability. TRPM2 inhibition has great promise as a novel therapeutic approach, in particular for designs that aim to kill cancer cells through increasing ROS levels or impairment of mitochondrial function.
Experimental Procedures
Depletion of TRPM2 with CRISPR and Generation of Stably Transfected Neuroblastoma Cell Lines
The neuroblastoma cell line SH-SY5Y was purchased from the American Type Culture Collection (ATCC, Manassas, VA). SH-SY5Y cells were cultured in 50% DMEM and 50% Ham's F-12 (DMEM/F-12 50/50) medium supplemented with 10% heat-inactivated FBS. To deplete cells of endogenous TRPM2 with CRISPR (Clustered regularly interspaced short palindromic repeats) technology, TRPM2 gRNA in pCas9-guide vector (target sequence GAGGAAAGCTGGCTCGGAGC), negative scrambled control vector, and donor vector containing 600-bp left and right homologous arms to the TRPM2 gene with GFP with puromycin markers, were purchased from OriGene Technologies Inc. (Rockville, MD). Either TRPM2 gRNA vector or scrambled vector was cotransfected with donor vector into SH-SY5Y (wild type) neuroblastoma cells using the Neon Transfection System (Invitrogen), following the manufacturer's instructions. Cells were passed up to 8 passages with 0.5 μg/ml of puromycin selection. TRPM2 genomic DNA was verified by RT-PCR at passages 2 and 4. Depletion of TRPM2 protein expression was confirmed by Western blot analysis at passages 6, 7, and 8. Cells at passage 8 were then subjected to single clone selection in the presence of 0.5 μg/ml of puromycin. All clones were subsequently screened by real-time PCR and Western blot analysis, and three TRPM2 knock-out clones and three scrambled clones were selected for further analysis. In general, puromycin was removed from cultures 7–14 days before experiments were performed.
To modulate TRPM2 isoform expression, SH-SY5Y cells at 90% confluence were transfected with pcDNA3.1/V5-His TOPO expressing L, S, or empty vector for 48 h using Lipofectamine 2000 (Invitrogen) (26). Stably transfected cell lines were selected using 600 μg/ml of G418 (Geneticin, an analogue of neomycin) (Gemini Bio-Products, West Sacramento, CA) and cell cultures were maintained in the presence of 250 μg/ml of G418 for a minimum of two months before cells were used for experiments.
In some experiments, SH-SY5Y cells in which TRPM2 was depleted with CRISPR or scrambled control, cells were transfected with wild type TRPM2 or the E960D pore mutant constructs subcloned into pcDNA3.1/V5-His TOPO using the Neon Transfection System (Invitrogen) following the manufacturer's instructions. SOD1 (Addgene, Cambridge, MA) and SOD2 (gift of Dr. Paul M. Hwang, NHLBI, NIH) constructs subcloned into pcDNA3.1/V5-His TOPO were also transfected into SH-SY5Y cells using the Neon Transfection System. Stably transfected cells were generated and maintained by culture in 0.5 μg/ml of puromycin and/or 250 μg/ml of G418 as appropriate. For doxorubicin studies, plates were treated when cells were 70–80% confluent and harvested at the time points indicated.
In other experiments, SK-N-DZ and SK-N-FI cells were transiently transfected with empty vector, TRPM2-L, or TRPM2-S subcloned in pcDNA3.1/V5-His TOPO and transfected with the Neon Transfection System. Cells were studied at 48–96 h after transfection and expression was confirmed with Western blotting.
RT-PCR of TRPM2 in Neuroblastoma Cell Lines to Confirm TRPM2 Depletion
RNA was prepared from neuroblastoma cell lines to confirm TRPM2 depletion using RNeasy Minikit (Qiagen, Valencia, CA). First-strand cDNA synthesis was performed from 500 to 2000 ng of RNA using SuperScript First Strand kit (Invitrogen by Life Technologies). The cDNA was then subjected to the quantitative real-time PCR using 4.5 ml of the first-strand cDNA reaction (×10 diluted) and TaqMan gene expression assays (Applied Biosystems, Foster City, CA). TRPM2 TaqMan assay was custom designed to detect part of Exon1, which was targeted by CRISPR/cas9 technology: forward primer, 5′-CTCAGCCCTGAGGAAAGC; reverse primer, 5′-CGGAGATTGGAGACCATCC, reporter, 5′-TGCCCAGAAGGGTCACTGACCT. Predesigned TaqMan assays were used for reference genes: GAPDH (Applied Biosystems catalog number 4333764) and TBP (Applied Biosystems catalog number 4333769). Real-time PCR was performed using QuantStudio 12KFlex with 384-well real-time PCR system (ThermoFisher, Waltham, MA) or StepOne plus with 96-well real-time PCR system (Applied Biosystems). Reactions were run in three or four replicates. The PCR results were analyzed using ExpressionSuite software (Life Technologies) as relative mRNA levels of cycle threshold (CT) value using wild type of neuroblastoma cell line as a calibrator.
Generation of E960D TRPM2 Mutant Expressing Cells with Retroviral Gene Transfer and Cell Sorting
Wild-type human TRPM2-L, S, and E960D mutant (HA-tagged) cDNA were cloned using NotI and EcoRI sites into the pMSCV bicistronic retroviral vector (MIG vector). This vector contains internal ribosome entry site, and enhanced green fluorescent protein (EGFP) (82). Retroviruses were produced by transient transfection in amphotropic packaging 293 cell lines. SH-SY5Y cells were cultured in retroviral supernatant with 10 μg/ml of Polybrene and centrifuged at 1,400 × g at 32 °C for 2 h. Cells were re-suspended in fresh DMEM/F-12 medium with 10% FBS, at 37 °C, 5% CO2 for 3 days. The GFP positive cells were sorted using a BD Biosciences FACSAria SORP.
TRPM2 Current in Neuroblastoma Cells
TRPM2 currents were measured in TRPM2-depleted SH-SY5Y neuroblastoma cells or scrambled control cells with whole cell patch clamp (83). Fire-polished pipettes (tip diameter 2 μm) with resistances of 2–4 MΩ when filled with pipette solutions were used. Pipette solution contained (in mm): CsCl, 110; TEA·Cl, 20; HEPES, 10; EGTA, 10; MgATP, 5; pH 7.2, and bathing solution contained (in mm): NaCl, 127; CsCl, 5.4; CaCl2, 2; MgSO4, 1.3; 4-aminopyridine, 4; HEPES, 10; Na-HEPES, 10; glucose, 15; verapamil, 0.001; pH 7.4. Solutions were designed to minimize l-type Ca2+ current (ICa), Na+,K+-ATPase current (INaKATPase), Na+/Ca+ exchange current (INaCa), and potassium currents (IK). Neuroblastoma cells were held at −70 mV. To inactivate the fast inward Na+ current, the holding potential was switched to −40 mV before application of voltage ramp (+100 to −100 mV; 500 mV/s). ADPR (300 μm) was included in the pipette solutions to activate TRPM2 channels (14). In other experiments, ADPR was withheld to show specificity of TRPM2 currents.
Cell Proliferation Assay
Cells from stably transfected cell lines or CRISPR depletion were seeded on 96-well plates and cultured in media with 250 μg/ml of G418 or 0.5 μg of puromycin, respectively, for 96 h. Cell proliferation was assessed by measurement at A490 nm/690 nm using XTT cell proliferation assay (Trevigen Inc., Gaithersburg, MD) following the manufacturer's instructions (84). In some experiments, cells were treated with doxorubicin (0.3 μm) for specified durations during cell culture. Viability after doxorubicin was quantitated with trypan blue exclusion and/or XTT assay.
TRPM2-depleted Xenograft Tumors
To determine the role of TRPM2 in tumor growth, athymic Nude-FOXn1nu female mice (Harlan Laboratories, Inc., Indianapolis, IN) were injected in one flank with 1.5 × 10⁷ SH-SY5Y cells depleted of TRPM2 with CRISPR, or scrambled CRISPR or wild type parental control cells. Approximately 10–15 mice per group were used in each of two experiments. Tumor length and width were measured twice weekly with a caliper to determine tumor growth over 6–7 weeks, and the tumor area was calculated. At the completion of each experiment, tumors were harvested, weighed, and frozen for analysis. All protocols and procedures applied to the mice in this study were approved by the Institutional Animal Care and Use Committee of the Pennsylvania State University College of Medicine.
Immunoblot Analysis
For cell culture or tumors from neuroblastoma xenografts, whole cell and tumor lysates were prepared with Triton lysis buffer (50 mm Tris, pH 7.4, 150 mm NaCl, 1% Triton X-100, 1 mm EDTA, 10 mm NaF, protease inhibitor and phosphatase inhibitor), followed by a 10-min centrifugation at 10,000 rpm at 4 °C. The supernatants were collected and subjected to 8–15% SDS-PAGE as previously described. All gels then were trans-blotted onto nitrocellulose membranes. Blots were probed with anti-TRPM2-C (1:300; Bethyl Laboratories, Montgomery, TX) (26), or anti-V5-HRP (1:2000; Invitrogen) antibodies to confirm expression of endogenous or transfected TRPM2 channels. Blots were also probed with antibodies to BNIP3 (1:300; Abcam, Cambridge, MA), COX 4.1 (1:1,000; EMD Millipore, Temecula, CA), COX 4.2 (1:3,000; Abcam), enolase 2 (ENO2; 1:2,000; Abnova, Taipei, Taiwan), FOXO3a (1:400; Cell Signaling), HIF-1α (1:250; Cell Signaling), HIF-2α (1:600; Novus, Littleton, CO), Nox2 (1:2,000; Abcam), Nox4 (1:3,000; Abcam), SOD1 (1:5,000; Calbiochem, EMD Millipore), SOD2 (1:3,000; Abcam), actin (1:20,000; Sigma), and C1ORF43 (1:400; Abcam). Blots were washed and incubated with appropriate horseradish peroxidase (HRP)-conjugated antibodies (1:2,000). Enhanced chemiluminescence (ECL) was used for detection of signal. Intensity of bands was quantitated with densitometry, and normalized with loading controls.
Measurement of Mitochondrial O2 Consumption and ATP Levels
Oxygen consumption rate was measured in neuroblastoma SH-SY5Y cells at 37 °C in an XF96 extracellular flux analyzer (Seahorse Bioscience). Neuroblastoma cells were sequentially exposed to oligomycin, FCCP, and rotenone, using the XF Cell Mito Stress Kit (Seahorse Bioscience) according to the manufacturer's instructions. Preliminary experiments were performed to select optimal seeding density (105 cells/well) and compound concentrations, according to the manufacturer's instructions. To measure ATP levels, neuroblastoma SH-SY5Y cells or cells isolated from neuroblastoma xenografts were lysed and ATP (luminescence) levels were measured using a Cell Titer-Glo Luminescent Cell Viability Assay kit (Promega, Madison, WI) according to the manufacturer's instructions.
Measurement of Intracellular and Mitochondrial ROS Using Confocal Microscopy
SH-SY5Y cells were cultured in glass bottom dishes (MatTek, Ashland, MA) with DMEM/F-12 (Corning, Manassas, VA) containing 10% fetal bovine serum (Gibco by Life Technologies, Eugene, OR). MitoSOX (Molecular Probes by Life Technologies) was used as a marker for mitochondrial superoxide measurement. Cells were loaded with MitoSOX at a final concentration of 5 μm for 20 min, at 37 °C, according to the manufacturer's recommendations. Intracellular ROS was detected by staining with the fluorescent probe CM-H2DCF-DA (Molecular Probes by Life Technologies), which although often used to measure cytosolic ROS is less specific for cellular compartment or type of ROS. CM-H2DCF-DA was added to the cells in a final concentration of 1 μm for 20 min at 37 °C. Cells in glass bottom dishes were washed 3 times after 20 min CM-H2DCF-DA or MitoSOX loading and used for confocal microscopy imaging immediately. Cells were untreated or treated with 0.3 μm doxorubicin for 24 h before loading and microscopy. In some experiments, cells were also pretreated with 25 μm MitoTEMPO (Enzo Life Sciences, Farmingdale, NY), 0.5–5 μm DPI (Sigma) or DMSO for 60 min before doxorubicin and during the experiment. For live cell ROS measurements, confocal microscopy (Leica AOBS SP8 laser scanning confocal microscope; Leica Microsystems, Heidelberg, Germany) was used along with a heated live cell stage equipped with a humidified 5% CO2 perfusion system (TOKAI HIT). Images were captured at 1024 × 1024 pixels using the ×63/1.2 high numerical aperture apochromatic water-immersion objective. For three-dimensional image data set acquisition, the excitation beam was first focused at the maximum signal intensity focal position within the sample and the photon counting mode available within the hybrid detector (HyD) was used to register the fluorescence signals or emitted photons/pixels. Later on, the beginning and end of the three-dimensional stack (i.e. the top and the bottom optical sections) were set based on the signal level degradation. A series of two-dimensional images for a selected three-dimensional stack volume were then acquired with a ∼0.3 μm section thickness (z axis). For each cell volume reported here, z-section images were compiled and finally the three-dimensional image restoration was performed using Imaris software (Bitplane, Switzerland). The Surface Module available within the Imaris was used to compute fluorescence intensities from three-dimensional cell volumes. A Gaussian noise removal filter was used. Sum of all the fluorescence intensities above the lower threshold level was then determined and finally the fluorescence intensity per cell was obtained by dividing the sum of all fluorescence intensities by the number of cells. Similar quantitation protocol was applied to all three-dimensional image volume datasets generated using similar setting parameters.
Statistics
All results are expressed as mean ± S.E. For analysis of TRPM2 current as a function of group and voltage, two-way analysis of variance (ANOVA) was used. For analysis of protein expression levels, O2 consumption, XTT, trypan blue exclusion, ATP levels, and ROS levels, one-way ANOVA or Student's t test was used. In all analyses, p ≤ 0.05 was taken to be statistically significant.
Author Contributions
L. B. performed and designed experiments involving ROS and bioenergetics measurements, generation of E960D pore mutant, and those involving SOD1/2 shown in Figs. 5–11; S. J. C. designed and established the TRPM2 CRISPR knockout and scrambled SH-SY5Y cell lines, assisted with in vitro and xenograft experiments, and worked with L. B. in preparation of figures; K. C. provided technical assistance and performed in vitro cell viability experiments (Fig. 10), assisted with xenografts, and Western blotting analysis shown in Fig. 4; K. K. performed xenograft experiments in Fig. 3 with the assistance of J. L. and B. G.; T. A. helped design and analyze experiments involving ROS and confocal microscopy; I. H. L. assisted with analysis of TRPM2-depleted clones in Figs. 1 and 2; J. F. W. and Z. Q. Z. performed electrophysiological characterization of TRPM2-depleted and scrambled clones shown in Fig. 1; S. D. provided advice on stably transfecting SH-SY5Y cell with retrovirus; B. G. assisted with xenograft experiments; H. G. W. assisted with design of CRISPR deletion strategy; M. M. provided advice on OCR and ATP studies; J. Y. C. assisted in project conception and in electrophysiological studies; B. A. M. conceived and coordinated the study, supervised overall experimental design and data analysis, and wrote the paper. All authors analyzed the results and approved the final version of the manuscript.
Acknowledgments
Confocal images were generated using the Leica SP8 (S10OD010756–01A1) located in the Microscopy Imaging Core Facility. SOD2 plasmid (PBI-EGFP-hMnSOD) was kindly provided by Dr. P. M. Hwang, NHLBI, National Institutes of Health.
This work was supported in part by National Institutes of Health Grants RO1-GM117014 and RO1-DK46778 (to B. A. M.), RO1-HL-58672, RO1-HL74854, and RO1-HL123093 (to J. Y. C.), R01GM109882, R01HL086699, R01HL119306, and 1S10RR027327 (to M. M.), grants from the Hyundai Hope on Wheels, the Four Diamonds Fund of the Pennsylvania State University, American Heart Association (Great Rivers Affiliate) Grant-in-aid 15GRNT25680042, and PA CURE Grant (Project 5) SAP#4100062220. The authors declare that they have no conflicts of interest with the contents of this article. The content is solely the responsibility of the authors and does not necessarily represent the official views of the National Institutes of Health.
B. A. Miller, W. Zhang, K. Conrad, unpublished observations.
- TRP
- transient receptor potential
- ADPR
- ADP-ribose
- ROS
- reactive oxygen species
- Nox
- NADPH oxidases
- FOXO3a
- Forkhead box transcription factor 3a
- SOD2
- superoxide dismutase 2
- XTT
- 2,3-bis(2-methoxy-4-nitro-5-sulfophenyl)-2H-tetrazolium-5-carboxanilide
- OCR
- oxygen consumption rates
- CM-H2DCF-DA
- 5,6-chloromethyl-2′,7′-dichlorodihydrofluorescein diacetate
- DPI
- diphenyleneiodium chloride
- ER
- endoplasmic reticulum
- gDNA
- genomic DNA
- FCCP
- carbonyl cyanide p-trifluoromethoxyphenylhydrazone
- ANOVA
- analysis of variance
- HIF
- hypoxia-inducible transcription factor
- V
- vector
- L
- full-length
- S
- TRPM2-S
- ENO2
- enolase 2.
References
- 1. Duncan L. M., Deeds J., Hunter J., Shao J., Holmgren L. M., Woolf E. A., Tepper R. I., and Shyjan A. W. (1998) Down-regulation of the novel gene melastatin correlates with potential for melanoma metastasis. Cancer Res. 58, 1515–1520 [PubMed] [Google Scholar]
- 2. Prawitt D., Enklaar T., Klemm G., Gärtner B., Spangenberg C., Winterpacht A., Higgins M., Pelletier J., and Zabel B. (2000) Identification and characterization of MTR1, a novel gene with homology to melastatin (MLSN1) and the trp gene family located in the BWS-WT2 critical region on chromosome 11p15.5 and showing allele-specific expression. Hum. Mol. Genet. 9, 203–216 [DOI] [PubMed] [Google Scholar]
- 3. Aarts M., Iihara K., Wei W. L., Xiong Z. G., Arundine M., Cerwinski W., MacDonald J. F., and Tymianski M. (2003) A key role for TRPM7 channels in anoxic neuronal death. Cell 115, 863–877 [DOI] [PubMed] [Google Scholar]
- 4. Tsavaler L., Shapero M. H., Morkowski S., and Laus R. (2001) Trp-p8, a novel prostate-specific gene, is up-regulated in prostate cancer and other malignancies and shares high homology with transient receptor potential calcium channel proteins. Cancer Res. 61, 3760–3769 [PubMed] [Google Scholar]
- 5. Ramsey I. S., Delling M., and Clapham D. E. (2006) An introduction to TRP channels. Annu. Rev. Physiol. 68, 619–647 [DOI] [PubMed] [Google Scholar]
- 6. Nagamine K., Kudoh J., Minoshima S., Kawasaki K., Asakawa S., Ito F., and Shimizu N. (1998) Molecular cloning of a novel putative Ca2+ channel protein (TRPC7) highly expressed in brain. Genomics 54, 124–131 [DOI] [PubMed] [Google Scholar]
- 7. Miller B. A., and Zhang W. (2011) TRP channels as mediators of oxidative stress. Adv. Exp. Med. Biol. 704, 531–544 [DOI] [PubMed] [Google Scholar]
- 8. Hecquet C. M., Ahmmed G. U., Vogel S. M., and Malik A. B. (2008) Role of TRPM2 channel in mediating H2O2-induced Ca2+ entry and endothelial hyperpermeability. Circ. Res. 102, 347–355 [DOI] [PubMed] [Google Scholar]
- 9. Faouzi M., and Penner R. (2014) TRPM2. Handb. Exp. Pharmacol. 222, 403–426 [DOI] [PubMed] [Google Scholar]
- 10. Hara Y., Wakamori M., Ishii M., Maeno E., Nishida M., Yoshida T., Yamada H., Shimizu S., Mori E., Kudoh J., Shimizu N., Kurose H., Okada Y., Imoto K., and Mori Y. (2002) LTRPC2 Ca2+-permeable channel activated by changes in redox status confers susceptibility to cell death. Mol. Cell 9, 163–173 [DOI] [PubMed] [Google Scholar]
- 11. Fonfria E., Marshall I. C., Boyfield I., Skaper S. D., Hughes J. P., Owen D. E., Zhang W., Miller B. A., Benham C. D., and McNulty S. (2005) Amyloid β-peptide(1–42) and hydrogen peroxide-induced toxicity are mediated by TRPM2 in rat primary striatal cultures. J. Neurochem. 95, 715–723 [DOI] [PubMed] [Google Scholar]
- 12. Wehage E., Eisfeld J., Heiner I., Jüngling E., Zitt C., and Lückhoff A. (2002) Activation of the cation channel long transient receptor potential channel 2 (LTRPC2) by hydrogen peroxide. A splice variant reveals a mode of activation independent of ADP-ribose. J. Biol. Chem. 277, 23150–23156 [DOI] [PubMed] [Google Scholar]
- 13. Gasser A., Glassmeier G., Fliegert R., Langhorst M. F., Meinke S., Hein D., Krüger S., Weber K., Heiner I., Oppenheimer N., Schwarz J. R., and Guse A. H. (2006) Activation of T cell calcium influx by the second messenger ADP-ribose. J. Biol. Chem. 281, 2489–2496 [DOI] [PubMed] [Google Scholar]
- 14. Kolisek M., Beck A., Fleig A., and Penner R. (2005) Cyclic ADP-ribose and hydrogen peroxide synergize with ADP-ribose in the activation of TRPM2 channels. Mol. Cell 18, 61–69 [DOI] [PubMed] [Google Scholar]
- 15. Perraud A. L., Takanishi C. L., Shen B., Kang S., Smith M. K., Schmitz C., Knowles H. M., Ferraris D., Li W., Zhang J., Stoddard B. L., and Scharenberg A. M. (2005) Accumulation of free ADP-ribose from mitochondria mediates oxidative stress-induced gating of TRPM2 cation channels. J. Biol. Chem. 280, 6138–6148 [DOI] [PubMed] [Google Scholar]
- 16. Tóth B., and Csanády L. (2010) Identification of direct and indirect effectors of the transient receptor potential melastatin 2 (TRPM2) cation channel. J. Biol. Chem. 285, 30091–30102 [DOI] [PMC free article] [PubMed] [Google Scholar]
- 17. Fonfria E., Marshall I. C., Benham C. D., Boyfield I., Brown J. D., Hill K., Hughes J. P., Skaper S. D., and McNulty S. (2004) TRPM2 channel opening in response to oxidative stress is dependent on activation of poly(ADP-ribose) polymerase. Br. J. Pharmacol. 143, 186–192 [DOI] [PMC free article] [PubMed] [Google Scholar]
- 18. Buelow B., Song Y., and Scharenberg A. M. (2008) The Poly(ADP-ribose) polymerase PARP-1 is required for oxidative stress-induced TRPM2 activation in lymphocytes. J. Biol. Chem. 283, 24571–24583 [DOI] [PMC free article] [PubMed] [Google Scholar]
- 19. Tóth B., Iordanov I., and Csanády L. (2015) Ruling out pyridine dinucleotides as true TRPM2 channel activators reveals novel direct agonist ADP-ribose-2′-phosphate. J. Gen. Physiol. 145, 419–430 [DOI] [PMC free article] [PubMed] [Google Scholar]
- 20. McHugh D., Flemming R., Xu S. Z., Perraud A. L., and Beech D. J. (2003) Critical intracellular Ca2+ dependence of transient receptor potential melastatin 2 (TRPM2) cation channel activation. J. Biol. Chem. 278, 11002–11006 [DOI] [PubMed] [Google Scholar]
- 21. Du J., Xie J., and Yue L. (2009) Intracellular calcium activates TRPM2 and its alternative spliced isoforms. Proc. Natl. Acad. Sci. U.S.A. 106, 7239–7244 [DOI] [PMC free article] [PubMed] [Google Scholar]
- 22. Tong Q., Zhang W., Conrad K., Mostoller K., Cheung J. Y., Peterson B. Z., and Miller B. A. (2006) Regulation of the transient receptor potential channel TRPM2 by the Ca2+ sensor calmodulin. J. Biol. Chem. 281, 9076–9085 [DOI] [PubMed] [Google Scholar]
- 23. Du J., Xie J., and Yue L. (2009) Modulation of TRPM2 by acidic pH and the underlying mechanisms for pH sensitivity. J. Gen. Physiol. 134, 471–488 [DOI] [PMC free article] [PubMed] [Google Scholar]
- 24. Starkus J. G., Fleig A., and Penner R. (2010) The calcium-permeable non-selective cation channel TRPM2 is modulated by cellular acidification. J. Physiol. 588, 1227–1240 [DOI] [PMC free article] [PubMed] [Google Scholar]
- 25. Csanády L. (2010) Permeating proton found guilty in compromising TRPM2 channel activity. J. Physiol. 588, 1661–1662 [DOI] [PMC free article] [PubMed] [Google Scholar]
- 26. Zhang W., Chu X., Tong Q., Cheung J. Y., Conrad K., Masker K., and Miller B. A. (2003) A novel TRPM2 isoform inhibits calcium influx and susceptibility to cell death. J. Biol. Chem. 278, 16222–16229 [DOI] [PubMed] [Google Scholar]
- 27. Goel M., Sinkins W. G., and Schilling W. P. (2002) Selective association of TRPC channel subunits in rat brain synaptosomes. J. Biol. Chem. 277, 48303–48310 [DOI] [PubMed] [Google Scholar]
- 28. Hofmann T., Schaefer M., Schultz G., and Gudermann T. (2002) Subunit composition of mammalian transient receptor potential channels in living cells. Proc. Natl. Acad. Sci. U.S.A. 99, 7461–7466 [DOI] [PMC free article] [PubMed] [Google Scholar]
- 29. Li M., Jiang J., and Yue L. (2006) Functional characterization of homo- and heteromeric channel kinases TRPM6 and TRPM7. J. Gen. Physiol. 127, 525–537 [DOI] [PMC free article] [PubMed] [Google Scholar]
- 30. Schumacker P. T. (2006) Reactive oxygen species in cancer cells: live by the sword, die by the sword. Cancer Cell 10, 175–176 [DOI] [PubMed] [Google Scholar]
- 31. Trachootham D., Alexandre J., and Huang P. (2009) Targeting cancer cells by ROS-mediated mechanisms: a radical therapeutic approach? Nat. Rev. Drug Discov. 8, 579–591 [DOI] [PubMed] [Google Scholar]
- 32. Sano Y., Inamura K., Miyake A., Mochizuki S., Yokoi H., Matsushime H., and Furuichi K. (2001) Immunocyte Ca2+ influx system mediated by LTRPC2. Science 293, 1327–1330 [DOI] [PubMed] [Google Scholar]
- 33. Knowles H., Heizer J. W., Li Y., Chapman K., Ogden C. A., Andreasen K., Shapland E., Kucera G., Mogan J., Humann J., Lenz L. L., Morrison A. D., and Perraud A. L. (2011) Transient receptor potential melastatin 2 (TRPM2) ion channel is required for innate immunity against Listeria monocytogenes. Proc. Natl. Acad. Sci. U.S.A. 108, 11578–11583 [DOI] [PMC free article] [PubMed] [Google Scholar]
- 34. Bai J. Z., and Lipski J. (2010) Differential expression of TRPM2 and TRPV4 channels and their potential role in oxidative stress-induced cell death in organotypic hippocampal culture. Neurotoxicology 31, 204–214 [DOI] [PubMed] [Google Scholar]
- 35. Di A., Gao X. P., Qian F., Kawamura T., Han J., Hecquet C., Ye R. D., Vogel S. M., and Malik A. B. (2012) The redox-sensitive cation channel TRPM2 modulates phagocyte ROS production and inflammation. Nat. Immunol. 13, 29–34 [DOI] [PMC free article] [PubMed] [Google Scholar]
- 36. Miller B. A., Wang J., Hirschler-Laszkiewicz I., Gao E., Song J., Zhang X. Q., Koch W. J., Madesh M., Mallilankaraman K., Gu T., Chen S. J., Keefer K., Conrad K., Feldman A. M., and Cheung J. Y. (2013) The second member of transient receptor potential-melastatin channel family protects hearts from ischemia-reperfusion injury. Am. J. Physiol. Heart Circ. Physiol. 304, H1010–1022 [DOI] [PMC free article] [PubMed] [Google Scholar]
- 37. Miller B. A., Hoffman N. E., Merali S., Zhang X. Q., Wang J., Rajan S., Shanmughapriya S., Gao E., Barrero C. A., Mallilankaraman K., Song J., Gu T., Hirschler-Laszkiewicz I., Koch W. J., Feldman A. M., Madesh M., and Cheung J. Y. (2014) TRPM2 channels protect against cardiac ischemia-reperfusion injury: role of mitochondria. J. Biol. Chem. 289, 7615–7629 [DOI] [PMC free article] [PubMed] [Google Scholar]
- 38. Hoffman N. E., Miller B. A., Wang J., Elrod J. W., Rajan S., Gao E., Song J., Zhang X. Q., Hirschler-Laszkiewicz I., Shanmughapriya S., Koch W. J., Feldman A. M., Madesh M., and Cheung J. Y. (2015) Ca2+ entry via Trpm2 is essential for cardiac myocyte bioenergetics maintenance. Am. J. Physiol. Heart Circ. Physiol. 308, H637–650 [DOI] [PMC free article] [PubMed] [Google Scholar]
- 39. Orfanelli U., Wenke A. K., Doglioni C., Russo V., Bosserhoff A. K., and Lavorgna G. (2008) Identification of novel sense and antisense transcription at the TRPM2 locus in cancer. Cell Res. 18, 1128–1140 [DOI] [PubMed] [Google Scholar]
- 40. Chen S. J., Zhang W., Tong Q., Conrad K., Hirschler-Laszkiewicz I., Bayerl M., Kim J. K., Cheung J. Y., and Miller B. A. (2013) Role of TRPM2 in cell proliferation and susceptibility to oxidative stress. Am. J. Physiol. Cell Physiol. 304, C548–560 [DOI] [PMC free article] [PubMed] [Google Scholar]
- 41. Chen S. J., Hoffman N. E., Shanmughapriya S., Bao L., Keefer K., Conrad K., Merali S., Takahashi Y., Abraham T., Hirschler-Laszkiewicz I., Wang J., Zhang X. Q., Song J., Barrero C., Shi Y., et al. (2014) A splice variant of the human ion channel TRPM2 modulates neuroblastoma tumor growth through hypoxia-inducible factor (HIF)-1/2α. J. Biol. Chem. 289, 36284–36302 [DOI] [PMC free article] [PubMed] [Google Scholar]
- 42. Park Y. R., Chun J. N., So I., Kim H. J., Baek S., Jeon J. H., and Shin S. Y. (2016) Data-driven analysis of TRP channels in cancer: linking variation in gene expression to clinical significance. Cancer Genomics Proteomics 13, 83–90 [PubMed] [Google Scholar]
- 43. Perraud A. L., Fleig A., Dunn C. A., Bagley L. A., Launay P., Schmitz C., Stokes A. J., Zhu Q., Bessman M. J., Penner R., Kinet J. P., and Scharenberg A. M. (2001) ADP-ribose gating of the calcium-permeable LTRPC2 channel revealed by Nudix motif homology. Nature 411, 595–599 [DOI] [PubMed] [Google Scholar]
- 44. Hermosura M. C., Cui A. M., Go R. C., Davenport B., Shetler C. M., Heizer J. W., Schmitz C., Mocz G., Garruto R. M., and Perraud A. L. (2008) Altered functional properties of a TRPM2 variant in Guamanian ALS and PD. Proc. Natl. Acad. Sci. U.S.A. 105, 18029–18034 [DOI] [PMC free article] [PubMed] [Google Scholar]
- 45. Xia R., Mei Z. Z., Mao H. J., Yang W., Dong L., Bradley H., Beech D. J., and Jiang L. H. (2008) Identification of pore residues engaged in determining divalent cationic permeation in transient receptor potential melastatin subtype channel 2. J. Biol. Chem. 283, 27426–27432 [DOI] [PMC free article] [PubMed] [Google Scholar]
- 46. Holmquist-Mengelbier L., Fredlund E., Löfstedt T., Noguera R., Navarro S., Nilsson H., Pietras A., Vallon-Christersson J., Borg A., Gradin K., Poellinger L., and Påhlman S. (2006) Recruitment of HIF-1α and HIF-2α to common target genes is differentially regulated in neuroblastoma: HIF-2α promotes an aggressive phenotype. Cancer Cell 10, 413–423 [DOI] [PubMed] [Google Scholar]
- 47. Noguera R., Fredlund E., Piqueras M., Pietras A., Beckman S., Navarro S., and Påhlman S. (2009) HIF-1α and HIF-2α are differentially regulated in vivo in neuroblastoma: high HIF-1α correlates negatively to advanced clinical stage and tumor vascularization. Clin. Cancer Res. 15, 7130–7136 [DOI] [PubMed] [Google Scholar]
- 48. Kops G. J., Dansen T. B., Polderman P. E., Saarloos I., Wirtz K. W., Coffer P. J., Huang T. T., Bos J. L., Medema R. H., and Burgering B. M. (2002) Forkhead transcription factor FOXO3a protects quiescent cells from oxidative stress. Nature 419, 316–321 [DOI] [PubMed] [Google Scholar]
- 49. Li M., Chiu J. F., Mossman B. T., and Fukagawa N. K. (2006) Down-regulation of manganese-superoxide dismutase through phosphorylation of FOXO3a by Akt in explanted vascular smooth muscle cells from old rats. J. Biol. Chem. 281, 40429–40439 [DOI] [PubMed] [Google Scholar]
- 50. Tello D., Balsa E., Acosta-Iborra B., Fuertes-Yebra E., Elorza A., Ordóñez Á., Corral-Escariz M., Soro I., López-Bernardo E., Perales-Clemente E., Martínez-Ruiz A., Enríquez J. A., Aragonés J., Cadenas S., and Landázuri M. O. (2011) Induction of the mitochondrial NDUFA4L2 protein by HIF-1α decreases oxygen consumption by inhibiting complex I activity. Cell Metab. 14, 768–779 [DOI] [PubMed] [Google Scholar]
- 51. Zhang H., Bosch-Marce M., Shimoda L. A., Tan Y. S., Baek J. H., Wesley J. B., Gonzalez F. J., and Semenza G. L. (2008) Mitochondrial autophagy is an HIF-1-dependent adaptive metabolic response to hypoxia. J. Biol. Chem. 283, 10892–10903 [DOI] [PMC free article] [PubMed] [Google Scholar] [Retracted]
- 52. Bellot G., Garcia-Medina R., Gounon P., Chiche J., Roux D., Pouysségur J., and Mazure N. M. (2009) Hypoxia-induced autophagy is mediated through hypoxia-inducible factor induction of BNIP3 and BNIP3L via their BH3 domains. Mol. Cell. Biol. 29, 2570–2581 [DOI] [PMC free article] [PubMed] [Google Scholar]
- 53. Gustafsson A. B. (2011) Bnip3 as a dual regulator of mitochondrial turnover and cell death in the myocardium. Pediatr. Cardiol. 32, 267–274 [DOI] [PMC free article] [PubMed] [Google Scholar]
- 54. Semenza G. L. (2009) Regulation of cancer cell metabolism by hypoxia-inducible factor 1. Semin. Cancer Biol. 19, 12–16 [DOI] [PubMed] [Google Scholar]
- 55. Fukuda R., Zhang H., Kim J. W., Shimoda L., Dang C. V., and Semenza G. L. (2007) HIF-1 regulates cytochrome oxidase subunits to optimize efficiency of respiration in hypoxic cells. Cell 129, 111–122 [DOI] [PubMed] [Google Scholar]
- 56. Park J. H., Vithayathil S., Kumar S., Sung P. L., Dobrolecki L. E., Putluri V., Bhat V. B., Bhowmik S. K., Gupta V., Arora K., Wu D., Tsouko E., Zhang Y., Maity S., Donti T. R., et al. (2016) Fatty acid oxidation-driven Src links mitochondrial energy reprogramming and oncogenic properties in triple-negative breast cancer. Cell Rep. 14, 2154–2165 [DOI] [PMC free article] [PubMed] [Google Scholar]
- 57. Maynard M. A., and Ohh M. (2007) The role of hypoxia-inducible factors in cancer. Cell Mol. Life Sci. 64, 2170–2180 [DOI] [PMC free article] [PubMed] [Google Scholar]
- 58. Mohlin S., Hamidian A., and Påhlman S. (2013) HIF2A and IGF2 expression correlates in human neuroblastoma cells and normal immature sympathetic neuroblasts. Neoplasia 15, 328–334 [DOI] [PMC free article] [PubMed] [Google Scholar]
- 59. Klumpp D., Misovic M., Szteyn K., Shumilina E., Rudner J., and Huber S. M. (2016) Targeting TRPM2 channels impairs radiation-induced cell cycle arrest and fosters cell death of T cell leukemia cells in a Bcl-2-dependent manner. Oxid. Med. Cell. Longev. 2016, 8026702. [DOI] [PMC free article] [PubMed] [Google Scholar]
- 60. Liu Y. V., Hubbi M. E., Pan F., McDonald K. R., Mansharamani M., Cole R. N., Liu J. O., and Semenza G. L. (2007) Calcineurin promotes hypoxia-inducible factor 1α expression by dephosphorylating RACK1 and blocking RACK1 dimerization. J. Biol. Chem. 282, 37064–37073 [DOI] [PMC free article] [PubMed] [Google Scholar]
- 61. Liu Q., Möller U., Flügel D., and Kietzmann T. (2004) Induction of plasminogen activator inhibitor I gene expression by intracellular calcium via hypoxia-inducible factor-1. Blood 104, 3993–4001 [DOI] [PubMed] [Google Scholar]
- 62. Hui A. S., Bauer A. L., Striet J. B., Schnell P. O., and Czyzyk-Krzeska M. F. (2006) Calcium signaling stimulates translation of HIF-α during hypoxia. FASEB J. 20, 466–475 [DOI] [PubMed] [Google Scholar]
- 63. Yuan G., Nanduri J., Bhasker C. R., Semenza G. L., and Prabhakar N. R. (2005) Ca2+/calmodulin kinase-dependent activation of hypoxia inducible factor 1 transcriptional activity in cells subjected to intermittent hypoxia. J. Biol. Chem. 280, 4321–4328 [DOI] [PubMed] [Google Scholar]
- 64. Fredlund E., Ovenberger M., Borg K., and Påhlman S. (2008) Transcriptional adaptation of neuroblastoma cells to hypoxia. Biochem. Biophys. Res. Commun. 366, 1054–1060 [DOI] [PubMed] [Google Scholar]
- 65. Wallace D. C. (2012) Mitochondria and cancer. Nat. Rev. Cancer 12, 685–698 [DOI] [PMC free article] [PubMed] [Google Scholar]
- 66. Cárdenas C., Miller R. A., Smith I., Bui T., Molgó J., Müller M., Vais H., Cheung K. H., Yang J., Parker I., Thompson C. B., Birnbaum M. J., Hallows K. R., and Foskett J. K. (2010) Essential regulation of cell bioenergetics by constitutive InsP3 receptor Ca2+ transfer to mitochondria. Cell 142, 270–283 [DOI] [PMC free article] [PubMed] [Google Scholar]
- 67. Rizzuto R., De Stefani D., Raffaello A., and Mammucari C. (2012) Mitochondria as sensors and regulators of calcium signalling. Nat. Rev. Mol. Cell Biol. 13, 566–578 [DOI] [PubMed] [Google Scholar]
- 68. Kornmann B. (2013) The molecular hug between the ER and the mitochondria. Curr. Opin. Cell Biol. 25, 443–448 [DOI] [PubMed] [Google Scholar]
- 69. Lackner L. L., Ping H., Graef M., Murley A., and Nunnari J. (2013) Endoplasmic reticulum-associated mitochondria-cortex tether functions in the distribution and inheritance of mitochondria. Proc. Natl. Acad. Sci. U.S.A. 110, E458–467 [DOI] [PMC free article] [PubMed] [Google Scholar]
- 70. O-Uchi J., Jhun B. S., Xu S., Hurst S., Raffaello A., Liu X., Yi B., Zhang H., Gross P., Mishra J., Ainbinder A., Kettlewell S., Smith G. L., Dirksen R. T., Wang W., Rizzuto R., and Sheu S. S. (2014) Adrenergic signaling regulates mitochondrial Ca2+ uptake through Pyk2-dependent tyrosine phosphorylation of the mitochondrial Ca2+ uniporter. Antioxid. Redox Signal. 21, 863–879 [DOI] [PMC free article] [PubMed] [Google Scholar]
- 71. Cairns R. A., Harris I. S., and Mak T. W. (2011) Regulation of cancer cell metabolism. Nat. Rev. Cancer 11, 85–95 [DOI] [PubMed] [Google Scholar]
- 72. Trachootham D., Zhou Y., Zhang H., Demizu Y., Chen Z., Pelicano H., Chiao P. J., Achanta G., Arlinghaus R. B., Liu J., and Huang P. (2006) Selective killing of oncogenically transformed cells through a ROS-mediated mechanism by β-phenylethyl isothiocyanate. Cancer Cell 10, 241–252 [DOI] [PubMed] [Google Scholar]
- 73. Nogueira V., Park Y., Chen C. C., Xu P. Z., Chen M. L., Tonic I., Unterman T., and Hay N. (2008) Akt determines replicative senescence and oxidative or oncogenic premature senescence and sensitizes cells to oxidative apoptosis. Cancer Cell 14, 458–470 [DOI] [PMC free article] [PubMed] [Google Scholar]
- 74. Sayin V. I., Ibrahim M. X., Larsson E., Nilsson J. A., Lindahl P., and Bergo M. O. (2014) Antioxidants accelerate lung cancer progression in mice. Sci. Transl. Med. 6, 221ra215. [DOI] [PubMed] [Google Scholar]
- 75. Le Gal K., Ibrahim M. X., Wiel C., Sayin V. I., Akula M. K., Karlsson C., Dalin M. G., Akyurek L. M., Lindahl P., Nilsson J., and Bergo M. O. (2015) Antioxidants can increase melanoma metastasis in mice. Sci. Transl. Med. 7, 308re308. [DOI] [PubMed] [Google Scholar]
- 76. Piskounova E., Agathocleous M., Murphy M. M., Hu Z., Huddlestun S. E., Zhao Z., Leitch A. M., Johnson T. M., DeBerardinis R. J., and Morrison S. J. (2015) Oxidative stress inhibits distant metastasis by human melanoma cells. Nature 527, 186–191 [DOI] [PMC free article] [PubMed] [Google Scholar]
- 77. Connor K. M., Hempel N., Nelson K. K., Dabiri G., Gamarra A., Belarmino J., Van De Water L., Mian B. M., and Melendez J. A. (2007) Manganese superoxide dismutase enhances the invasive and migratory activity of tumor cells. Cancer Res. 67, 10260–10267 [DOI] [PubMed] [Google Scholar]
- 78. Raj L., Ide T., Gurkar A. U., Foley M., Schenone M., Li X., Tolliday N. J., Golub T. R., Carr S. A., Shamji A. F., Stern A. M., Mandinova A., Schreiber S. L., and Lee S. W. (2011) Selective killing of cancer cells by a small molecule targeting the stress response to ROS. Nature 475, 231–234 [DOI] [PMC free article] [PubMed] [Google Scholar] [Retracted]
- 79. Shaw A. T., Winslow M. M., Magendantz M., Ouyang C., Dowdle J., Subramanian A., Lewis T. A., Maglathin R. L., Tolliday N., and Jacks T. (2011) Selective killing of K-ras mutant cancer cells by small molecule inducers of oxidative stress. Proc. Natl. Acad. Sci. U.S.A. 108, 8773–8778 [DOI] [PMC free article] [PubMed] [Google Scholar]
- 80. Glasauer A., Sena L. A., Diebold L. P., Mazar A. P., and Chandel N. S. (2014) Targeting SOD1 reduces experimental non-small-cell lung cancer. J. Clin. Investig. 124, 117–128 [DOI] [PMC free article] [PubMed] [Google Scholar]
- 81. Schieber M., and Chandel N. S. (2014) ROS function in redox signaling and oxidative stress. Curr. Biol. 24, R453–462 [DOI] [PMC free article] [PubMed] [Google Scholar]
- 82. Ronni T., Payne K. J., Ho S., Bradley M. N., Dorsam G., and Dovat S. (2007) Human Ikaros function in activated T cells is regulated by coordinated expression of its largest isoforms. J. Biol. Chem. 282, 2538–2547 [DOI] [PubMed] [Google Scholar]
- 83. Wang J., Gao E., Rabinowitz J., Song J., Zhang X. Q., Koch W. J., Tucker A. L., Chan T. O., Feldman A. M., and Cheung J. Y. (2011) Regulation of in vivo cardiac contractility by phospholemman: role of Na+/Ca2+ exchange. Am. J. Physiol. Heart Circ. Physiol. 300, H859–868 [DOI] [PMC free article] [PubMed] [Google Scholar]
- 84. Roehm N. W., Rodgers G. H., Hatfield S. M., and Glasebrook A. L. (1991) An improved colorimetric assay for cell proliferation and viability utilizing the tetrazolium salt XTT. J. Immunol. Methods 142, 257–265 [DOI] [PubMed] [Google Scholar]