

Abstract
NADH-ubiquinone oxidoreductase (complex I) is the largest (∼1 MDa) and the least characterized complex of the mitochondrial electron transport chain. Because of the ease of sample availability, previous work has focused almost exclusively on bovine complex I. However, only medium resolution structural analyses of this complex have been reported. Working with other mammalian complex I homologues is a potential approach for overcoming these limitations. Due to the inherent difficulty of expressing large membrane protein complexes, screening of complex I homologues is limited to large mammals reared for human consumption. The high sequence identity among these available sources may preclude the benefits of screening. Here, we report the characterization of complex I purified from Ovis aries (ovine) heart mitochondria. All 44 unique subunits of the intact complex were identified by mass spectrometry. We identified differences in the subunit composition of subcomplexes of ovine complex I as compared with bovine, suggesting differential stability of inter-subunit interactions within the complex. Furthermore, the 42-kDa subunit, which is easily lost from the bovine enzyme, remains tightly bound to ovine complex I. Additionally, we developed a novel purification protocol for highly active and stable mitochondrial complex I using the branched-chain detergent lauryl maltose neopentyl glycol. Our data demonstrate that, although closely related, significant differences exist between the biochemical properties of complex I prepared from ovine and bovine mitochondria and that ovine complex I represents a suitable alternative target for further structural studies.
Keywords: complex I, electron transfer, membrane protein, mitochondrial respiratory chain complex, proton pump, respiratory chain
Introduction
Many products from the catabolic processing of monosaccharides, fatty acids, nucleotides, and amino acids are transported into the mitochondria, where their redox energy is harvested to synthesize ATP. The main process by which ATP is produced involves the five large membrane protein complexes of the oxidative phosphorylation electron transport chain (OXPHOS-ETC)4 in the inner mitochondrial membrane (IMM) (1). NADH-ubiquinone oxidoreductase (complex I) is the first and largest of the OXPHOS-ETC complexes and couples the reduction of ubiquinone by NADH to the pumping of 4 H+ across the IMM (2–5). Together with the other proton-pumping OXPHOS-ETC complexes, ubiquinol-cytochrome c oxidoreductase (complex III or the bc1 complex) and cytochrome c oxidase (complex IV), complex I is responsible for building up a large proton electrochemical gradient that is then harvested by ATP synthase (complex V) for ATP production (1). Succinate-coenzyme Q reductase (complex II) is also a transmembrane protein complex and forms an integral part of the tricarboxylic acid cycle, but it only contributes to the membrane potential indirectly through reduction of the Q-pool (1).
Although progress has been made in our understanding of the mechanism of the OXPHOS-ETC complexes, including high resolution structures of mammalian mitochondrial complexes II, III, and IV (6–9), until recently only medium resolution structures were available for intact complexes I and V (10–14). Additional structures of homologues of complexes I and V have provided further insight (2, 15, 16). However, because of its large ∼1-MDa size, its 45 total subunits (44 unique subunits with SDAP present in two copies (11)) as well as the separation of its redox cofactors and proton pumps in large hydrophilic and hydrophobic arms, complex I remains the least well mechanistically and structurally characterized of the OXPHOS-ETC complexes.
Currently, the best structural data on complex I is from bacterial homologues, which are smaller but are homologous to the “core” of the mammalian mitochondrial enzyme (2). Structures of subcomplexes of complex I from Thermus thermophilus and Escherichia coli, as well as the recent 3.3 Å structure of the intact T. thermophilus enzyme, revealed the details of the “L-shaped” structure of complex I (17–21). All complex I co-factors, including flavin mononucleotide (FMN) and the seven conserved iron-sulfur (Fe-S) clusters (N1a, N3, N1b, N4, N5, N6a, N6b, and N2), are found in the hydrophilic “matrix” arm, whereas the proton translocation pathways are all located in the hydrophobic “membrane” arm (17, 18, 20). A long Q-binding tunnel extends from the membrane into the peripheral arm near the terminal Fe-S cluster N2 (21). The Q-binding site is coupled to the most distal proton-pumping subunit by an axis of hydrophilic residues in the middle of the membrane (2, 21). The proton-pumping domains are further connected by structural elements including an ∼100-Å-long lateral helix that spans two-thirds of the membrane arm (20). Although these structures of bacterial complex I have increased our understanding and remain the best picture of the functionally important core subunits, the mechanism of how Q reduction is coupled to proton translocation remains unknown. Additionally, the bacterial homologues do not provide any information about the position and role of the 30 mammalian mitochondrial supernumerary subunits (3, 4).
In the case of mitochondrial complex I, the highest resolution electron density map (∼3.8 Å) is available for the single-celled eukaryote Yarrowia lipolytica homologue (22). Although this complex contains 27–28 supernumerary subunits, only 23 of them have mammalian homologues, and none have been assigned in the structure besides NUEM (39-kDa subunit homologue) (22, 23). For mammalian mitochondrial complex I, two medium resolution structures have been reported for the bovine enzyme as follows: one single particle cryo-EM structure of the intact enzyme at 5 Å resolution, and one x-ray crystallographic structure of a portion of the membrane arm at 6.0 Å (11, 24). By comparing these two structures, preliminary assignments of the supernumerary subunits have been proposed; however, due to the limited resolution of the maps, only partial polyalanine models have been built (11, 24). Very recently, a 4.2 Å resolution cryo-EM structure of the bovine enzyme has been published (14), with all subunits assigned but still largely incomplete models for supernumerary subunits (only 27% of residues at atomic level). We reported a 3.9 Å structure of mitochondrial complex I using the novel purification protocols described in detail here (25). At this resolution and in conjunction with experimental cross-linking data, definitive assignments for all supernumerary subunits were made, and nearly fully atomic models for all subunits were built (25).
This recent structure resulted from adopting a common approach to membrane-protein structure determination: screening homologues of a target protein to find the most stable and homogeneous sample for crystallization or cryo-EM grid preparation (26, 27). However, because of the inherent difficulty in the exogenous overexpression of large protein complexes with many cofactors, sources of mammalian complex I that are sufficient for structural studies are limited to readily available natural tissues. The most abundant sources are the hearts of large mammals reared as livestock for human consumption, namely Bos taurus (bovine), Ovis aries (ovine), and Sus scrofa (porcine). It is also possible to biochemically characterize human complex I isolated from cell culture lines; however, the large amounts of protein needed for structural studies make the economic cost of this approach prohibitive. Of these four options, bovine complex I remains the most studied, but it has yet to produce samples capable of yielding high resolution structural data.
Here, we report the biochemical purification and functional characterization of ovine complex I. We found that although both bovine and ovine complex I share high sequence identity, they nonetheless show differences in their activity and stability during purification in the commonly used detergent dodecyl maltoside (DDM). We show that all 44 unique subunits are present in the purified sample and characterize the subunit makeup of subcomplexes produced after treatment of the purified protein with lauryldimethylamine-N-oxide (LDAO). Differences seen in the subunit makeup of the ovine complex I subcomplexes, when compared with bovine complex I subcomplexes, suggest differences in the stabilities of interactions between supernumerary subunits. Next, by screening ovine complex I activity in 16 different detergents, across five classes, we identify the maltose neo-pentylglycol detergents as potential complex I activators in solution. Consequently, we develop a novel purification protocol using LMNG that results in a highly pure, active, and stable complex I. We conclude that despite high sequence similarity to the bovine complex, ovine complex I represents a promising additional target for structural characterization of mammalian mitochondrial complex I.
Results
Sequence Comparisons for Mitochondrial Complex I from Large Source Mammals
To determine the degree to which complex I differs between the possible source mammals, the protein sequences of all 44 unique complex I subunits were compared (Table 1). The recent low and medium resolution structures of mitochondrial complex I have demonstrated that these supernumerary subunits “coat” the core subunits of both the peripheral and membrane arms forming an “outer shell” of protein (11, 22). Because the surface properties of a protein dictate much of its biochemical behavior (including crystallizability), the sequence differences in the supernumerary subunits are of particular interest. Additionally, single amino acid variations at protein-protein interfaces in a large complex may result in significant changes in stability (28).
TABLE 1.
Sequence identity of mammalian complex I relative to human (left) and bovine (right)
| Subunits, “Human Nomenclature” | Bovine | Ovine | Porcine | Subunits, ”Common Bovine Nomenclature” | Ovine | Porcine |
|---|---|---|---|---|---|---|
| Core | ||||||
| NDUFV1 | 97.5 | 98.0 | 97.5 | 51 kDa | 99.5 | 98.7 |
| NDUFV2 | 98.6 | 98.2 | 97.2 | 24 kDa | 99.5 | 97.7 |
| NDUFS1 | 97.4 | 97.3 | 97.2 | 75 kDa | 99.3 | 96.7 |
| NDUFS2 | 95.4 | 95.6 | 95.8 | 49 kDa | 99.8 | 98.6 |
| NDUFS3 | 94.7 | 95.2 | 93.9 | 30 kDa | 97.4 | 95.2 |
| NDUFS7 | 92.7 | 92.7 | 92.2 | PSST | 100 | 96.1 |
| NDUFS8 | 96.0 | 96.0 | 96.0 | TYKY | 100a | 98.3 |
| Average nuclear | 96.0 | 96.1 | 95.7 | 99.4 | 97.3 | |
| ND1 | 78.0 | 78.0 | 77.0 | ND1 | 93.7 | 89.6 |
| ND2 | 63.1 | 63.1 | 62.0 | ND2 | 91.9 | 75.8 |
| ND3 | 73.9 | 73.0 | 71.3 | ND3 | 94.8 | 90.4 |
| ND4 | 74.1 | 75.2 | 73.2 | ND4 | 92.8 | 86.5 |
| ND4L | 73.5 | 76.5 | 76.5 | ND4L | 93.9 | 86.7 |
| ND5 | 69.5 | 69.6 | 69.5 | ND5 | 90.6 | 81.7 |
| ND6 | 62.3 | 61.1 | 57.7 | ND6 | 93.7 | 88.6 |
| Average mitochondria | 70.6 | 70.9 | 69.6 | 93.1 | 85.6 | |
| Supernumerary | ||||||
| NDUFS4 | 95.5 | 95.5 | 95.5 | 18 kDa | 98.5 | 95.5 |
| NDUFS5 | 74.3 | 70.5 | 79.0 | 15 kDa | 90.5 | 88.6 |
| NDUFS6 | 89.6 | 90.6a | 88.5 | 13 kDa | 97.9a | 93.8 |
| NDUFV3 | 86.7 | 88.0a | 29.3b | 10 kDa | 98.7a | 33.3b |
| NDUFA1 | 80.0 | 80.0 | 80.0 | MWFE | 95.7 | 81.4 |
| NDUFA2 | 93.9 | 93.9 | 94.9 | B8 | 100 | 94.9 |
| NDUFA3 | 83.1 | 83.1 | 78.3 | B9 | 98.8 | 85.5 |
| NDUFA5 | 87.0 | 87.0 | 87.8 | B13 | 98.3 | 94.8 |
| NDUFA6 | 90.6 | 90.6 | 89.0 | B14 | 98.4 | 92.9 |
| NDUFA7 | 88.4 | 87.5 | 90.2 | B14.5a | 96.4 | 92.0 |
| NDUFA8 | 87.7 | 87.1 | 90.6 | PGIV | 98.2 | 95.9 |
| NDUFA9 | 79.7 | 80.9 | 83.3 | 39 kDa | 96.2 | 87.8 |
| NDUFA10 | 80.6 | 79.7 | 79.7 | 42 kDa | 94.7 | 87.5 |
| NDUFA11 | 72.1 | 70.0 | 69.3 | B14.7 | 95.7 | 90.0 |
| NDUFA12 | 89.7 | 89.7 | 89.0 | B17.2 | 100 | 95.2 |
| NDUFA13 | 83.2 | 83.2 | 86.7 | B16.6 | 95.8 | 93.7 |
| NDUFAB1c | 97.7 | 97.7 | 96.6 | SDAPc | 100 | 98.9 |
| NDUFB1 | 82.5 | 77.2 | 82.5 | MNLL | 94.7 | 84.2 |
| NDUFB2 | 90.3 | 90.3 | 88.9 | AGGG | 100 | 95.8 |
| NDUFB3 | 82.5 | 83.5 | 84.5 | B12 | 99.0 | 95.9 |
| NDUFB4 | 73.4 | 75.0 | 78.1 | B15 | 93.8 | 87.5 |
| NDUFB5 | 85.3 | 85.5 | 100 | SGDH | 95.8 | 85.3 |
| NDUFB6 | 78.0 | 78.0 | 71.7 | B17 | 97.6 | 86.6 |
| NDUFB7 | 86.8 | 85.3 | 85.3 | B18 | 98.5 | 93.4 |
| NDUFB8 | 85.4 | 86.1 | 85.4 | ASHI | 98.7 | 93.0 |
| NDUFB9 | 91.0 | 89.3 | 91.1 | B22 | 96.6 | 93.3 |
| NDUFB10 | 78.5 | 78.0 | 77.4 | PDSW | 97.7 | 93.1 |
| NDUFB11 | 85.6 | 85.6 | 83.2 | ESSS | 98.4 | 90.4 |
| NDUFC1 | 81.6 | 79.6 | 83.7 | KFYI | 98.0 | 93.9 |
| NDUFC2 | 73.3 | 75.0 | 73.3 | B14.5b | 93.3 | 85.0 |
| Average | 84.5 | 83.9 | 83.1 | 97.2 | 89.5 | |
a The most reliable sequence was obtained from Ovis aries musimon subspecies genome.
b Porcine genomic sequence (NCB Gene ID, 100620809 (75)) shows an alternative predicted splice pattern compared with human, bovine, and ovine (NCB Gene IDs, 4731 (76),327717 (77) and 101105620) resulting in alternative C termini of the predicted protein and low sequence identity.
c Two copies of subunit NUDFAB1 (SDAP) are present in complex I giving a total of 45 subunits (11).
Sequence analysis reveals that the core subunits of each complex I are highly conserved with an average of ∼83% identity across all core subunits relative to human (Table 1). Ovine and porcine core subunits are on average 96.4 and 91.9% identical to the more studied bovine complex (Table 1). There exists a stark difference in the relative conservation of the mitochondrion- and nucleus-encoded core subunits (on average across species, ∼70% versus ∼96% identical relative to human, respectively), which likely results from the reduced conservation of hydrophobic residues exposed to the membrane and the higher mutation rate of the mitochondrial genome (Table 1) (29, 30). Because of this increased mutation rate, many isoforms of the O. aries mitochondrion-encoded subunits (usually differing by a single amino acid change) have been reported (31–36). Therefore, where possible, we used protein-identification mass spectrometry experiments (described below) to specifically identify the subunit isoforms present in our sample (see Table 2 for database accession codes for the O. aries sequences used in our analyses).
TABLE 2.
Mass spectrometry identification for subunits of ovine complex I
| Subunit |
Mature subunit sizea |
No. of unique peptide fragments | Percent coverage | Sequence database accession no. | ||
|---|---|---|---|---|---|---|
| Bovine name | Human name | No. of amino acids | Mass | |||
| kDa | % | |||||
| 51 kDa | NDUFV1 | 445 | 48.6 | 40 | 86.6 | Uniprot no. W5PUX0 (78) |
| 24 kDa | NDUFV2 | 217 | 23.8 | 24 | 94.5 | Uniprot no. W5NRY1 (78) |
| 75 kDa | NDUFS1 | 704 | 76.9 | 65 | 92.5 | Uniprot no. W5QB34 (78) |
| 49 kDa | NDUFS2 | 430 | 49.1 | 40 | 88.1 | Uniprot no. W5PJ73 (78) |
| 30 kDa | NDUFS3 | 228 | 26.4 | 27 | 94.7 | Uniprot no. W5PB27 (78) |
| PSST | NDUFS7 | 179 | 20.1 | 14 | 87.2 | Uniprot no. W5PPP6 (78) |
| TYKY | NDUFS8 | 176 | 20.2 | 18 | 93.8 | NCB accession no. XP_011972879.1b |
| ND1 | ND1 | 318 | 35.9 | 8 | 19.2 | Uniprot no. O78747 (78) |
| ND2 | ND2 | 347 | 39.1 | 9 | 38.3 | Uniprot no. O78748 (35) |
| ND3 | ND3 | 115 | 13.1 | 3 | 23.5 | Uniprot no. O78753 (35) |
| ND4 | ND4 | 459 | 52 | 11 | 30.5 | Uniprot no. O78755 (35) |
| ND4L | ND4L | 98 | 10.8 | Uniprot no. O78754c (35) | ||
| ND5 | ND5 | 606 | 68.4 | 22 | 45.0 | Uniprot no. O78756 (35) |
| ND6 | ND6 | 175 | 19.1 | 5 | 67.4 | Uniprot no. O78757 (35) |
| 18 kDa (AQDQ) | NDUFS4 | 133 | 15.3 | 13 | 85.7 | Uniprot no. W5PE07 (78) |
| 15 kDa (PFFD) | NDUFS5 | 105 | 12.4 | 9 | 67.0 | Uniprot no. W5QFF9 (78) |
| 13 kDa | NDUFS6 | 96 | 10.6 | 10 | 86.5 | NCB accession no. XP_011980592.1b |
| 10 kDa | NDUFV3 | 75 | 8.4 | 1 | 74.7 | NCB accession no. XP_011991231.1b |
| MWFE | NDUFA1 | 70 | 8.2 | 4 | 78.9 | NCB accession no. NP_001305903.1 |
| B8 | NDUFA2 | 98 | 10.9 | 13 | 76.5 | Uniprot no. W5QAH8 (78) |
| B9 | NDUFA3 | 83 | 9.2 | 5 | 80.7 | Uniprot no. W5NYM7 (78) |
| B13 | NDUFA5 | 115 | 13.1 | 12 | 88.7 | Uniprot no. W5PNX7 (78) |
| B14 | NDUFA6 | 127 | 14.9 | 12 | 69.3 | Uniprot no. W5QC06 (78) |
| B14.5a | NDUFA7 | 112 | 12.4 | 15 | 81.2 | NCB accession no. XP_004008614.1 |
| PGIV | NDUFA8 | 171 | 20 | 19 | 90.7 | Uniprot no. W5PYA5 (78) |
| 39 kDa | NDUFA9 | 344 | 39 | 30 | 68.9 | Uniprot no. W5PI58 (78) |
| 42 kDa | NDUFA10 | 320 | 36.8 | 33 | 82.3 | Uniprot no. W5QBF5 (78) |
| B14.7 | NDUFA11 | 140 | 14.6 | 6 | 72.9 | Uniprot no. W5PAR2 (78) |
| B17.2 | NDUFA12 | 145 | 17.1 | 19 | 92.4 | Uniprot no. B9VGZ9 (79) |
| B16.6 | NDUFA13 | 143 | 16.6 | 16 | 89.5 | NCB accession no. XP_004008450.1 |
| SDAP | NDUFAB1 | 88 | 10.1 | 7 | 60.2 | Uniprot no. W5NQT7 (78) |
| MNLL | NDUFB1 | 57 | 6.9 | 6 | 70.2 | NCB accession no. XP_004018002.1 |
| AGGG | NDUFB2 | 72 | 8.5 | 4 | 36.1 | Uniprot no. W5PVD7 (78) |
| B12 | NDUFB3 | 97 | 11 | 9 | 85.7 | Uniprot no. W5Q5T4 (78) |
| B15 | NDUFB4 | 128 | 15 | 13 | 78.9 | NCB accession no. XP_004003003.1 |
| SGDH | NDUFB5 | 143 | 16.7 | 14 | 62.4 | Uniprot no. W5QHN8 (78) |
| B17 | NDUFB6 | 127 | 15.4 | 13 | 68.0 | Uniprot no. W5PZE3 (78) |
| B18 | NDUFB7 | 136 | 16.3 | 14 | 81.6 | Uniprot no. W5P5V3 (78) |
| ASHI | NDUFB8 | 158 | 18.8 | 14 | 79.1 | Uniprot no. W5Q1B0 (78) |
| B22 | NDUFB9 | 178 | 21.6 | 17 | 69.1 | Uniprot no. W5PGA3 (78) |
| PDSW | NDUFB10 | 175 | 20.8 | 18 | 75.4 | NCB accession no. XP_011999786.1 |
| ESSS | NDUFB11 | 125 | 14.4 | 14 | 74.4 | Uniprot no. W5PWF1 (78) |
| KFYI | NDUFC1 | 49 | 5.8 | 5 | 87.8 | NCB accession no. XP_004017292.1 |
| B14.5b | NDUFC2 | 120 | 14.2 | 11 | 65.6 | NCB accession no. XP_004019479.1 |
a Sites of mitochondrial targeting sequence removal were determined experimentally by peptide identification and/or by sequence alignment with the bovine subunits.
b The most reliable/best matching sequence was from O. aries musimon subspecies.
The 30 nucleus-encoded supernumerary subunits have on average lower sequence conservation than the nucleus-encoded core subunits, ∼84% versus ∼95% identity across all species, respectively (Table 1). The nucleus-encoded core subunits compose the solvent-exposed matrix arm of the enzyme and include the distal N-module (the 24-, 51-, and 75-kDa core subunits) and the proximal Q-module (the 49- and 30-kDa, TYKY and PSST core subunits), relative to the membrane arm of the complex (15). Together, the N- and Q-modules contain all eight Fe-S clusters, the FMN co-factor as well as the NADH and Q biding sites (2). Although a few supernumerary subunits have been identified to play important roles in the assembly, stability, and activity of the complex, the roles of many of these subunits remain undefined (37). Overall, the bovine and ovine enzymes are 99.4, 97.2, and 93.1% identical in the nucleus-encoded core, supernumerary, and mitochondrion-encoded core subunits, respectively (Table 1). To fully understand the impact of the sequence differences between the subunits of these complexes we undertook the biochemical purification and characterization of ovine complex I.
Initial Purification of Ovine Complex I
The initial purification of ovine complex I was performed in a manner similar to the established protocol for bovine complex I (38), which involved two successive anion-exchange steps followed by size exclusion chromatography. However, optimization of the first anion-exchange step allowed for the omission of the second step while maintaining high purity similar to the original protocol (see under “Experimental Procedures”). Chromatograms from a final optimized purification are shown in Fig. 1, A and B. This protocol resulted in highly enriched complex I with only trace contamination by 2-oxoglutarate dehydrogenase (Fig. 1C). Subunit composition of the purified intact complex was determined using mass spectrometry. Several unique peptides corresponding to all known complex I subunits were identified from SDS-polyacrylamide gel slices, except in the case of the highly hydrophobic core subunit ND4L (Fig. 1C and Table 2). Multiple sequences of the ovine mitochondrion-encoded sequences can be found in on-line databases (31–36), and in most cases, our MS data confirmed the particular sequence present in our samples (Table 2). In the case of subunit ND4L, no peptides corresponding to available ovine sequences were detected; however, when searched against a database of all mammalian sequences, a match was found for a peptide corresponding to a Connochaetes taurinus (blue wildebeest) sequence of ND4L (Fig. 2). This C. taurinus sequence is ∼96-98% identical to the available ovine sequences, similar to the identity seen within the Ovis genus for ND4L sequences. The significant difference in the C. taurinus ND4L sequence is a Met to Lys change at position 80 that introduces an additional trypsin site, resulting in the observed peptide (Fig. 2). Given the variability seen in the ovine mitochondrial sequences (31–36), it is likely that this peptide corresponds to the ND4L protein present in our ovine sample that contains a Lys at position 80.
FIGURE 1.

Initial purification of ovine complex I in DDM. A, Q-Sepharose anion-exchange chromatogram, A280 (solid line), A420 (dotted line), NaCl gradient (dashed line), and NADH/FeCy activity (triangles, units/fraction) are shown. B, Superose 6 size exclusion chromatogram, A280 (solid line), A420 (dotted line), and NADH/FeCy activity (triangles) are shown. mAU, milli-absorption units. C, SDS-PAGE of purified ovine complex I. Molecular weight standards are indicated on the left. Subunits identified by mass spectrometry are indicated (Table 2). The ? after subunit ND4L signifies a single identified peptide that suggests an alternative sequence (Fig. 2).
FIGURE 2.

Identification of ND4L C-terminal peptide suggests an alternative ovine ND4L sequence. A, sequence of C. taurinus ND4L, the peptide identified by LC-MS/MS, is underlined. B, extracted ion chromatogram of the precursor ion m/z 1051.502+. C, fragment ion spectrum and associated peptide sequence of the tryptic peptide VSNTYGTDYVQNLNLLQC, residues 81–98, derived from ND4L. The identified b and y ions are annotated on the spectrum.
Whereas purified bovine complex I showed no strong preference in activity between the use of soybean asolectin, soybean phosphatidylcholine (PC), or bovine heart PC during the purification (39), ovine complex I maintained the highest activity in a defined mixture of dioleoylphosphatidylcholine (DOPC) and bovine heart cardiolipin (CL). Activity measurements on the enzyme purified in the presence of DOPC and CL showed strong lipid dependence (Table 3). In the absence of lipid in the reaction buffer, the ovine complex showed almost no DQ activity, even after purification in the presence of lipids (Table 3). Inclusion of asolectin improved activity, which was further increased by the addition of CL (Table 3). However, when asolectin was replaced in the reaction buffer with bovine heart polar lipid extract or sources of pure PC lipids, either isolated from egg yolk (EggPC) or with uniform acyl chains (DOPC), the activity of the purified complex I increased (Table 3). The highest activity measured was in the more defined lipid mixture of 4:1 DOPC/CL. Therefore, this combination was used on the gel filtration columns. When lipids were not added to the purification buffers, the purity of the sample was not noticeably affected; however, the isolated complex I had very low activity even when lipids were present in the reaction buffer (Table 3).
TABLE 3.
Activity of complex I purified in DDM with DOPC and CL
Assays were performed in the presence of different lipids at 0.25 mg/ml in 0.1% CHAPS.
| Reaction buffer containing | NADH/DQ activity (unitsa/mg) ± S.D.b |
|---|---|
| No lipids | 0.18 ± 0.01 |
| Asolectin | 1.70 ± 0.06 |
| 4:1 Asolectin/CL | 2.45 ± 0.09 |
| Bovine heart lipids | 2.85 ± 0.11 |
| 4:1 EggPC/CL | 3.15 ± 0.13 |
| 4:1 DOPC/CL | 3.18 ± 0.10 |
| 4:1 DOPC/CL (purified in absence of lipids) | 0.78 ± 0.07 |
a Units of NADH/DQ activity are defined as micromoles of NADH min−1 throughout.
b n = 3–5.
These data support the strong dependence of mammalian mitochondrial complex I activity on lipids, which has also been reported for the bovine enzyme (39). However, ovine complex I is more sensitive than bovine complex I, requiring specific lipids and the addition of CL to the reaction. This suggests that the ovine enzyme binds its native lipids more loosely than bovine complex I and that more lipids, including CL, are lost during the purification or when diluted into the reaction buffer. Further experiments are needed to quantify and identify any bound lipids carried through the purification. Nonetheless, when supplemented in the purification and reaction buffers, the lipids are able to sustain the activity of the purified enzyme at similar levels to the chromatographically purified bovine complex in DDM (39).
Characterization of Ovine Complex I Subcomplexes
To investigate differences in the stability of subunit interactions, purified ovine complex I was fragmented into subcomplexes by the addition of the dispersive detergent LDAO. It has been shown for bovine complex I that addition of 1% LDAO results in the dissociation of the peripheral and membrane arms along a fissure that splits the membrane (38, 40, 41). The peripheral arm can remain attached to ND1, ND2, and other membrane supernumerary subunits adjacent to the Q-module (MWFE, B9 and B16.6), forming subcomplex Iα (40, 42). Subunits ND4, ND5, and associated supernumerary subunits remain together forming subcomplex Iβ (38, 40–42). These two subcomplexes can be separated on a Mono Q anion-exchange column with the remaining subunits, referred to as fraction Iγ, found in the flow-through (38). After isolation of bovine subcomplex Iα, further incubation in LDAO leads to separation of the membrane subunits resulting in subcomplex Iλ, composed almost exclusively of the peripheral arm subunits (38, 41). Usually, the core subunits ND1 and ND2 are found in the Iγ fraction, indicating that they are only weakly associated with Iα (38, 41). Therefore, the Iα-to-Iλ transition is better characterized by the loss of the 39- and 15-kDa, PGIV, MWFE, B9, B14, SDAP, and B14.7 supernumerary subunits (38, 41). All transmembrane and intermembrane space subunits are lost during the Iα-to-Iλ transition except for the single transmembrane domain containing subunit B16.6 (38, 41).
Given the high sequence identity between the ovine and bovine complexes (Table 1), it was expected that the ovine enzyme would behave similarly to the bovine enzyme after LDAO treatment. However, surprising differences were seen for the LDAO-treated ovine complex I. First, after a 4-h pre-incubation in LDAO, it was not possible to isolate intact subcomplex Iα from ovine complex I, as nearly all ND1, ND2, 15-kDa, MWFE, B9, and B14.7 subunits were coming in the Iγ fraction (Fig. 3 and Table 4). However, the 39-kDa, B14, SDAP, and PGIV subunits remained associated with the ovine Iλ-like subcomplex even after overnight incubation in 0.1% LDAO. Of the remaining subunits, it appears that SDAP, B16.6, and PGIV may be sub-stoichiometric (Table 4); however, all appear as visible bands on the Iλ-like subcomplex gels (Fig. 3B). This suggests that the Iα-to-Iλ-like transition is very rapid for ovine complex I and that ovine complex I breaks down into a distinct stable subcomplex, which we term subcomplex IλO (for ovine Iλ; Fig. 3, A and B). Subcomplex IλO is larger than bovine Iλ, given that it maintains more of the bovine Iα supernumerary subunits (39 kDa, B14, SDAP, and PGIV; Fig. 3B). After a shorter 1-h pre-incubation in LDAO, some of the Iα subunits remained partially bound to subcomplex IλO (MWFE, 42 and 15 kDa; Table 4). However, the addition of these few subunits did not fully reconstitute a bovine-Iα-like subcomplex and they were readily lost after further incubation in LDAO.
FIGURE 3.
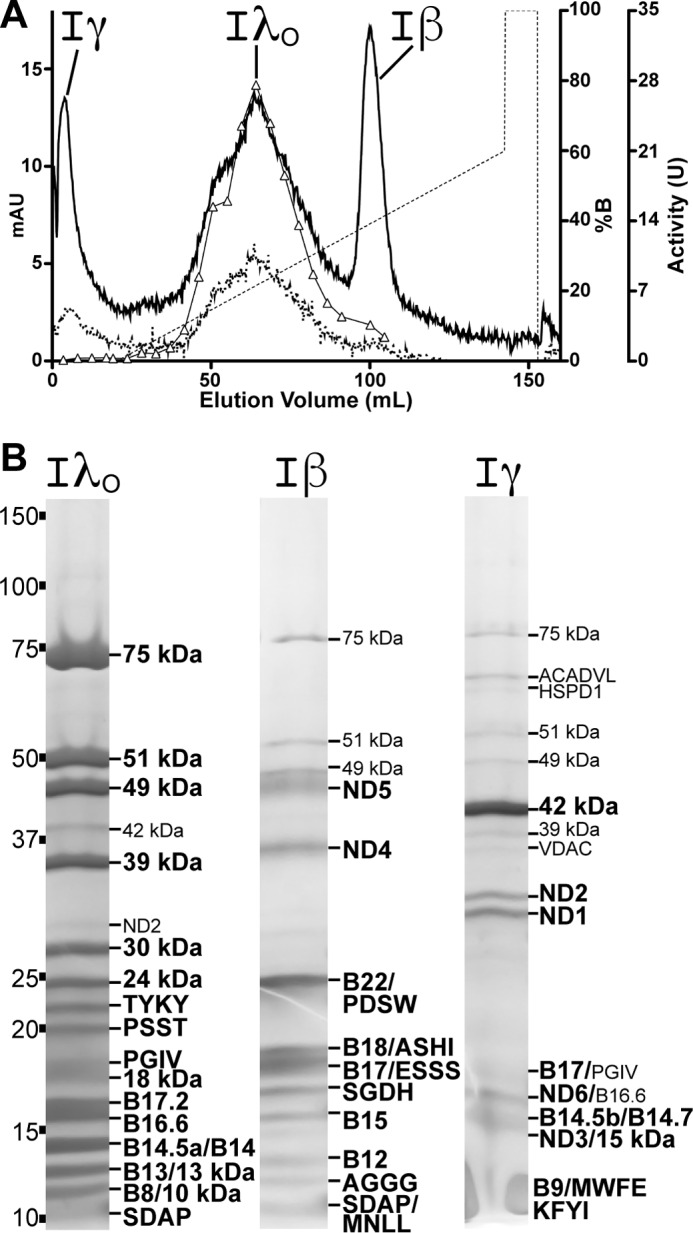
Characterization of ovine complex I subcomplexes. A, Mono Q anion-exchange chromatogram, A280 (solid line), A420 (dotted line), gradient (dashed line), and NADH/FeCy activity (triangles) are shown. mAU, milli-absorption units. B, representative SDS-PAGE of ovine subcomplexes used for subunit identification by mass spectrometry. Minor constituents and contaminants (such as small amounts of IλO and Iγ subunits in other subcomplexes) that can be seen on the gel are indicated in small font. The Iγ fraction is smeary near the bottom of the gel due to a high concentration of detergent in the sample. Non-complex I contaminants: ACADVL, very long-chain acyl-coenzyme A dehydrogenase; HSPD1, mitochondrial heat shock protein; VDAC, voltage-dependent anion channel. See also Table 4.
TABLE 4.
Mass spectrometry identification for subunits of ovine complex I within subcomplexes
Total spectrum counts and normalized exponentially modified protein abundance index (emPAI) values are shown for both experiment 1 (4-h pre-incubation in LDAO, top row) and experiment 2 (1-h pre-incubation in LDAO, bottom row). The values for each subunit that are in bold indicate their subcomplex assignment based on total spectrum count and exponentially modified protein abundance index (80). In the few cases where assignment was still ambiguous, visual inspection of the gel was used to confirm the presence/absence of the subunit (marked by a “v”).
| Subunit |
IλO |
Iβ |
Iγ |
||||
|---|---|---|---|---|---|---|---|
| Bovine | Human | Total spectrum count | Normalized emPAI | Total spectrum count | Normalized emPAI | Total spectrum count | Normalized emPAI |
| ND1 | ND1 | 86 | 10.4 | 61 | 13.9 | 560 | 31.5 |
| 175 | 8.6 | 141 | 13.3 | 298 | 23.4 | ||
| ND2 | ND2 | 171 | 19.9 | 67 | 12.1 | 814 | 74.7 |
| 151 | 10.4 | 157 | 18.5 | 284 | 37.5 | ||
| ND3 | ND3 | 28 | 3.9 | 34 | 8.4 | 45 | 21.6 |
| 33 | 8.5 | 20 | 5.8 | 387 | 59.3 | ||
| ND4 | ND4 | 88 | 6.7 | 195 | 17.6 | 84 | 8.2 |
| 316 | 6.0 | 302 | 15.4 | 94 | 7.1 | ||
| ND4L | ND4L | ||||||
| ND5 | ND5 | 114 | 3.3 | 1159 | 56.0 | 117 | 10.9 |
| 536 | 26.7 | 906 | 65.7 | 326 | 25.7 | ||
| ND6 | ND6 | 9 | 2.9 | 1 | 0.1 | 151 | 8.2 |
| 48 | 5.0 | 22 | 4.3 | 27 | 11.3 | ||
| 75 kDa | NDUFS1 | 6526 | 704.9 | 1103 | 199.0 | 411 | 50.9 |
| 2261 | 212.2 | 781 | 94.2 | 444 | 80.9 | ||
| 49 kDa | NDUFS2 | 2563 | 405.6 | 471 | 83.7 | 508 | 76.9 |
| 2717 | 429.8 | 1220 | 179.6 | 226 | 52.5 | ||
| 30 kDa | NDUFS3 | 493 | 135.4 | 212 | 76.0 | 217 | 61.2 |
| 1224 | 255.4 | 693 | 184.6 | 164 | 70.4 | ||
| PSST | NDUFS7 | 882 | 200.3 | 285 | 135.4 | 304 | 123.5 |
| 307 | 54.4 | 186 | 49.3 | 87 | 43.0 | ||
| TYKY | NDUFS8 | 559 | 271.3 | 199 | 98.8 | 213 | 80.9 |
| 520 | 190.9 | 288 | 79.5 | 52 | 21.3 | ||
| 51 kDa | NDUFV1 | 1257 | 134.4 | 328 | 55.2 | 333 | 41.0 |
| 1548 | 119.2 | 1162 | 102.2 | 261 | 45.4 | ||
| 24 kDa | NDUFV2 | 968 | 394.2 | 399 | 227.6 | 356 | 138.8 |
| 827 | 233.8 | 560 | 208.2 | 124 | 67.6 | ||
| 18 kDa | NDUFS4 | 453 | 103.3 | 151 | 64.2 | 146 | 54.0 |
| 454 | 108.0 | 324 | 35.5 | 51 | 36.5 | ||
| 15 kDa | NDUFS5 | 73 | 10.8 | 9 | 5.2 | 84 | 16.5 |
| 134 | 12.0 | 27 | 4.8 | 8 | 4.0 | ||
| 13 kDa | NDUFS6 | 212 | 192.1 | 279 | 297.9 | 120 | 129.7 |
| 592 | 125.4 | 393 | 96.9 | 16 | 14.7 | ||
| 10 kDa | NDUFV3 | 141 | 60.0 | 29 | 12.4 | 11 | 4.0 |
| 146 | 21.1 | 59 | 12.7 | 0 | 0.0 | ||
| MWFE | NDUFA1 | 18 | 11.3 | 4 | 2.4 | 20 | 11.3 |
| 32 | 13.4 | 6 | 3.5 | 1 | 1.7 | ||
| B8 | NDUFA2 | 359 | 200.1 | 154 | 101.1 | 102 | 100.9 |
| 467 | 144.2 | 264 | 84.5 | 29 | 23.5 | ||
| B9 | NDUFA3 | 139 | 49.4 | 40 | 27.3 | 322 | 57.5 |
| 117 | 19.8 | 61 | 26.0 | 24 | 23.6 | ||
| B13 | NDUFA5 | 284 | 74.9 | 207 | 146.1 | 146 | 91.7 |
| 416 | 44.5 | 206 | 55.2 | 55 | 51.6 | ||
| B14 | NDUFA6 | 324 | 50.0 | 150 | 61.0 | 130 | 44.1 |
| 578 | 19.6 | 302 | 35.9 | 40 | 22.8 | ||
| B14.5a | NDUFA7 | 402 | 341.4 | 105 | 115.5 | 132 | 127.4 |
| 558 | 249.5 | 291 | 182.0 | 58 | 52.7 | ||
| PGIV | NDUFA8 | 406 | 167.0 | 89 | 37.4 | 223 | 106.2 |
| 890 | 209.7 | 159 | 26.8 | 41 | 19.4 | ||
| 39 kDa | NDUFA9 | 785 | 96.1 | 372 | 73.2 | 441 | 64.5 |
| 1437 | 104.2 | 1002 | 100.8 | 192 | 47.8 | ||
| 42 kDa | NDUFA10 | 703 | 134.0 | 321 | 90.3 | 1686 | 378.1 |
| 1046 | 90.7 | 300 | 102.6 | 123 | 36.3 | ||
| B14.7 | NDUFA11 | 58 | 17.6 | 7 | 3.6 | 413 | 71.4 |
| 49 | 5.2 | 41 | 11.4 | 55 | 22.9 | ||
| B17.2 | NDUFA12 | 409 | 175.5 | 219 | 55.8 | 157 | 50.1 |
| 1617 | 217.1 | 604 | 97.9 | 50 | 27.7 | ||
| B16.6 (v) | NDUFA13 | 268 | 176.0 | 244 | 254.3 | 289 | 243.1 |
| 1388 | 365.1 | 721 | 360.7 | 97 | 66.0 | ||
| SDAPa (v) | NDUFAB1 | 68 | 111.5 | 267 | 366.8 | 60 | 85.0 |
| 126 | 102.3 | 175 | 241.4 | 19 | 19.7 | ||
| MNLL | NDUFB1 | 10 | 9.7 | 254 | 70.7 | 25 | 34.8 |
| 21 | 5.8 | 42 | 46.4 | 13 | 18.7 | ||
| AGGG | NDUFB2 | 5 | 1.6 | 49 | 11.5 | 12 | 4.8 |
| 7 | 2.0 | 21 | 4.4 | 0 | 0.0 | ||
| B12 | NDUFB3 | 80 | 30.9 | 385 | 128.2 | 112 | 66.4 |
| 30 | 8.4 | 425 | 80.1 | 21 | 15.8 | ||
| B15 | NDUFB4 | 60 | 17.1 | 361 | 85.6 | 149 | 51.9 |
| 67 | 9.7 | 309 | 39.6 | 40 | 23.7 | ||
| SGDH | NDUFB5 | 158 | 39.1 | 604 | 115.6 | 226 | 72.5 |
| 150 | 13.5 | 1166 | 110.9 | 83 | 40.1 | ||
| B17 | NDUFB6 | 82 | 30.0 | 247 | 121.2 | 196 | 86.3 |
| 53 | 10.2 | 644 | 64.6 | 46 | 29.9 | ||
| B18 | NDUFB7 | 116 | 85.9 | 236 | 161.1 | 183 | 121.8 |
| 77 | 33.6 | 1015 | 332.6 | 80 | 72.9 | ||
| ASHI | NDUFB8 | 213 | 74.9 | 273 | 151.9 | 155 | 51.6 |
| 101 | 16.1 | 886 | 172.1 | 44 | 23.4 | ||
| B22 | NDUFB9 | 139 | 25.0 | 585 | 100.3 | 240 | 53.5 |
| 45 | 7.0 | 918 | 117.3 | 36 | 15.7 | ||
| PDSW | NDUFB10 | 253 | 67.2 | 758 | 307.9 | 229 | 105.3 |
| 68 | 16.0 | 1226 | 190.4 | 81 | 46.5 | ||
| ESSS | NDUFB11 | 170 | 63.8 | 568 | 212.6 | 182 | 71.3 |
| 70 | 20.7 | 1375 | 215.9 | 69 | 68.5 | ||
| KFYI | NDUFC1 | 1 | 0.7 | 0 | 0.0 | 28 | 7.1 |
| 2 | 1.7 | 0 | 0.0 | 6 | 6.0 | ||
| B14.5b | NDUFC2 | 54 | 18.6 | 55 | 39.4 | 1025 | 377.0 |
| 21 | 2.2 | 75 | 21.1 | 166 | 172.5 | ||
a Two copies of the SDAP protein are known to exist in complex I; in ovine complex I, one is associated with IλO and the other with Iβ (11).
All of the subunits in IλO are found on the matrix side of the IMM except for B16.6, which is a single-pass transmembrane protein, and PGIV, which is located in the inter-membrane space (11, 23, 43). The presence of these two subunits in IλO (in the absence of other transmembrane subunits such as ND1, ND2, MWFE, or B9) suggests a strong interaction between the N terminus of B16.6 and the Q-module of the peripheral arm. This possibility is supported by the fact that B16.6 also remains as the sole transmembrane subunit in bovine Iλ (43). The recent structural work on complex I shows direct interaction between B16.6 and PGIV in the inter-membrane space (11, 14, 25). Hence, in the ovine enzyme, where PGIV is not lost from IλO, this interaction with B16.6 must be more stable even in the absence of other interaction partners.
Despite the significant differences between the Iα, Iλ, and IλO subcomplexes of the bovine and ovine enzymes, ovine subcomplex Iβ is nearly identical to that of its bovine counterpart (44). Subcomplex Iβ is composed of the distal membrane core subunits ND4 and ND5, with 12 additional supernumerary subunits (B22, PDSW, B18, ASHI, B17, ESSS, SGDH, B15, B12, AGGG, SDAP, and MNLL; Fig. 3 and Table 4). The only difference between the bovine and ovine Iβ subcomplexes is that subunit B14.5b has been identified in bovine subcomplex Iβ (41), whereas this subunit was predominantly observed in the ovine Iγ fraction (Fig. 3B and Table 4).
The differences in the composition of the ovine subcomplexes suggest significant differences in the stability of the interactions among the supernumerary subunits despite the high sequence identity (Table 1). These data support the idea that alternative mammalian complex I homologues may be better candidates for structural studies and that available homologues should be further characterized.
Detergent Effects on Ovine Complex I in Membranes
To further characterize ovine complex I, a detergent screen was performed on mitochondrial membranes. By testing the activity of complex I across many detergents, conditions for the purification of more active and stable enzyme may be found. Samples of washed mitochondrial membranes were suspended in a 0.1% CHAPS buffer containing 0.25 mg/ml 4:1 DOPC/CL (optimal lipid mixture, Table 3) in the presence of 0.1% of various detergents, and the NADH/decylubiquinone (DQ) activity of complex I was measured (Table 5). According to our estimates based on the NADH/FeCy and NADH/HAR activity (see below) of purified ovine complex I, complex I constitutes ∼8% of the protein in this sample (Table 6). This estimate agrees well with the relative concentrations of complex I estimated at ∼10% of total protein in sub-mitochondrial particles (SMPs) (45). However, because we were only interested in the relative activity between the different detergent samples, the values in Table 4 are reported in units/mg total protein.
TABLE 5.
Effect of different detergents on activity of complex I from ovine mitochondrial membranes
The reaction buffer contained 0.1% of each detergent, in addition to 0.1% CHAPS and 0.25 mg/ml 4:1 DOPC/CL except where indicated.
| units/mg ± S.D. | |
|---|---|
| Detergenta | |
| No detergent, no lipids | 0.478 ± 0.039 |
| 0.01% CHAPS total, no lipids | 0.472 ± 0.037 |
| 0.1% CHAPS total, no lipids | 0.489 ± 0.008 |
| 0.1% CHAPS total | 0.527 ± 0.027 |
| 0.2% CHAPS total | 0.553 ± 0.019 |
| Digitonin | 0.587 ± 0.014 |
| DM | 0.289 ± 0.010 |
| UDM | 0.273 ± 0.010 |
| DDM | 0.289 ± 0.007 |
| TDM | 0.249 ± 0.012 |
| CYMAL-5 | 0.146 ± 0.019 |
| CYMAL-6 | 0.137 ± 0.011 |
| CYMAL-7 | 0.156 ± 0.003 |
| ANAPOE C10E9 | 0.020 ± 0.003 |
| ANAPOE C12E8 | 0.022 ± 0.002 |
| Brij35 | 0.066 ± 0.007 |
| DMNG | 0.592 ± 0.016 |
| LMNG | 0.694 ± 0.025 |
| GDN | 0.594 ± 0.018 |
| DHPC | 0.502 ± 0.019 |
| trans-PCCαM | 0.116 ± 0.018 |
| Flux through respiratory chain, membranes without detergent, added lipids, or DQb | |
| Flux | 0.405 ± 0.007 |
| + 20 μm Cyt c | 0.959 ± 0.022 |
| + 20 μm Cyt c and 2.5 μm rotenone | 0.017 ± 0.008 |
| + 20 μm Cyt c and 3 μm antimycin A | 0.044 ± 0.005 |
| + 20 μm Cyt c and 400 μm KCN | 0.033 ± 0.002 |
a Data are for NADH/DQ activity. n = 3–6.
b Data are for NADH/O2 activity. n = 3–5.
TABLE 6.
Profiles of two representative purifications of ovine complex I
NADH/FeCy activity was measured at each purification step.
| Volume | Protein | Total activity | Specific activity | |
|---|---|---|---|---|
| ml | mg | units | units/mg | |
| DDM purification | ||||
| Solubilized washed membranes | 53 | 584 | 3400 | 5.8 |
| Extract supernatant | 50 | 269 | 3200 | 11.9 |
| Q-Sepharose pooled fractions | 58 | 50 | 1900 | 38.0 |
| Superose 6 pooled fractions | 6 | 6.4 ± 0.6a | 530 ± 15a | 82.0 ± 7. b |
| LMNG purification | ||||
| Solubilized washed membranes | 55 | 514 | 3700 | 6.0 |
| Extract supernatant | 52 | 333 | 3000 | 7.2 |
| Q-Sepharose-pooled fractions | 45 | 61 | 860 | 15.7 |
| Superose 6-pooled fractions | 8 | 3.2 ± 0.2a | 230 ± 10a | 71.0 ± 4.8b |
a n = 3–5.
b The difference in the specific activity may stem from an overestimation of protein concentration due to LMNG carried over in the BCA assay as the presence of LMNG was not controlled in the BCA standards.
Control experiments were performed without detergent or lipids, with 0.01, 0.1, or 0.2% CHAPS to determine the baseline activity and to control for the effect of the higher detergent concentrations (Table 5). We included 0.1% CHAPS (below the critical micelle concentration) in all experiments to control for differing capabilities of the detergents to readily disperse the mitochondrial membranes and to solubilize the added lipids. As an additional control, we used the gentle detergent digitonin, which has been previously used to isolate respiratory chain supercomplexes (46). The DQ activity in the presence of digitonin was slightly higher than that in CHAPS alone (Table 5). Using these values as a baseline, other detergents were investigated for their effect on complex I activity.
First, a series of maltosides was investigated. The maltosides are the most commonly used detergents for membrane-protein biochemistry and crystallography and consist of a single maltose disaccharide with an acyl chain of variable length (47). Here, we investigated maltosides with acyl chains from 10 to 13 carbons (DM, UDM, DDM, and TDM). TDM has been previously used in the successful purification and crystallization of bacterial complex I from T. thermophilus (21). In each case, we found that the addition of the maltoside detergent significantly reduced the activity of ovine complex I (p < 0.001) to approximately half that seen in CHAPS alone or CHAPS plus digitonin. This reduction was even more pronounced for the CYMAL detergents (Table 5). CYMAL detergents are similar to the other maltosides, except that they have a cyclohexane ring on the end of their acyl chains.
Even stronger reduction of complex I activity was observed for the polyoxyethylene (POE) detergents C10E9 and C12E8 (Table 5). These detergents do not contain a maltoside headgroup but instead possess an oxyethylene polymer with nine and eight residues, respectively. The POE detergent Brij 35, which has a long 23 polyethylene glycol residue polymer, also inhibited complex I activity but to a lesser extent than the shorter POE detergents (Table 5). It should be noted that the reduction of complex I activity by the maltoside and POE detergents is likely not due to disruption of complex I structure, but due to direct inhibition from blockage of the Q-site (as observed previously for the POE detergents Triton X-100, Brij-35, and Thesit for bovine complex I (48)). Therefore, although it may still be possible to use these detergents in structural studies, they will prevent the use of activity measurements as a method for determining the quality of a complex I sample.
Conversely, the neopentyl glycol detergents maintained or even increased complex I activity in the membrane sample relative to CHAPS alone (Table 3). These branched detergents are composed of two maltose headgroups and two acyl chains all connected via a single carbon (49). Neopentyl glycol detergents have been shown to have positive effects on the stability of membrane proteins in solution (49). Decyl maltose neopentyl glycol (DMNG) and lauryl maltose neopentyl glycol (LMNG) have 10 and 12 carbon acyl chains, respectively. In our experiments, DMNG maintained complex I activity at levels similar to that of the enzyme in digitonin, whereas the NADH/DQ activity of complex I in LMNG was significantly increased relative to digitonin or 0.2% CHAPS alone (p < 0.001, see Table 5).
Additional “miscellaneous” detergents that were screened included the rigid steroid-based detergent GDN (50), the short-chain lipid detergent DHPC, and the dicyclohexane containing maltoside trans-PCCαM. GDN is structurally related to digitonin, but with a simpler dimaltose headgroup (50); therefore, it is not surprising that it had a similar effect on complex I activity (Table 5). However, unlike the case with digitonin, small scale extraction experiments with GDN indicated that it was unable to efficiently extract complex I from the membrane (data not shown). DHPC had a slight negative effect on complex I activity relative to 0.2% CHAPS alone (p < 0.05). Finally, trans-PCCαM had a similar inhibitory effect as the other cyclohexane-containing detergents.
As an additional control, we measured electron flux through the ETC in washed ovine mitochondrial membranes (Table 5). In these experiments, no DQ was added to the sample. Hence, the electrons from NADH travel via complex I to endogenous coenzyme Q, and the reduced quinol diffuses in the membrane to complex III where the electrons were then transferred to Cyt c. Finally, reduced Cyt c carries the electrons to complex IV where they are used to reduce O2 to water. To prevent the buildup of a membrane potential, the proton ionophore CCCP was added to the reaction. In the absence of added Cyt c, the NADH/O2 activity was measured to be 0.405 ± 0.007 units/mg protein (Table 5). However, because much of the endogenous Cyt c was lost during washing of the membranes, activity was also measured after addition of 20 μm bovine Cyt c, resulting in much higher activity (Table 5). Addition of Cyt c over 20 μm failed to increase activity further. To ensure that the oxidation of NADH observed in these experiments was due to flux through the ETC, the effect of specific inhibitors for each complex was examined (Table 5). In separate experiments, complex I was inhibited by rotenone; complex III was inhibited by antimycin A, and complex IV was inhibited by KCN (Table 5). Inhibition of any of the individual complexes nearly abolished oxidation of NADH, indicating that the activity measured from the membranes was due to specific electron flux through the ETC. This flux provided an upper limit to complex I activity in the membranes at 0.942 ± 0.023 units/mg total protein (after correcting for activity seen in the presence of rotenone; Table 5).
Because it is likely that NADH/FeCy activity of complex I does not depend on the membrane environment (being catalyzed by the peripheral hydrophilic domain), this activity can be used to calibrate the NADH/Q activity of complex I in the membrane. Specific NADH/FeCy activity of the ovine complex I purified in DDM was 82.0 ± 7.6 units/mg complex I, and NADH/FeCy activity of the washed mitochondrial membranes was 6.26 ± 0.32 units/mg protein or 76.0 ± 3.7 units/ml. Therefore, the approximate concentration of complex I in the membranes was 0.93 ± 0.10 mg/ml (or 7.7 ± 0.8% of total protein), and the upper limit of NADH/Q activity of complex I was calculated to be 12 ± 1 units/mg complex I. However, because of the non-hyperbolic NADH concentration-activity profile of FeCy (see below), complex I activity in the membrane was also estimated using hexaammineruthenium(III) (HAR) as the electron acceptor. HAR shows a hyperbolic NADH concentration activity profile (see below), and it is known that this reaction proceeds via a ternary complex mechanism (51). The specific NADH/HAR activity of purified complex I (at 100 μm NADH) was 39.1 ± 3.0, and the NADH/HAR activity of the washed mitochondrial membranes was 2.67 ± 0.10 units/mg protein or 31.5 ± 1.2 units/ml. Therefore, NADH/HAR activity gives the approximate concentration of complex I in the membrane as 0.81 ± 0.03 mg/ml (or 6.8 ± 0.3% of total protein). Using HAR, the upper limit of NADH/Q activity of complex I was calculated to be 14 ± 1 units/mg complex I. These values of complex I NADH/Q activity fall in the middle of estimates of complex I NADH oxidase activity in SMPs, which range from ∼4 to 30 units/mg complex I measured using a variety of Q analogues (45, 52–54). Our value of 12–14 units/mg agrees closely with the NADH/DQ activity of ∼14 units/mg complex I measured in bovine heart SMPs by Fato et al. (originally reported as kcat = 225 s−1 (52)).
This indicates that ovine complex I purified in DDM maintains only ∼25% of its maximum estimated activity in membranes (Table 3). Consequently, we set out to develop a new purification protocol that would maintain higher complex I activity. Given that addition of the neopentyl glycol detergent LMNG to the CHAPS-solubilized membranes resulted in the highest activity measured in detergent and is therefore closest to the maximum activity seen for ovine complex I in the membranes (Table 5), we decided to use this detergent for our optimization. If the branched LMNG molecule is capable of improving the stability of the complex throughout the purification, it may result in a more homogeneous and active sample for structural studies and further characterization.
Purification of Complex I in LMNG Maintains High Activity
LMNG was able to efficiently extract complex I from the mitochondrial membranes; therefore, a similar protocol was followed during the purification as for the DDM purification with minor changes (see under “Experimental Procedures”). The purification was performed by a single anion-exchange step followed by gel filtration (Fig. 4, A and B). Finally, the NADH/FeCy active fractions from the SEC column were pooled and concentrated. This protocol resulted in highly pure (in the peak fractions) complex I with similar purity to the DDM purification (Fig. 1C). The fractions from the SEC purification showed similar staining density and variation for the 42-kDa subunit compared with the other subunits across the fractions (Fig. 4C). This indicates retention of this subunit throughout the purification, in contrast to the chromatographic purification of the bovine enzyme, during which this subunit is progressively lost (40). In fact, it has been reported that the 42-kDa subunit can be completely stripped from the bovine enzyme by running the protein over a Mono Q column at room temperature in DDM (40), indicating that this subunit is weakly bound to the complex and that samples of bovine complex purified chromatographically are heterogeneous (42). Therefore, strong adherence of the 42-kDa subunit to the chromatographically purified ovine complex indicates that this is a more homogeneous sample and thus would be well suited for structural work.
FIGURE 4.
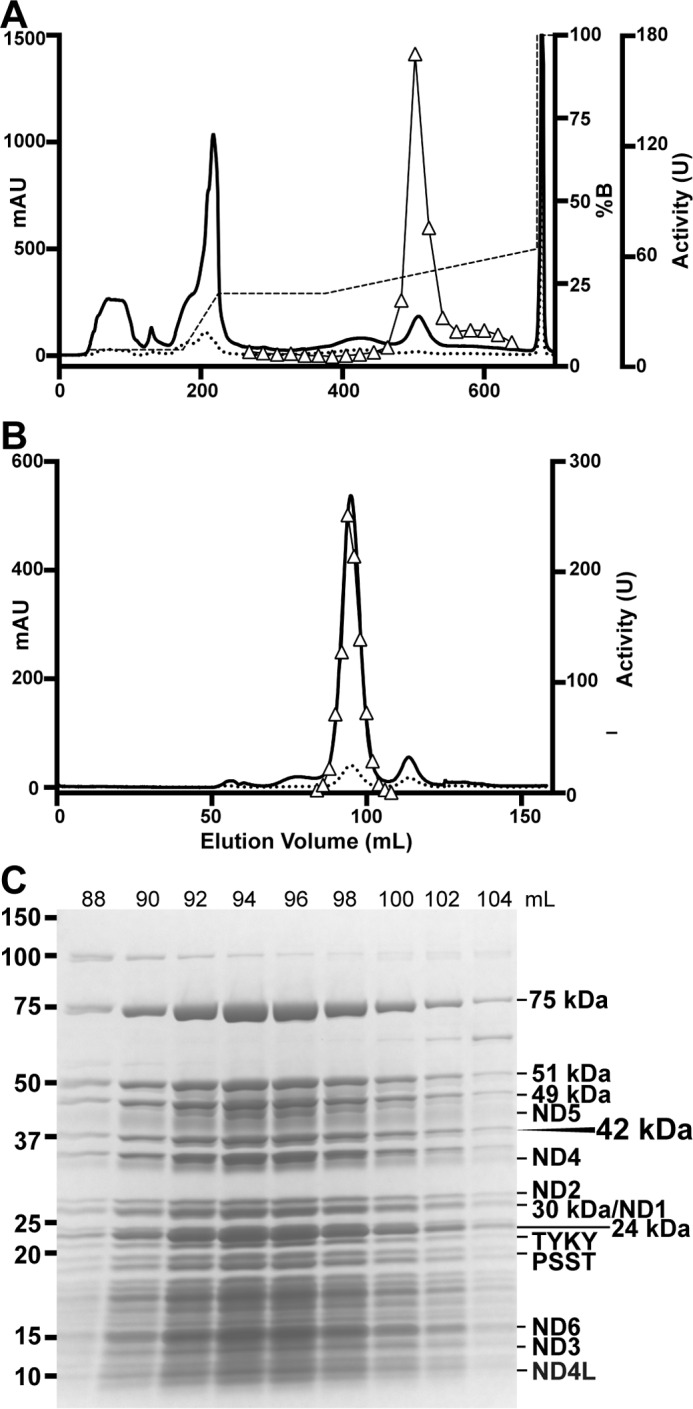
Ovine complex I purification in LMNG. A, Q-Sepharose anion-exchange chromatogram, A280 (solid line), A420 (dotted line), gradient (dashed line), and NADH/FeCy activity (triangles) are shown. B, Superose 6 size exclusion chromatogram, A280 (solid line), A420 (dotted line), and NADH/FeCy activity (triangles) are shown. C, SDS-PAGE of purified ovine complex I. Molecular weight standards are indicated on the left. The positions of core subunits are shown on the right, and the supernumerary 42-kDa subunit is indicated. mAU, milli-absorption units.
The activity of purified complex I was compared between the DDM and LMNG purifications using a reaction buffer containing both 0.1% CHAPS and 0.1% LMNG (Table 7). The enzyme showed higher activity when LMNG was used throughout the purification compared with when DDM was used (4.65 ± 0.12 versus 3.20 ± 0.24, p < 0.01; Table 7). This indicates that the branched LMNG detergent is better able to stabilize the complex throughout the purification and may also help to preserve bound native lipids. To test this hypothesis, the concentration of lipid was measured in the DDM- and LMNG-purified samples using an assay for organic phosphate (PO4) content (55). After the final SEC purification step, it was determined that the DDM-purified samples contained 27.0 ± 2.0 PO4/complex I, whereas the LMNG-purified sample contained significantly more with 36.3 ± 3.9 PO4/complex I (p < 0.001, n = 7). Assuming the ratio of 4:1 (w/w) DOPC/CL, this number of phosphates is equivalent to ∼21 lipids/complex I (∼18 DOPC and ∼3 CL) for the DDM preparation and ∼29 lipids/complex I (∼24 DOPC and ∼5 CL) for the LMNG preparation. Although this estimated lipid content agrees well with other reported values of lipids co-purified with complex I, the number of CL estimated is less than the ∼10–16 CL/complex I previously reported for the bovine complex (39, 56), which again suggests that the ovine complex may be more susceptible to delipidation (see Table 3).
TABLE 7.
DQ activity of complex I purified in the specified detergent and then exchanged into other detergents by SEC
Reaction buffer contained 0.1% CHAPS, 0.25 mg/ml 4:1 DOPC/CL, and 0.1% LMNG. Superscript RT indicates that SEC was performed at room temperature.
| SEC detergent (all at 0.05%) | Activity (units/mg) ± S.D.a |
|---|---|
| DDM purification | |
| DDM | 3.20 ± 0.24 |
| DDMRT | 2.81 ± 0.07 |
| TDMRT | 3.12 ± 0.19 |
| LMNG | 3.46 ± 0.19 |
| LMNG purification | |
| LMNG | 4.65 ± 0.12 |
| DDM | 5.26 ± 0.47 |
| TDMRT | 6.61 ± 0.43 |
| Brij35 | 3.63 ± 0.23 |
a n = 3–4.
To further characterize the purified complex in maltoside detergents, after the initial anion-exchange step (Fig. 4A), the concentrated pooled fractions were split, and the final SEC purification step was run in different detergents on a small scale. Whereas the detergent exchange had a negligible effect on the activity of complex I purified in DDM, exchange of the LMNG-purified sample into DDM or TDM significantly increased the activity of the enzyme compared with the use of LMNG throughout the purification (p < 0.02; Table 7), with maximal overall activity of our preparations, of 6.6 units/mg, being achieved in TDM. However, similar to what was seen with other POE detergents in mitochondrial membranes, exchange into Brij35 resulted in some loss of activity compared with the complex in LMNG (p < 0.001; Table 7). These data were confirmed with full preparations on a larger scale. All NADH/DQ activities reported here have been corrected for inhibition by 2.5 μm rotenone; rotenone inhibited on average 98 ± 1% of observed NADH/DQ activity.
The reason why exchange into DDM or TDM from the LMNG purification results in increased activity remains unclear, given that the use of these detergents in our initial detergent screen had the opposite effect on complex I activity (Table 5). However, it is possible that lipids from the SEC buffers containing either DDM or TDM are better able to replenish lipids that have been stripped from the complex during the anion-exchange step. It is known that LMNG binds tightly to the hydrophobic transmembrane segments of membrane proteins, as evidenced by its low critical micellar concentration and the ability to use very low concentrations of LMNG (0.003%) to stabilize integral membrane proteins in solution (49, 57). Tightly bound LMNG may be ideal for maintaining the structural integrity of complex I and preventing the extensive loss of native lipids (as demonstrated above). However, after the inevitable loss of some lipids during the chromatographic purification, the closely bound LMNG may prevent efficient re-lipidation of the complex. This hypothesis agrees with the known central role of lipids in preserving mammalian complex I activity, especially for the negatively charged CL, which is most at-risk during anion exchange (39). Because the same CHAPS/LMNG assay buffer was used when measuring all values in Table 7, if small amounts of DDM or TDM carried over from the SEC step were able, for instance, to increase the availability of DQ to the enzyme in the CHAPS/LMNG buffer, then we would expect to see the same increase in activity for both the LMNG- and DDM-purified samples. However, this was not the case, leaving as the most likely explanation of the observed effects a partial re-lipidation of the complex during SEC in DDM or TDM.
Because TDM is insoluble at 4 °C, chromatography steps using this detergent were performed at room temperature. Therefore, it is possible that temperature plays a role in the large increase in activity seen for the LMNG-purified sample after exchange into TDM. However, for the DDM-purified sample, performing the final SEC step at room temperature resulted in a loss of activity (Table 7). As would be expected, this suggests that complex I is less stable at this higher temperature and therefore that the activity effects seen for the LMNG-purified sample after exchange into DDM or TDM are likely due to the detergents used and not due to the temperature. This also suggests that the loss of activity during the purification in DDM is not solely due to the loss of lipids but is also due to the loss of the structural integrity of the complex, which would be accelerated at the higher temperature. Therefore, the branched LMNG detergent likely improves the purification of ovine complex I by holding the complex more tightly together. To investigate the stability of the enzyme purified in LMNG, we performed gel-filtration chromatography on samples incubated at 4 °C or room temperature (Fig. 5). After 5 days at 3.5 mg/ml, both samples showed very little aggregation or disassociation of the complex (Fig. 5). This indicates that the complex is highly stable in LMNG even at room temperature, although it is less active than when exchanged into TDM or DDM (Table 7). The high stability of ovine complex I in LMNG further supports the prospect of using this complex I preparation for future structural work.
FIGURE 5.
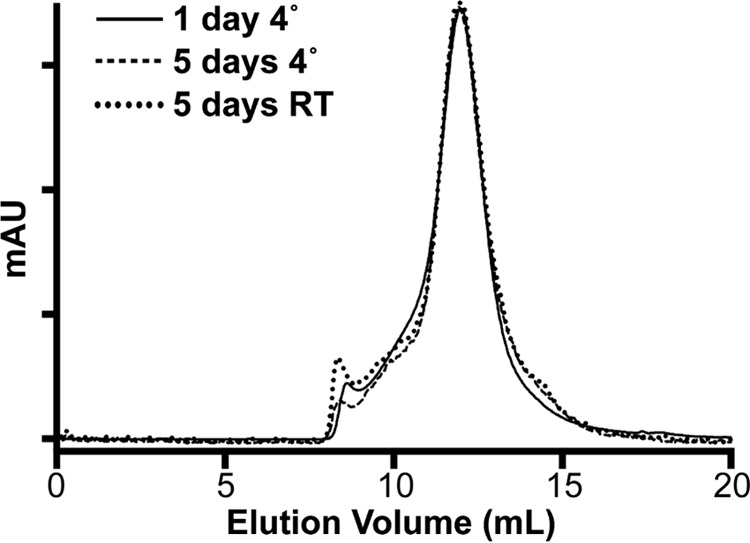
Complex I stability in LMNG. The overlaid size exclusion chromatograms for samples of ovine complex I purified in LMNG, freeze-thawed in liquid nitrogen in 30% glycerol buffer, exchanged into low glycerol buffer (10%), containing 0.05% LMNG, concentrated to ∼3.5 mg/ml, and incubated for 5 days at either room temperature or 4 °C are shown. mAU, milli-absorption units.
Characterization of Complex I Purified in LMNG
To further characterize the LMNG-purified ovine mitochondrial complex I, we measured NADH concentration-activity profiles for three major electron acceptors, FeCy, HAR, and DQ (Fig. 6, A and B). All subsequent NADH/DQ measurement (Figs. 6–8) were done using the same CHAPS/LMNG buffer used in Table 7. These data show that, like the bovine enzyme, the NADH concentration-activity profile of the NADH/FeCy activity is non-hyperbolic (Fig. 6A). This reaction likely proceeds via a ping-pong mechanism in which NADH and FeCy compete for the same binding site near the FMN of complex I, and hence at high concentration NADH prevents FeCy access to the FMN slowing the reaction (58). This concentration-activity profile precludes the accurate measurement of Km and Vmax. Conversely, the NADH concentration-activity profile of HAR is hyperbolic (Fig. 6A) as this reaction proceeds via a ternary complex in which both NADH and HAR are simultaneously bound near the FMN site (51). From these NADH/HAR data, the apparent Km of NADH is 80.1 ± 5.5 μm and Vmax is 74.3 ± 1.4 units/mg complex I. The NADH concentration-activity profile of the NADH/DQ reaction is also hyperbolic (Fig. 6B) and gave a Km of 21.4 ± 2.0 μm and Vmax of 5.1 ± 0.1 units/mg complex I. However, the DQ concentration-activity profile of the NADH/DQ reaction is non-hyperbolic (Fig. 6C). It has been demonstrated previously in bovine heart mitochondria and SMPs that water solubility of the quinone analogue strongly affects the activity measurements (59). At low concentrations of DQ, the rate may be dominated by slow exchange of DQ between micelles (60), whereas at high concentration the DQ is difficult to fully solubilize. Nevertheless, our data clearly demonstrate that under our assay conditions optimal activity is reached with 200 μm DQ, which is twice the concentration optimally used for bovine heart mitochondria and SMPs (59). This ability to use a higher concentration of DQ in our reactions is likely due to the presence of both detergents and lipids in our reaction buffers making the DQ more accessible to the enzyme.
FIGURE 6.
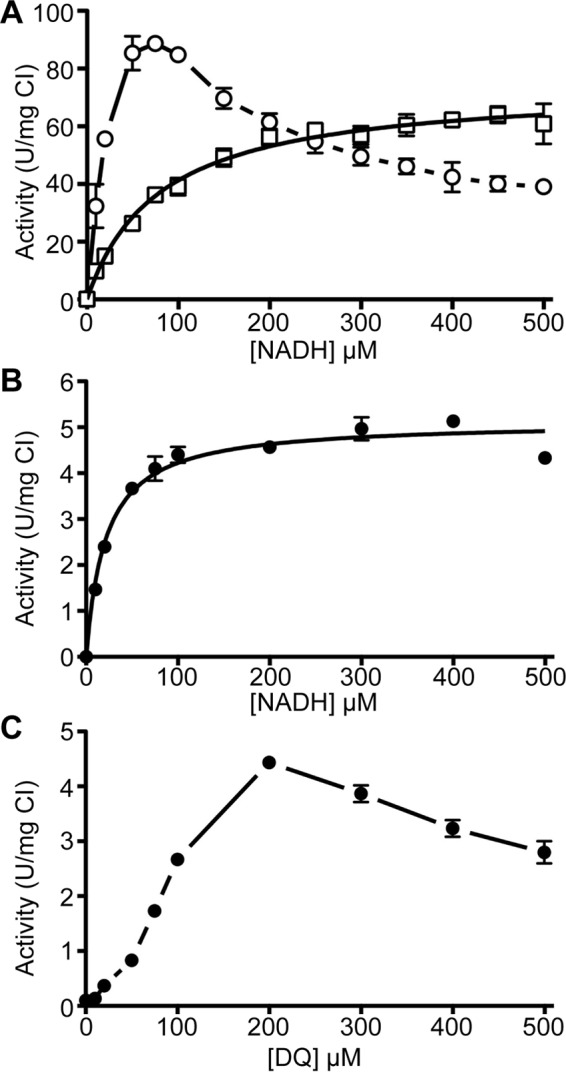
Characterization of ovine complex I purified in LMNG. A, NADH concentration-activity curves for the NADH/FeCy reaction (circles, n = 3–4 for each measurement) and the NADH/HAR reaction (squares, n = 4 for each measurement). B, NADH concentration-activity curve for the NADH/DQ reaction at 200 μm DQ, n = 3–4 for each measurement. C, DQ concentration-activity curve at 100 μm NADH, n = 3–4 for each measurement. Error bars show standard deviation.
FIGURE 7.

Deactive/active transition for ovine complex I purified in LMNG. Complex I was deactivated by incubation in reaction buffer (including 200 μm DQ) at 37 °C for 10 min. A, NADH/DQ activity after addition of the indicated concentration of Mg2+ followed by addition of 100 μm NADH (arrow). B, NADH/DQ activity after additional pre-incubation in 5 μm NADH to re-activate complex I prior to addition of the indicated concentration of Mg2+ followed by addition of 100 μm NADH (arrow).
FIGURE 8.
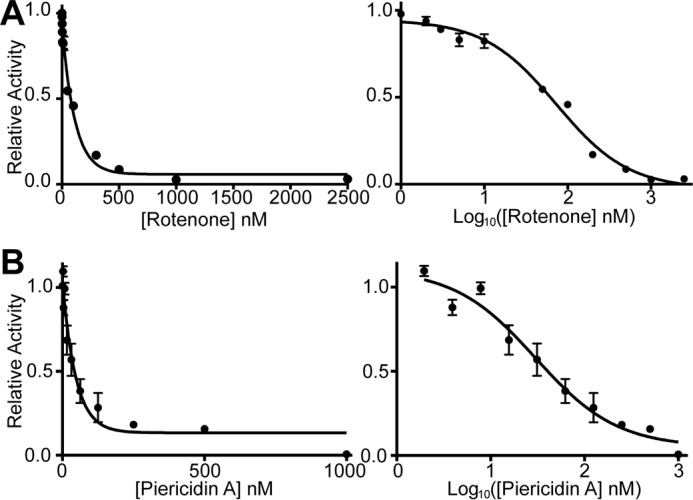
Rotenone and piericidin A sensitivity of ovine complex I purified in LMNG. A, inhibition of complex I by rotenone showing the concentration dependence (left) and the semi-log plot (right), n = 3, for each measurement. B, inhibition of ovine complex I by piericidin A showing the concentration dependence (left) and the semi-log plot (right), n = 3, for each measurement. Error bars show standard deviation.
Next, we characterized the deactive/active enzyme transition at various concentrations of Mg2+. Oxidized mitochondrial complex I is known to enter into a deactive state that can be activated by pre-incubation with NADH (61, 62). It is also known that divalent cations are able to trap the enzyme in the deactive state preventing reactivation after addition of NADH (63). To demonstrate the deactivation of ovine complex I prepared in LMNG, the enzyme was pre-incubated for 10 min at 37 °C in reaction buffer (including 200 μm DQ). Then, before initiating the reaction with 100 μm NADH, 5 or 2.5 mm Mg2+ was added (Fig. 7A). Addition of Mg2+ trapped the deactivated enzyme in the deactive state resulting in lower overall activity (Fig. 7A). However, if complex I was activated by pre-incubation with 5 μm NADH, addition of 5 or 2.5 mm Mg2+ had a smaller inhibitory effect as a larger proportion of complex I had converted back into the active state (Fig. 7B). Additionally, the deactive complex is seen to be gradually re-activated during turnover, with lag phase extended and clearly visible for the 2.5 mm Mg2+ trace in Fig. 7A. This demonstrates that, as seen for other mitochondrial complexes I characterized in SMPs (64), the purified ovine enzyme prepared in LMNG is capable of undergoing the active/deactive transition.
Finally, we tested the inhibition of ovine complex I by two of the most potent complex I inhibitors, rotenone and piericidin A (Fig. 8) (65). At ∼10 nm complex I, the IC50 values for rotenone and piericidin A were determined to be 73 nm for rotenone and 30 nm for piericidin A (95% confidence interval 60–90 nm for rotenone and 20–45 for piericidin A). These values agree with values reported in the literature. For example, at 1 nm complex I in bovine heart SMPs, the IC50 values of rotenone and piericidin A were measured to be 5.5 and 2.8 nm, respectively (66) (the order of magnitude difference in IC50 is accounted for by the order of magnitude difference in the concentration of complex I used in the measurements).
Discussion
Recent advances in structural work on ovine mammalian mitochondrial complex I using the LMNG preparation described here revealed the nearly fully atomic structure of the enzyme (25). This structure has shed light into the mechanism of this important biological energy converter and the roles of its 30 supernumerary subunits. Here, we characterized ovine complex I as an alternative to commonly used bovine enzyme. The usefulness of screening alternative complexes I may be limited by the high overall sequence identity of the individual subunits from the available sources (Table 1). Whether these complexes are different enough to significantly impact their biochemical behavior and thereby their crystallizability and suitability for high resolution cryo-EM has not previously been investigated.
Here, we show that by using a modified protocol based on that used previously for purification of bovine complex I, we obtained a pure and highly active enzyme preparation (Figs. 1 and 4 and Table 3). Using mass spectrometry, we confirmed the presence of all known complex I subunits in our preparation (Fig. 1C and Table 2). We also observed that ovine complex I appears more sensitive to the type of lipids used in the purification steps and in the activity measurements than the bovine complex (Table 3) (39). Whereas the highest activity of the bovine enzyme can be observed when purified in soybean asolectin, the highest activity for ovine complex I was only observed when using a defined mixture of PC and CL (Table 3). This indicates that the ovine and bovine enzymes have differing affinities for lipids, which influences their biochemical behavior.
To further compare the biochemical behavior of the bovine and ovine enzymes, we characterized the subunit composition of ovine complex I subcomplexes. Despite the high sequence identity of the individual ovine and bovine complex I subunits, significant differences could be seen in the composition of the subcomplexes (Fig. 3 and Table 4) (38, 41). The dissociation of ovine complex I into subcomplexes occurred very quickly. Formation of the final subcomplex forms (IλO and Iβ) was near completion after only 1 h of incubation in LDAO and was fully complete after 4 h (Table 4). No transition from IλO to a more bovine-like subcomplex Iλ was seen even after overnight incubation in 0.1% LDAO. Therefore, IλO appears stable and contains additional Q-module subunits (39 kDa, B14 and SDAP) as well as PGIV (Fig. 3 and Table 4), suggesting that the interactions with these subunits may be more stable in ovine complex I than in the bovine complex. These significant differences in the behavior of the closely related bovine and ovine complexes strongly suggest that they will show different properties in structural studies.
To more fully characterize ovine complex I, we tested its activity from mitochondrial membranes using a variety of detergents (Table 5). Although most detergents had a negative impact on activity, we identified that the neopentyl glycol detergents had a positive impact relative to CHAPS alone, increasing complex I activity (Table 5). From this observation, we developed a novel purification protocol using LMNG (Fig. 4). Purification in LMNG resulted in a highly enriched preparation of complex I that was significantly more active than the protein prepared in DDM (Table 7). Further detergent exchange experiments resulted in a preparation of purified mammalian complex I with high and rotenone-sensitive NADH/DQ activity, 6.61 ± 0.43 units/mg. This activity corresponds well to the NADH/DQ activity of ovine complex I in the mitochondrial membranes (∼7.2 units/mg complex I in 0.2% CHAPS or ∼9.0 units/mg complex I in LMNG; see Table 5, taking into account ∼7.7% content of complex I in the membranes). This is the highest reported activity of purified mammalian complex I with DQ, as it is higher than previously reported for the chromatographic purification of bovine enzyme (∼4 units/mg complex I at 30 °C, originally reported in units of μmol e− min−1, which differs from the more standard units of μmol NADH min−1 by a factor of 2 (39)). Previously reported NADH-ubiquinone-1 (Q1) activity of bovine complex I prepared in potassium cholate by the ammonium sulfate precipitation method of Hatefi and co-workers (67–69) was 8.7 units/mg complex I at 37 °C and in sodium deoxycholate/DDM by the chromatographic/ammonium sulfate precipitation purification method of Yoshikawa and co-workers (56) was 7 units/mg complex I at 30 °C. Our activity values compare favorably with these values because NADH/Q1 activity is usually higher than that measured with DQ, as Q1 has a shorter hydrophobic tail. Thus, Q1 is more soluble but also interacts less specifically with complex I, resulting in lower sensitivity to rotenone inhibition.
Comparison of complex I activity between the DDM- and LMNG-purified protein suggests that the loss of activity during the purification in DDM results both from the loss of complex I integrity as well as loss of bound lipids, suggesting that LMNG is better able to maintain the integrity of the complex throughout the purification. This observation is supported by the clear retention of the 42-kDa subunit throughout the purification in LMNG (Fig. 4C), whereas this subunit is lost during the chromatographic purification of the bovine enzyme in DDM (40, 42). However, purification of the bovine enzyme in LMNG by the protocol presented here may also result in improvements to the integrity and activity of the complex. Because of their large hydrophobic surface area and their ability to simultaneously bind multiple subunits, the branched-chain detergents should help to hold membrane protein complexes together. The work presented here confirms that use of LMNG for purification of membrane protein complexes may be a general method to improve their stability (70).
The results presented here indicate that despite high sequence identity, readily available sources of mammalian complex I are sufficiently different from each other to impact their biochemical behavior. Specifically, the ovine complex I characterized here using our novel purification procedure shows improved enzymatic activity and stability, suggesting it may be a prime candidate for crystallography or single particle cryo-EM studies as demonstrated by the recent 3.9 Å structure (25). Further screening and characterization of other homologues may result in additional worthy candidates for structural studies.
Experimental Procedures
Materials
DM, UDM, DDM, TDM, CHAPS, LDAO, and trans-PCCαM were purchased from Glycon Biochemicals GmbH (Luckenwalde, Germany). CYMAL-5, CYMAL-6, 7-cyclohexyl-1-heptyl-β-d-maltoside (CYMAL-7), polyoxyethylene(9)decyl ether (ANAPOE C10E9), polyoxyethylene(8)dodecyl ether (ANAPOE C10E8), polyethylene glycol (23), Brij 35, DMNG, LMNG, GDN, and DHPC were purchased from Generon (Berkshire, UK), a distributor for Anatrace (Maumee, OH). DQ was purchased from Santa Cruz Biotechnology, Inc. (Heidelberg, Germany). DOPC, bovine heart CL, rotenone, asolectin, EggPC, antimycin A, bovine Cyt c, CCCP, and HAR were purchased from Sigma. Bovine heart total lipid extract was purchased from Avanti Polar Lipids (Alabaster, AL). O. aries (sheep) hearts were purchased from C Humphreys & Sons (Chelmsford, UK).
Preparation of Mitochondria
Mitochondria were isolated from ovine heart tissue according to procedure 3 of Smith (71) and stored at −80 °C. Before protein extraction, the frozen mitochondria were thawed on ice and washed by resuspension to a final concentration of ∼6 mg of protein/ml by manual homogenization in MilliQ (18 megohms) water to which KCl was added to a final concentration of 150 mm. Next, the membranes were pelleted by centrifugation at 32,000 × g for 45 min, followed by a second wash by resuspension in buffer M (20 mm Tris-HCl, pH 7.4, 50 mm NaCl, 1 mm EDTA, 10% v/v glycerol, 2 mm DTT, and 0.005% PMSF) by manual homogenization to a concentration of ∼4 mg of protein/ml and centrifuged again as above. Finally, membranes were resuspended in buffer M at ∼10 mg of protein/ml and either refrozen for storage at −80 °C or used directly for preparation of complex I.
Lipid Preparation
Buffers containing lipids were prepared using the protocol of Heginbotham et al. (72) with modifications. Briefly, powdered lipid was prepared by dissolving the desired amount of lipid at ∼10 mg/ml in chloroform in a glass test tube. For lipids provided in solution, the desired volume was added to a glass test tube. Solvent was removed by evaporation under a stream of N2 until the lipids were dried to the surface of the glass followed by an additional 10 min under the N2 stream to ensure complete removal of solvent. The lipid was further washed by addition of pentane to a final concentration of ∼20 mg/ml lipid, followed by evaporation under a stream of N2 while spinning the tube by hand nearly horizontally, resulting in a very thin layer of lipid over the surface of the glass, followed by an additional 10 min under the N2 stream to ensure complete removal of pentane. The lipids were then dissolved in detergent solution (5–10% (w/v) DDM, 5% (w/v) LMNG, or 2% CHAPS) in MilliQ water at a final concentration of 5–20 mg/ml by several minutes of continuous vortexing. This detergent/lipid mixture was then added to buffers for the desired final concentration of lipid and detergent.
DDM Purification
Initial purification of complex I from washed mitochondrial membranes was performed similarly to what has been reported for the bovine enzyme (38) consisting of two anion-exchange steps followed by SEC. However, optimization of the elution gradient profile for the first anion-exchange step allowed us to omit the second anion-exchange step and still achieve sufficient sample purity. This leads to a protocol more similar to that of Sharpley et al. (39) consisting of a single anion-exchange step and size exclusion chromatography. In short, 10% (w/v) DDM was added to the washed mitochondrial membranes dropwise to a final concentration of 1% DDM, followed by stirring for ∼30 min at 4 °C and centrifugation at 48,000 × g for 45 min. The supernatant was filtered (0.45 μm pore size polyethersulfone) and loaded onto a pre-equilibrated 45-ml Q-Sepharose HP anion-exchange column (GE Healthcare, UK). The Q-Sepharose buffers (A and B) contained 20 mm Tris-HCl, pH 7.4, 10% (v/v) glycerol, 1 mm EDTA, 1 mm DTT, 0.1 mg/ml DOPC, and 0.1% DDM; additionally, buffer B contained 1 m NaCl; the Q-Sepharose column was pre-equilibrated at 5% buffer B in buffer A. After application of the mitochondrial extract, the Q-Sepharose column was washed with 25 ml of 5% buffer B, then with a 25-ml linear gradient of 5–23%, and finally with 150 ml of 23% buffer B. Complex I was then eluted with a 200-ml linear gradient of 23–30% buffer B (Fig. 1A). Any remaining protein was then eluted with 100% buffer B. The Q-Sepharose gradient was run overnight at 1.0 ml/min at 4 °C. Complex I containing fractions were pooled based on NADH/FeCy activity (see assay details below) and concentrated to 1.5–2.0 ml. This sample was then loaded onto a custom-poured Superose 6 SEC column (16/100 cm) equilibrated in buffer SD (20 mm HEPES, pH 7.4, 2 mm EDTA, 10% glycerol, 50 mm NaCl, 0.1 mg/ml 4:1 DOPC/CL and 0.05% DDM). Complex I was eluted overnight at 0.35 ml/min at 4 °C. For small-scale detergent exchange experiments, aliquots of complex I were run over a Superose 6 10/30 SEC column equilibrated in buffer SD containing the desired detergent at 0.05% (w/v).
Subcomplex Preparation
Purified complex I was treated with 1% LDAO followed by purification of subcomplexes on a Mono Q anion-exchange column as described previously (38) with minor modifications. After initial optimization runs, two experiments were performed with different pre-incubation times in 1% LDAO of 4 h (experiment 1) versus 1 h (experiment 2). Isolated subcomplexes from each experiment were concentrated and run over a Superose 6 SEC column equilibrated in 50 mm NaCl, 20 mm HEPES, pH 7.4, 2 mm EDTA, and 0.05% DDM buffer to remove the LDAO. Each subcomplex peak was pooled and concentrated. A sample of each subcomplex was run on SDS-polyacrylamide gels and stained with Coomassie, and the gel shown in Fig. 2 is from experiment 2. Gel slices were cut out and sent for protein identification by mass spectrometry. In experiment 2, gel slices were cut out only where Coomassie-stained protein bands were visible (IλO 18 slices, Iβ 20 slices, and Iγ 13 slices), whereas in experiment 1 each subcomplex lane was cut into 31 approximately even slices from the bottom of the gel to the 150-kDa molecular mass marker for completeness. Results from both experiments are presented in Table 4. Protein band assignment shown in Fig. 2B was determined by total peptide spectrum counts from the gel slices in experiment 1 and corroborated by the MS results from experiment 2.
Mass Spectrometry
Polyacrylamide gel slices (1–2 mm) containing bands of the purified proteins were prepared for mass spectrometric analysis by manual in situ enzymatic digestion. Briefly, the excised protein gel pieces were placed in a well of a 96-well microtiter plate and destained with 50% (v/v) acetonitrile and 50 mm ammonium bicarbonate, reduced with 10 mm DTT, and alkylated with 55 mm iodoacetamide. After alkylation, proteins were digested with 6 ng/μl trypsin (Promega, UK) overnight at 37 °C. The resulting peptides were extracted in 2% (v/v) formic acid, 2% (v/v) acetonitrile. The digest was analyzed by nano-scale capillary LC-MS/MS using an Ultimate U3000 HPLC (ThermoScientific Dionex, San Jose, CA) to deliver a flow of ∼300 nl/min. A C18 Acclaim PepMap100 5 μm, 100 μm × 20-mm nanoViper (ThermoScientific Dionex) trapped the peptides prior to separation on a C18 Acclaim PepMap100 3 μm, 75 μm × 250 mm nanoViper (ThermoScientific Dionex). Peptides were eluted with a gradient of acetonitrile. The analytical column outlet was directly interfaced via a nano-flow electrospray ionization source, with a hybrid dual pressure linear ion trap mass spectrometer (Orbitrap Velos, ThermoScientific). Data-dependent analysis was carried out, using a resolution of 30,000 for the full MS spectrum, followed by 10 MS/MS spectra in the linear ion trap. MS spectra were collected over a m/z range of 300–2000. MS/MS scans were collected using the threshold energy of 35 for collision-induced dissociation. LC-MS/MS data were then searched against a protein database (mammalian subset of UniProt KB) using the Mascot search engine program (Matrix Science, UK) (73). Database search parameters were set with a precursor tolerance of 10 ppm and a fragment ion mass tolerance of 0.8 Da. One missed enzyme cleavage was allowed, and variable modifications for oxidized methionine and carbamidomethyl cysteine were included. MS/MS data were validated using the Scaffold program (Proteome Software Inc.) (74). All data were additionally interrogated manually.
Activity Measurements
Purified complex I activity was measured by spectroscopic observation of NADH oxidation at 340 nm wavelength using a Shimadzu UV-2600 UV-visible spectrophotometer with CPS-100 thermoelectrically temperature-controlled cell positioner and modified by Rank Brothers Ltd. for continuous sample stirring. All activity measurements were performed at 30 °C with 100 μm NADH and 200 μm DQ or 1 mm potassium ferricyanide (KFeCy). The standard reaction buffer AB (20 mm HEPES, pH 7.4, 100 mm NaCl, 10% glycerol, 1.0 mg/ml BSA, 0.1% CHAPS, 0.25 mg/ml lipid) was used for measuring NADH/DQ activity of purified complex I (unless otherwise indicated). For NADH/DQ activity of mitochondrial membranes, buffer AB was used containing 10 μm CCCP and 400 μm KCN (unless otherwise indicated). All values of DQ activity reported are corrected by subtraction of residual activity in the presence of the complex I inhibitor rotenone (2.5 μm) under each condition (unless otherwise indicated). The buffer used for NADH/FeCy activity was 20 mm HEPES, pH 7.4, 50 mm NaCl, 2 mm EDTA, 0.1% DDM, and 1 mm KFeCy. The same buffer was used for determining the NADH/HAR activity except with 1 mm HAR instead of KFeCy. All protein concentrations were determined with the bicinchoninic acid (BCA, Pierce) assay kit using BSA standards (Thermo Fisher, Waltham, MA); all samples were diluted at least 10-fold into 20 mm HEPES, pH 7.4, 0.1% DDM, and 50 mm NaCl buffer to reduce interference from glycerol in the sample buffers. p values were calculated using a two-tailed Student's t test for independent samples.
LMNG Purification
Complex I purification in LMNG was performed similarly to purification in DDM described above, and it consisted of a single anion-exchange step followed by SEC, with modified buffers and gradients. In short, 5% (w/v) LMNG was added to the washed mitochondrial membranes dropwise to a final concentration of 1% LMNG, followed by stirring for ∼30 min at 4 °C and centrifugation at 48,000 × g for 45 min. The supernatant was filtered (0.45 μm pore size polyethersulfone) and loaded onto a pre-equilibrated 45 ml Q-Sepharose HP anion-exchange column (GE Healthcare). The Q-Sepharose buffers (AL and BL) contained 20 mm Tris-HCl, pH 7.4, 10% (v/v) glycerol, 1 mm EDTA, 1 mm DTT, 0.1 mg/ml DOPC, and 0.04% LMNG; additionally, buffer B contained 1 m NaCl; the Q-Sepharose column was pre-equilibrated at 5% buffer B in buffer A. After application of the mitochondrial extract, the Q-Sepharose column was washed with 50 ml of 5% buffer BL, then with a 30-ml linear gradient of 5–22%, and finally with 150 ml of 22% buffer BL. Complex I was then eluted with a 300-ml linear gradient of 22–30.5% buffer BL (Fig. 4A). Any remaining protein was then eluted with 100% buffer BL. The Q-Sepharose gradient was run overnight at 1.0 ml/min at 4 °C. Complex I containing fractions were pooled based on NADH/FeCy activity and concentrated to 1.5–2.0 ml. This sample was then loaded onto a custom-poured Superose 6 SEC column (16/100) equilibrated in buffer SL (20 mm HEPES, pH 7.4, 2 mm EDTA, 10% glycerol, 50 mm NaCl, 0.1 mg/ml 4:1 DOPC/CL, and 0.05% LMNG). Complex I was eluted overnight at 0.35 ml/min at 4 °C (Fig. 4B). For small-scale detergent exchange and stability experiments, complex I was run over a Superose 6 10/30 SEC column equilibrated in buffer S containing the desired detergent at 0.05% (w/v).
Organic Phosphate Assay
Measurement of organic phosphate content was performed according to the protocol of Anderson and Davis (55) without modification. Lipid was extracted from protein samples (∼20 μl) by addition of 200 μl of 2:1 chloroform/MeOH followed by vortexing. Then, 50 μl of 125 mm NaCl was added, and the samples were vortexed again. The phases were separated by centrifugation for 3 min at ∼13,000 × g, and the lower chloroform phase was used for measurement.
Author Contributions
J. A. L. developed the purification protocols for ovine complex I, prepared subcomplex samples, preformed the activity assays, aided with sequence alignments and mass spectrometry analysis, and co-wrote the manuscript. G. D. performed mass spectrometry experiments and analysis, aided with ovine complex I sequence determination, and revised the manuscript. K. F. performed initial purifications of ovine complex I, performed initial database searches and alignments of ovine complex I sequences, and aided with LMNG purifications. M. S. supervised the mass spectrometry experiments, aided with analysis and interpretation of the results, and revised the manuscript. L. A. S. designed and supervised the project, analyzed data, and co-wrote the manuscript.
This work was supported in part by European Union's 2020 Research and Innovation Program under Grant 701309. The authors declare that they have no conflicts of interest with the contents of this article.
- OXPHOS
- oxidative phosphorylation
- ETC
- electron transport chain
- IMM
- inner mitochondrial membrane
- cryo-EM
- electron cryo-microscopy
- Q
- coenzyme Q
- DM
- decyl maltoside
- UDM
- undecyl maltoside
- DDM
- dodecyl maltoside
- TDM
- tridecyl maltoside
- LDAO
- lauryldimethylamine-N-oxide
- trans-PCCαM
- 4-trans-(4-trans-propylcyclohexyl)cyclohexyl α-maltoside
- CYMAL-5
- 5-cyclohexyl-1-pentyl-β-d-maltoside
- CYMAL-6
- 6-cyclohexyl-1-hexyl-β-d-maltoside
- CYMAL-7
- 7-cyclohexyl-1-heptyl-β-d-maltoside
- ANAPOE C10E9
- polyoxyethylene(9)decyl ether
- ANAPOE C10E8
- polyoxyethylene(8)dodecyl ether
- Brij 35
- polyethyleneglycol(23)monododecyl ether
- DMNG
- decyl maltose neopentyl glycol
- LMNG
- lauryl maltose neopentyl glycol
- GDN
- glycol-diosgenin
- DHPC
- 1,2-dihexanoyl-sn-glycero-3-phosphocholine
- DQ
- decyl-ubiquinone
- SMP
- submitochondrial particles
- Q1
- ubiquinone-1
- DOPC
- 1,2-dioleoyl-sn-glycerol-3-phosphocholine
- CL
- bovine heart cardiolipin
- EggPC
- l-phosphatidylcholine from egg yolk
- Cyt c
- cytochrome c
- FeCy
- ferricyanide
- CCCP
- carbonyl cyanide m-chlorophenyl hydrazone
- HAR
- hexaammineruthenium III
- SEC
- size exclusion chromatography
- PC
- phosphatidylcholine
- POE
- polyoxyethylene.
References
- 1. Rich P. R., and Maréchal A. (2010) The mitochondrial respiratory chain. Essays Biochem. 47, 1–23 [DOI] [PubMed] [Google Scholar]
- 2. Sazanov L. A. (2015) A giant molecular proton pump: structure and mechanism of respiratory complex I. Nat. Rev. Mol. Cell Biol. 16, 375–388 [DOI] [PubMed] [Google Scholar]
- 3. Hirst J. (2013) Mitochondrial complex I. Annu. Rev. Biochem. 82, 551–575 [DOI] [PubMed] [Google Scholar]
- 4. Walker J. E. (1992) The NADH:ubiquinone oxidoreductase (complex I) of respiratory chains. Q. Rev. Biophys. 25, 253–324 [DOI] [PubMed] [Google Scholar]
- 5. Brandt U. (2006) Energy converting NADH:quinone oxidoreductase (complex I). Annu. Rev. Biochem. 75, 69–92 [DOI] [PubMed] [Google Scholar]
- 6. Iwata S., Lee J. W., Okada K., Lee J. K., Iwata M., Rasmussen B., Link T. A., Ramaswamy S., and Jap B. K. (1998) Complete structure of the 11-subunit bovine mitochondrial cytochrome bc1 complex. Science 281, 64–71 [DOI] [PubMed] [Google Scholar]
- 7. Sun F., Huo X., Zhai Y., Wang A., Xu J., Su D., Bartlam M., and Rao Z. (2005) Crystal structure of mitochondrial respiratory membrane protein complex II. Cell 121, 1043–1057 [DOI] [PubMed] [Google Scholar]
- 8. Tsukihara T., Aoyama H., Yamashita E., Tomizaki T., Yamaguchi H., Shinzawa-Itoh K., Nakashima R., Yaono R., and Yoshikawa S. (1996) The whole structure of the 13-subunit oxidized cytochrome c oxidase at 2.8 A. Science 272, 1136–1144 [DOI] [PubMed] [Google Scholar]
- 9. Yoshikawa S., Shinzawa-Itoh K., Nakashima R., Yaono R., Yamashita E., Inoue N., Yao M., Fei M. J., Libeu C. P., Mizushima T., Yamaguchi H., Tomizaki T., and Tsukihara T. (1998) Redox-coupled crystal structural changes in bovine heart cytochrome c oxidase. Science 280, 1723–1729 [DOI] [PubMed] [Google Scholar]
- 10. Zhou A., Rohou A., Schep D. G., Bason J. V., Montgomery M. G., Walker J. E., Grigorieff N., and Rubinstein J. L. (2015) Structure and conformational states of the bovine mitochondrial ATP synthase by cryo-EM. Elife 4, e10180. [DOI] [PMC free article] [PubMed] [Google Scholar]
- 11. Vinothkumar K. R., Zhu J., and Hirst J. (2014) Architecture of mammalian respiratory complex I. Nature 515, 80–84 [DOI] [PMC free article] [PubMed] [Google Scholar]
- 12. Allegretti M., Klusch N., Mills D. J., Vonck J., Kühlbrandt W., and Davies K. M. (2015) Horizontal membrane-intrinsic α-helices in the stator a-subunit of an F-type ATP synthase. Nature 521, 237–240 [DOI] [PubMed] [Google Scholar]
- 13. Morales-Rios E., Montgomery M. G., Leslie A. G., and Walker J. E. (2015) Structure of ATP synthase from Paracoccus denitrificans determined by X-ray crystallography at 4.0 Å resolution. Proc. Natl. Acad. Sci. U.S.A. 112, 13231–13236 [DOI] [PMC free article] [PubMed] [Google Scholar]
- 14. Zhu J., Vinothkumar K. R., and Hirst J. (2016) Structure of mammalian respiratory complex I. Nature 536, 354–358 [DOI] [PMC free article] [PubMed] [Google Scholar]
- 15. Letts J. A., and Sazanov L. A. (2015) Gaining mass: the structure of respiratory complex I–from bacterial towards mitochondrial versions. Curr. Opin. Struct. Biol. 33, 135–145 [DOI] [PubMed] [Google Scholar]
- 16. Walker J. E. (2013) The ATP synthase: the understood, the uncertain and the unknown. Biochem. Soc. Trans. 41, 1–16 [DOI] [PubMed] [Google Scholar]
- 17. Hinchliffe P., and Sazanov L. A. (2005) Organization of iron-sulfur clusters in respiratory complex I. Science 309, 771–774 [DOI] [PubMed] [Google Scholar]
- 18. Sazanov L. A., and Hinchliffe P. (2006) Structure of the hydrophilic domain of respiratory complex I from Thermus thermophilus. Science 311, 1430–1436 [DOI] [PubMed] [Google Scholar]
- 19. Efremov R. G., Baradaran R., and Sazanov L. A. (2010) The architecture of respiratory complex I. Nature 465, 441–445 [DOI] [PubMed] [Google Scholar]
- 20. Efremov R. G., and Sazanov L. A. (2011) Structure of the membrane domain of respiratory complex I. Nature 476, 414–420 [DOI] [PubMed] [Google Scholar]
- 21. Baradaran R., Berrisford J. M., Minhas G. S., and Sazanov L. A. (2013) Crystal structure of the entire respiratory complex I. Nature 494, 443–448 [DOI] [PMC free article] [PubMed] [Google Scholar]
- 22. Zickermann V., Wirth C., Nasiri H., Siegmund K., Schwalbe H., Hunte C., and Brandt U. (2015) Mechanistic insight from the crystal structure of mitochondrial complex I. Science 347, 44–49 [DOI] [PubMed] [Google Scholar]
- 23. Angerer H., Zwicker K., Wumaier Z., Sokolova L., Heide H., Steger M., Kaiser S., Nübel E., Brutschy B., Radermacher M., Brandt U., and Zickermann V. (2011) A scaffold of accessory subunits links the peripheral arm and the distal proton-pumping module of mitochondrial complex I. Biochem. J. 437, 279–288 [DOI] [PMC free article] [PubMed] [Google Scholar]
- 24. Zhu J., King M. S., Yu M., Klipcan L., Leslie A. G., and Hirst J. (2015) Structure of subcomplex Iβ of mammalian respiratory complex I leads to new supernumerary subunit assignments. Proc. Natl. Acad. Sci. U.S.A. 112, 12087–12092 [DOI] [PMC free article] [PubMed] [Google Scholar]
- 25. Fiedorczuk K., Letts J. A., Degliesposti G., Kaszuba K., Skehel M., and Sazanov L. A. (2016) Accelerated article preview. Nature 10.1038/nature19794 [DOI] [PMC free article] [PubMed] [Google Scholar]
- 26. Lewinson O., Lee A. T., and Rees D. C. (2008) The funnel approach to the precrystallization production of membrane proteins. J. Mol. Biol. 377, 62–73 [DOI] [PMC free article] [PubMed] [Google Scholar]
- 27. Kawate T., and Gouaux E. (2006) Fluorescence-detection size exclusion chromatography for precrystallization screening of integral membrane proteins. Structure 14, 673–681 [DOI] [PubMed] [Google Scholar]
- 28. Teng S., Madej T., Panchenko A., and Alexov E. (2009) Modeling effects of human single nucleotide polymorphisms on protein-protein interactions. Biophys. J. 96, 2178–2188 [DOI] [PMC free article] [PubMed] [Google Scholar]
- 29. Stevens T. J., and Arkin I. T. (2001) Substitution rates in α-helical transmembrane proteins. Protein Sci. 10, 2507–2517 [DOI] [PMC free article] [PubMed] [Google Scholar]
- 30. Brown W. M., George M. Jr., and Wilson A. C. (1979) Rapid evolution of animal mitochondrial DNA. Proc. Natl. Acad. Sci. U.S.A. 76, 1967–1971 [DOI] [PMC free article] [PubMed] [Google Scholar]
- 31. Meadows J. R., Hiendleder S., and Kijas J. W. (2011) Haplogroup relationships between domestic and wild sheep resolved using a mitogenome panel. Heredity 106, 700–706 [DOI] [PMC free article] [PubMed] [Google Scholar]
- 32. Mariotti M., Valentini A., Marsan P. A., and Pariset L. (2013) Mitochondrial DNA of seven Italian sheep breeds shows faint signatures of domestication and suggests recent breed formation. Mitochondrial DNA 24, 577–583 [DOI] [PubMed] [Google Scholar]
- 33. Hiendleder S. (1998) A low rate of replacement substitutions in two major Ovis aries mitochondrial genomes. Anim. Genet. 29, 116–122 [DOI] [PubMed] [Google Scholar]
- 34. Hiendleder S., Mainz K., Plante Y., and Lewalski H. (1998) Analysis of mitochondrial DNA indicates that domestic sheep are derived from two different ancestral maternal sources: no evidence for contributions from urial and argali sheep. J. Hered. 89, 113–120 [DOI] [PubMed] [Google Scholar]
- 35. Hiendleder S., Lewalski H., Wassmuth R., and Janke A. (1998) The complete mitochondrial DNA sequence of the domestic sheep (Ovis aries) and comparison with the other major ovine haplotype. J. Mol. Evol. 47, 441–448 [DOI] [PubMed] [Google Scholar]
- 36. Yang C., Li L., Zhong T., Wang L., and Zhang H. (2016) Characterization of the complete mitochondrial genome sequence of Ujumuqin sheep (Ovis aries). Mitochondrial DNA. 10.3109/19401736.2015.1122761 [DOI] [PubMed] [Google Scholar]
- 37. Kmita K., and Zickermann V. (2013) Accessory subunits of mitochondrial complex I. Biochem. Soc. Trans. 41, 1272–1279 [DOI] [PubMed] [Google Scholar]
- 38. Sazanov L. A., Peak-Chew S. Y., Fearnley I. M., and Walker J. E. (2000) Resolution of the membrane domain of bovine complex I into subcomplexes: implications for the structural organization of the enzyme. Biochemistry 39, 7229–7235 [DOI] [PubMed] [Google Scholar]
- 39. Sharpley M. S., Shannon R. J., Draghi F., and Hirst J. (2006) Interactions between phospholipids and NADH:ubiquinone oxidoreductase (complex I) from bovine mitochondria. Biochemistry 45, 241–248 [DOI] [PubMed] [Google Scholar]
- 40. Finel M., Skehel J. M., Albracht S. P., Fearnley I. M., and Walker J. E. (1992) Resolution of NADH:ubiquinone oxidoreductase from bovine heart mitochondria into two subcomplexes, one of which contains the redox centers of the enzyme. Biochemistry 31, 11425–11434 [DOI] [PubMed] [Google Scholar]
- 41. Hirst J., Carroll J., Fearnley I. M., Shannon R. J., and Walker J. E. (2003) The nucleus-encoded subunits of complex I from bovine heart mitochondria. BBA-Bioenergetics 1604, 135–150 [DOI] [PubMed] [Google Scholar]
- 42. Walker J. E., Skehel J. M., and Buchanan S. K. (1995) Structural analysis of NADH:ubiquinone oxidoreductase from bovine heart mitochondria. Methods Enzymol. 260, 14–34 [DOI] [PubMed] [Google Scholar]
- 43. Fearnley I. M., Carroll J., Shannon R. J., Runswick M. J., Walker J. E., and Hirst J. (2001) GRIM-19, a cell death regulatory gene product, is a subunit of bovine mitochondrial NADH:ubiquinone oxidoreductase (complex I). J. Biol. Chem. 276, 38345–38348 [DOI] [PubMed] [Google Scholar]
- 44. Sazanov L. A., and Walker J. E. (2000) Cryo-electron crystallography of two sub-complexes of bovine complex I reveals the relationship between the membrane and peripheral arms. J. Mol. Biol. 302, 455–464 [DOI] [PubMed] [Google Scholar]
- 45. Pryde K. R., and Hirst J. (2011) Superoxide is produced by the reduced flavin in mitochondrial complex I: a single, unified mechanism that applies during both forward and reverse electron transfer. J. Biol. Chem. 286, 18056–18065 [DOI] [PMC free article] [PubMed] [Google Scholar]
- 46. Schägger H., and Pfeiffer K. (2000) Supercomplexes in the respiratory chains of yeast and mammalian mitochondria. EMBO J. 19, 1777–1783 [DOI] [PMC free article] [PubMed] [Google Scholar]
- 47. Privé G. G. (2007) Detergents for the stabilization and crystallization of membrane proteins. Methods 41, 388–397 [DOI] [PubMed] [Google Scholar]
- 48. Okun J. G., Zickermann V., Zwicker K., Schägger H., and Brandt U. (2000) Binding of detergents and inhibitors to bovine complex I–a novel purification procedure for bovine complex I retaining full inhibitor sensitivity. BBA-Bioenergetics 1459, 77–87 [DOI] [PubMed] [Google Scholar]
- 49. Chae P. S., Rasmussen S. G., Rana R. R., Gotfryd K., Chandra R., Goren M. A., Kruse A. C., Nurva S., Loland C. J., Pierre Y., Drew D., Popot J. L., Picot D., Fox B. G., Guan L., et al. (2010) Maltose-neopentyl glycol (MNG) amphiphiles for solubilization, stabilization and crystallization of membrane proteins. Nat. Methods 7, 1003–1008 [DOI] [PMC free article] [PubMed] [Google Scholar]
- 50. Chae P. S., Rasmussen S. G., Rana R. R., Gotfryd K., Kruse A. C., Manglik A., Cho K. H., Nurva S., Gether U., Guan L., Loland C. J., Byrne B., Kobilka B. K., and Gellman S. H. (2012) A new class of amphiphiles bearing rigid hydrophobic groups for solubilization and stabilization of membrane proteins. Chem. Eur. J. 18, 9485–9490 [DOI] [PMC free article] [PubMed] [Google Scholar]
- 51. Birrell J. A., King M. S., and Hirst J. (2011) A ternary mechanism for NADH oxidation by positively charged electron acceptors, catalyzed at the flavin site in respiratory complex I. FEBS Lett. 585, 2318–2322 [DOI] [PubMed] [Google Scholar]
- 52. Fato R., Estornell E., Di Bernardo S., Pallotti F., Parenti Castelli G., and Lenaz G. (1996) Steady-state kinetics of the reduction of coenzyme Q analogs by complex I (NADH:ubiquinone oxidoreductase) in bovine heart mitochondria and submitochondrial particles. Biochemistry 35, 2705–2716 [DOI] [PubMed] [Google Scholar]
- 53. Grivennikova V. G., Kapustin A. N., and Vinogradov A. D. (2001) Catalytic activity of NADH-ubiquinone oxidoreductase (complex I) in intact mitochondria. evidence for the slow active/inactive transition. J. Biol. Chem. 276, 9038–9044 [DOI] [PubMed] [Google Scholar]
- 54. Vinogradov A. D., and Grivennikova V. G. (2016) Oxidation of NADH and ROS production by respiratory complex I. BBA-Bioenergetics 1857, 863–871 [DOI] [PubMed] [Google Scholar]
- 55. Anderson R. L., and Davis S. (1982) An organic phosphorus assay which avoids the use of hazardous perchloric acid. Clin. Chim. Acta 121, 111–116 [DOI] [PubMed] [Google Scholar]
- 56. Shinzawa-Itoh K., Seiyama J., Terada H., Nakatsubo R., Naoki K., Nakashima Y., and Yoshikawa S. (2010) Bovine heart NADH-ubiquinone oxidoreductase contains one molecule of ubiquinone with ten isoprene units as one of the cofactors. Biochemistry 49, 487–492 [DOI] [PubMed] [Google Scholar]
- 57. White J. F., Noinaj N., Shibata Y., Love J., Kloss B., Xu F., Gvozdenovic-Jeremic J., Shah P., Shiloach J., Tate C. G., and Grisshammer R. (2012) Structure of the agonist-bound neurotensin receptor. Nature 490, 508–513 [DOI] [PMC free article] [PubMed] [Google Scholar]
- 58. Birrell J. A., Yakovlev G., and Hirst J. (2009) Reactions of the flavin mononucleotide in complex I: a combined mechanism describes NADH oxidation coupled to the reduction of APAD+, ferricyanide, or molecular oxygen. Biochemistry 48, 12005–12013 [DOI] [PubMed] [Google Scholar]
- 59. Estornell E., Fato R., Pallotti F., and Lenaz G. (1993) Assay conditions for the mitochondrial NADH:coenzyme Q oxidoreductase. FEBS Lett. 332, 127–131 [DOI] [PubMed] [Google Scholar]
- 60. Shinkarev V. P., and Wraight C. A. (1997) The interaction of quinone and detergent with reaction centers of purple bacteria. I. Slow quinone exchange between reaction center micelles and pure detergent micelles. Biophys. J. 72, 2304–2319 [DOI] [PMC free article] [PubMed] [Google Scholar]
- 61. Kotlyar A. B., and Vinogradov A. D. (1990) Slow active/inactive transition of the mitochondrial NADH-ubiquinone reductase. BBA-Bioenergetics 1019, 151–158 [DOI] [PubMed] [Google Scholar]
- 62. Vinogradov A. D. (1998) Catalytic properties of the mitochondrial NADH-ubiquinone oxidoreductase (complex I) and the pseudo-reversible active/inactive enzyme transition. BBA-Bioenergetics 1364, 169–185 [DOI] [PubMed] [Google Scholar]
- 63. Kotlyar A. B., Sled V. D., and Vinogradov A. D. (1992) Effect of Ca2+ ions on the slow active/inactive transition of the mitochondrial NADH-ubiquinone reductase. BBA-Bioenergetics 1098, 144–150 [DOI] [PubMed] [Google Scholar]
- 64. Maklashina E., Kotlyar A. B., and Cecchini G. (2003) Active/de-active transition of respiratory complex I in bacteria, fungi, and animals. BBA-Bioenergetics 1606, 95–103 [DOI] [PubMed] [Google Scholar]
- 65. Murai M., and Miyoshi H. (2016) Current topics on inhibitors of respiratory complex I. BBA-Bioenergetics 1857, 884–891 [DOI] [PubMed] [Google Scholar]
- 66. Degli Esposti M., Ghelli A., Ratta M., Cortes D., and Estornell E. (1994) Natural substances (acetogenins) from the family Annonaceae are powerful inhibitors of mitochondrial NADH dehydrogenase (Complex I). Biochem. J. 301, 161–167 [DOI] [PMC free article] [PubMed] [Google Scholar]
- 67. Hatefi Y., and Stiggall D. L. (1978) Preparation and properties of NADH:cytochrome c oxidoreductase (complex I–III). Methods Enzymol. 53, 5–10 [DOI] [PubMed] [Google Scholar]
- 68. Hatefi Y. (1978) Preparation and properties of NADH:ubiquinone oxidoreductase (complex I). Methods Enzymol. 53, 11–14 [DOI] [PubMed] [Google Scholar]
- 69. Yamaguchi M., Belogrudov G. I., and Hatefi Y. (1998) Mitochondrial NADH-ubiquinone oxidoreductase (Complex I). Effect of substrates on the fragmentation of subunits by trypsin. J. Biol. Chem. 273, 8094–8098 [DOI] [PubMed] [Google Scholar]
- 70. Hauer F., Gerle C., Fischer N., Oshima A., Shinzawa-Itoh K., Shimada S., Yokoyama K., Fujiyoshi Y., and Stark H. (2015) GraDeR: membrane protein complex preparation for single-particle Cryo-EM. Structure 23, 1769–1775 [DOI] [PubMed] [Google Scholar]
- 71. Smith A. L. (1967) Preparation, properties, and conditions for assay of mitochondria: slaughterhouse material, small-scale. Methods Enzymol. 10, 81–86 [Google Scholar]
- 72. Heginbotham L., Kolmakova-Partensky L., and Miller C. (1998) Functional reconstitution of a prokaryotic K+ channel. J. Gen. Physiol. 111, 741–749 [DOI] [PMC free article] [PubMed] [Google Scholar]
- 73. Perkins D. N., Pappin D. J., Creasy D. M., and Cottrell J. S. (1999) Probability-based protein identification by searching sequence databases using mass spectrometry data. Electrophoresis 20, 3551–3567 [DOI] [PubMed] [Google Scholar]
- 74. Keller A., Nesvizhskii A. I., Kolker E., and Aebersold R. (2002) Empirical statistical model to estimate the accuracy of peptide identifications made by MS/MS and database search. Anal. Chem. 74, 5383–5392 [DOI] [PubMed] [Google Scholar]
- 75. Uenishi H., Eguchi T., Suzuki K., Sawazaki T., Toki D., Shinkai H., Okumura N., Hamasima N., and Awata T. (2004) PEDE (Pig EST Data Explorer): construction of a database for ESTs derived from porcine full-length cDNA libraries. Nucleic Acids Res. 32, D484–D488 [DOI] [PMC free article] [PubMed] [Google Scholar]
- 76. de Coo R. F., Buddiger P., Smeets H. J., and van Oost B. A. (1997) Molecular cloning and characterization of the human mitochondrial NADH: oxidoreductase 10-kDa gene (NDUFV3). Genomics 45, 434–437 [DOI] [PubMed] [Google Scholar]
- 77. Skehel J. M., Pilkington S. J., Runswick M. J., Fearnley I. M., and Walker J. E. (1991) NADH:ubiquinone oxidoreductase from bovine heart mitochondria. Complementary DNA sequence of the import precursor of the 10-kDa subunit of the flavoprotein fragment. FEBS Lett. 282, 135–138 [DOI] [PubMed] [Google Scholar]
- 78. International Sheep Genomics Consortium, Archibald A. L., Cockett N. E., Dalrymple B. P., Faraut T., Kijas J. W., Maddox J. F., McEwan J. C., Hutton Oddy V., Raadsma H. W., Wade C., Wang J., Wang W., and Xun X. (2010) The sheep genome reference sequence: a work in progress. Anim. Genet. 41, 449–453 [DOI] [PubMed] [Google Scholar]
- 79. Ye R. S., Pan H. B., Yin G. F., Huang Y., Zhao S. M., and Gao S. Z. (2012) Molecular characterization and tissue expression profile of three novel ovine genes: ATP5O, NDUFA12 and UQCRH from muscle full-length cDNA library of black-boned sheep. Mol. Biol. Rep. 39, 5767–5774 [DOI] [PubMed] [Google Scholar]
- 80. Ishihama Y., Oda Y., Tabata T., Sato T., Nagasu T., Rappsilber J., and Mann M. (2005) Exponentially modified protein abundance index (emPAI) for estimation of absolute protein amount in proteomics by the number of sequenced peptides per protein. Mol. Cell. Proteomics 4, 1265–1272 [DOI] [PubMed] [Google Scholar]