

Abstract
AIM
To investigate the diagnostic ability of a non-invasive biological marker to predict liver fibrosis in hepatitis C genotype 4 patients with high accuracy.
METHODS
A cohort of 332 patients infected with hepatitis C genotype 4 was included in this cross-sectional study. Fasting plasma glucose, insulin, C-peptide, and angiotensin-converting enzyme serum levels were measured. Insulin resistance was mathematically calculated using the homeostasis model of insulin resistance (HOMA-IR).
RESULTS
Fibrosis stages were distributed based on Metavir score as follows: F0 = 43, F1 = 136, F2 = 64, F3 = 45 and F4 = 44. Statistical analysis relied upon reclassification of fibrosis stages into mild fibrosis (F0-F) = 179, moderate fibrosis (F2) = 64, and advanced fibrosis (F3-F4) = 89. Univariate analysis indicated that age, log aspartate amino transaminase, log HOMA-IR and log platelet count were independent predictors of liver fibrosis stage (P < 0.0001). A stepwise multivariate discriminant functional analysis was used to drive a discriminative model for liver fibrosis. Our index used cut-off values of ≥ 0.86 and ≤ -0.31 to diagnose advanced and mild fibrosis, respectively, with receiving operating characteristics of 0.91 and 0.88, respectively. The sensitivity, specificity, positive predictive value, negative predictive value and positive likelihood ratio were: 73%, 91%, 75%, 90% and 8.0 respectively for advanced fibrosis, and 67%, 88%, 84%, 70% and 4.9, respectively, for mild fibrosis.
CONCLUSION
Our predictive model is easily available and reproducible, and predicted liver fibrosis with acceptable accuracy.
Keywords: Liver fibrosis, Insulin resistance, Aspartate amino transaminase, Platelets, Age
Core tip: This observational study included a cohort of 332 recruited patients with hepatitis C virus (HCV) genotype 4 infections. The study assessed the status of demographic and biological variables at different stages of liver fibrosis. Liver biopsy with Metavir scoring was the reference standard used to classify patients into five stages of liver fibrosis (F0-F4). Patient regrouping to include three levels of fibrosis, mild (F0-F1), moderate (F2), and advanced (F3-F4), was performed to conform with practical guidelines for the management and follow-up of HCV patients. Age, aspartate transaminase enzyme (AST), insulin resistance (HOMA-IR), and platelet count were significant predictors of liver fibrosis as shown on univariate analysis. Log AST, log HOMA-IR, log platelet count and age were introduced into stepwise multivariate discriminative analysis, and a model for the prediction of liver fibrosis level was derived. Our predictive index exhibited an area under the curve (AUC) of 0.91 for the diagnosis of advanced stages of fibrosis and an AUC of 0.88 for the diagnosis of mild stages of fibrosis. The index exhibited a lower AUC of 0.64 in the diagnosis of moderate stages of fibrosis.
INTRODUCTION
Hepatitis C virus (HCV) infection exhibits worldwide distribution with a global prevalence of 2.35%, and it affects 160-170 millions of chronically infected individuals[1]. Approximately three to four million peoples are infected annually[2]. Egypt has one of the highest prevalence rates worldwide, 14.9%, as estimated by the Egypt Demographic and Health Survey. HCV genotype 4 is the most common genotype in Egypt[3]. Liver fibrosis is the essential pathophysiological consequence of chronic liver injury regardless of injurious agent because it is the pathological outcome of chronic HCV infections[4].
Hepatic stellate cells (HSCs) are the major fibrogenic cells in the liver. Apoptotic HSCs regulate the balance between the synthesis and degradation of the extracellular matrix[5]. HCV-induced bioactive transforming growth beta 1 is critical for the induction of α-smooth muscle actin and type-1 collagen, which are markers for HSC activation and proliferation[6].
The assessment of liver fibrosis level (stage) is a major issue for the management and follows-up of patients with chronic hepatitis C infection. Liver biopsy is the gold standard for the assessment of fibrosis and grade of necro-inflammation and histological staging is based on semi-quantitative scoring systems (e.g., Metavir and Ishak Scores)[7].
However, liver biopsy exhibits certain drawbacks, including sampling error, invasiveness with potentiality adverse effects, complications, such as haemorrhage in 0.3% of cases, pain in 30% of cases and mortality in 0.01% of cases, and inter and intra observer variability in the reading of biopsy specimens[8]. Therefore, liver biopsy is not a perfect assessment of liver fibrosis and there is a growing need to identify surrogate non-invasive markers of liver injury with its clinical consequences and future events.
HCV chronic infections are associated with insulin resistance and type 2 diabetes mellitus, which are more frequently observed in HCV infections compared with healthy controls and liver diseases of other aetiology. HCV infection promotes insulin resistance primarily via increased TNF-α production and enhanced suppressor of cytokine, which block PI3K and Akt phosphorylation[9]. Insulin resistance and geographical origin (Egyptian) are the major predictors of liver fibrosis and response to therapy in HCV-genotype 4[10].
Physiological hepatic angiogenesis occurs during liver regeneration and leads to the formation of new functional sinusoids. However pathological angiogenesis occurs in fibrosis, and it is characterized by the appearance of capillaries vascular structures[11]. The resulting hypoxia in liver injury induces activation of the renin-angiotensin system (RAS), which plays a role in the pathogenesis of fibrosis in the heart, kidney, lung and liver[12].
Multiple markers using non-invasive methods to determine liver fibrosis are available. No single non-invasive test or model can match the information obtained from actual perfect histology, and there is a need to develop further tests or models that alleviate or that reduce the need for invasive liver biopsy.
We used simple biological parameters that are related to the development and progression of liver fibrosis, to obtain a model of acceptable accuracy that predicted levels of liver fibrosis in HCV-genotype 4 patients.
MATERIALS AND METHODS
This cross-sectional observational study included a cohort of 352 recruited patients with chronic hepatitis C infection. Patients were attending liver clinics at Minia University, Egypt, from June 2011 to July 2013. Data from twenty patients were excluded because eight patients were not genotype 4, five patients had a small core of liver biopsy that required correct assessment, four patients were diabetic, and three patients failed to follow-up. Only data of 332 patients were subjected to statistical analyses. Included patients had HCV-genotype 4 infection. HCV infection was defined as positive second generation anti-HCV antibodies and detection of HCV RNA in serum using quantitative reverse transcription polymerase chain reaction during the study period (Abbott M 2000, United States; -lower limit of detection 12 IU/mL). HCV genotyping was performed using line probe assay or reverse hybridisation and commercially available kits (Innolipa, Innogenetic, and Genetics, Belgium).
Exclusion criteria included co-infection with hepatitis B virus, human immunodeficiency virus or schistosomal infections, regular alcohol intake greater than 10 g/d, previous interferon therapy, other aetiologies of liver disease such as immune-mediated liver diseases, clinical evidence of liver decompensation and use of drugs that may alter insulin resistance, such as insulin sensitizers. Obesity determined as body mass index > 30 [body mass index (BMI) > 30] and frank diabetes mellitus diagnosed according to the American Diabetes Association diagnosis criteria[13] were exclusion criteria from the study because these conditions may confound the results. Associated lung disease was also excluded because it may confound angiotensin converting enzyme (ACE) levels.
Informed consent
The Institutional Ethics Committee of participating units approved the study protocol, and all patients signed informed consent. The study was conducted in accordance with the ethical guidelines of the 1975 Helsinki Declaration.
Liver histopathology
Sonographic-guided liver biopsy was performed on the second day of blood withdrawal for tests using disposable true cut needles (14 gauge) to obtain a sufficient liver tissue core. Liver biopsy specimens not less than 15 mm in length or the presence of at least 10 complete portal tracts were required for data inclusion.
Liver biopsy specimens were fixed and paraffin embedded, stained with the routinary haematoxylin and eosin (H and E) and mason trichrome stain to define fibrosis in combination with Prussian blue for iron staining. A single experienced pathologist who was blinded to clinical and laboratory data examined liver biopsy specimens.
Fibrosis staging and necroinflammatory grading were scored according to Metavir scores, which scores fibrosis as F0 (absent), F1 (portal fibrosis), F2 (portal fibrosis with few septa), F3 (septal fibrosis) and F4 (cirrhosis). Necroinflammatory activity was graded as A0 (absent), A1 (mild), A2 (moderate) and A3 (severe)[14].
Demographic and laboratory assessment
The following data were collected from all patients at baseline: Age, sex, weight (W) in kilograms, height (H) in meteres, waist and hip circumferences in centimeteres, and BMI calculated as W/H2, and Waist/Hip ratio. Venous blood was withdrawn after an 8-h overnight fast and was analysed for fasting plasma glucose.
Other sample of venous blood was withdrawn after a 12-h overnight fast and collected in three tubes, one of which contained EDTA-K3 for haemogram assessment. Serum from the other two tubes was distributed as follows: One sample was frozen in a -70 °C refrigerator for later assessments of insulin, C-peptide and ACE. Serum from the third tube was analysed on the same day for, cholesterol, triglycerides, and liver biochemical and renal profiles.
Laboratory methods
Serum insulin and C-peptide were assayed using a sandwich ELISA technique and kits from Monobind Inc (Lake Forest, CA, United States); Serum ACE was assayed using kits from R and D systems (R and D Systems, Inc. United States and Canada) that employ a quantitative sandwich immunoassay technique; Liver function tests [serum total and conjugated bilirubin, alanine amino transferase (ALT), aspartate amino transferase (AST), alkaline phosphates, total proteins and albumin], kidney function tests (urea and creatinine), and total cholesterol and triglycerides were performed using a Synchron CX-9 auto-analyser using Beckman reagents (Beackman Instruments; Scientific Instruments Division, Fullerton, CA, United States); Complete blood count was performed on using Coulter Counter T 660 (Beckman Coulter, Inc., Harbor Blvd., Fullerton, CA, United States); Prothrombin time was assessed on an STA-Stago Compact CT autoanalyser (Diagnostic Stago, Inc., Parsippany, NJ, United States) using reagents from Dade Behring (Dade Behring Holdings Inc., IL, United States); hepatitis B surface antigen and C-antibody were measured using Roche Cobase 411 (Roche Diagnostic Gmblt); insulin resistance (IR) was determined using the homeostasis model assessment for insulin resistance (HOMA-IR) method and the following equation: HOMA-IR = Fasting insulin (mU/mL) × Fasting plasma glucose (mmol/L)/22.5. Insulin resistance as calculated using this method correlates closely with the gold standard hyperinsulinemic/euglycemic clamp method in diabetic and non-diabetic subjects[15,16].
Statistical analysis
Qualitative data are presented as numbers, (%). Normally distributed variables are presented as the means ± SD and non-parametric data are presented as the medians and interquartile range. The distribution of qualitative variables was evaluated using the χ2 test or Fisher’s exact test, as indicated. The means were compared between groups using the non-parametric independent-samples Kruskal-Wallis test, and the level of significance following pairwise comparisons was adjusted for the number of comparisons made.
Fibrosis stages based on Metavir scores were distributed into 5 classes: F0, F1, F2, F3 and F4. Patients were further regrouped into 3 stages of mild (F0-F1), moderate (F2) and advanced fibrosis (F3-F4) for statistical analyses. Univariate analyses identified patient’ age, AST and platelet count added to HOMA-IR as significantly different between the 3 levels of fibrosis in overall and pairwise comparisons. All variable were introduced in a stepwise discriminative functional analysis model for the three levels of fibrosis after normalising HOMA-IR, AST and platelet count into their log10 values. Diagnostic accuracy is expressed as area under the curve of receiving operating characteristic (AUROC) (asymptomatic 95%CI), sensitivity, specificity, positive and negative predictive values, and positive and negative likelihood ratios. All tests were bilateral, and a P value of 0.05 was the limit of statistical significance. Statistical analyses were performed using the IBM SPSS statistical software package for MAC version 22.
RESULTS
A total of 332 HCV-genotype 4 Egyptian patients were included to statistical analysis. Patients exhibited a mean age of 42 ± 10.7 years and male to female ratio of 180/146 (65/44%). Gender showed no statistically significant difference between levels of liver fibrosis. Mean BMI and Waist/Hip ratio were 26.7 ± 4.4 and 0.89 ± 0.08, respectively, which indicates that none of our patients was obese. None of the study patients consumed alcohol or had history of drug abuse. A total of 69.6% were non-smokers, 19% were moderate smokers and 11.4% were heavy smokers. The Metavir scoring system identified F0 = 43, F1= 136, F2 = 64, F3 = 45 and F4 = 44 patients.
Table 1 presents quantitative variables such as the mean, SD, median and quartile range in the five stages of liver fibrosis. Table 2 presents pairwise comparisons of significant variables between the three levels of fibrosis. Table 3 presents the overall significant variables using independent - samples Kruskal-Wallis tests which indicated that age, ACE, blood glucose, ALT, AST, platelet count, fasting serum insulin, serum creatinine, total and direct bilirubin, and serum albumin were significant predictors of liver fibrosis stage. Viral load showed no statistically significant difference among stages and levels of liver fibrosis.
Table 1.
Presentation of quantitative variable as means, standard deviation, median and quartile range by stages of fibrosis
| Variant | Total (n = 332) | F0 (n = 43) | F1 (n = 136) | F2 (n = 64) | F3 (n = 45) | F4 (n = 44) |
| Age (yr) | ||||||
| Mean ± SD | 42 ± 9.8 | 31.6 ± 7.4 | 41.1 ± 9.2 | 42 ± 7.4 | 48.5 ± 8.9 | 49.7 ± 7.5 |
| Median ± QR | 42 ± 15 | 31 ± 11 | 40.5 ± 15 | 42 ± 10 | 50 ± 11 | 49 ± 13 |
| Gender (male) | ||||||
| n (%) | 184 (55.4) | 24 (55.8) | 77 (56.6) | 40 (62.5) | 22 (48.9) | 21 (47.7) |
| HOMA-IR | ||||||
| Mean ± SD | 3.1 ± 1.3 | 2.4 ± 0.9 | 2.7 ± 1 | 3.4 ± 1.2 | 4.1 ± 1.7 | 4.0 ± 1.2 |
| Median ± QR | 2.9 ± 1.6 | 2.4 ± 1.8 | 2.7 ± 1.4 | 3.4 ± 1.4 | 4.1 ± 2.5 | 4.2 ± 2 |
| ACE (U/mL) | ||||||
| Mean ± SD | 286.7 ± 132.9 | 248.9 ± 122.3 | 277.3 ± 129 | 287.2 ± 122.5 | 325.3 ± 173.3 | 320.4 ± 122.4 |
| Median ± QR | 260 ± 180 | 235 ± 127.5 | 260 ± 195 | 300 ± 190 | 275 ± 171.3 | 285 ± 138.8 |
| Glucose (mmol) | ||||||
| Mean ± SD | 5.1 ± 0.9 | 5 ± 0.6 | 5.1 ± 0.9 | 4.8 ± 0.8 | 5.3 ± 0.9 | 5.7 ± 1.1 |
| Median ± QR | 5.1 ± 1.22 | 5.1 ± 1.1 | 4.9 ± 1.1 | 4.7 ± 1.2 | 5.3 ± 1.6 | 5.4 ± 1.7 |
| ALT (U/L) | ||||||
| Mean ± SD | 58.4 ± 36.9 | 37 ± 16.6 | 53.6 ± 37.7 | 55.5 ± 30.4 | 79.8 ± 42.6 | 82 ± 33.9 |
| Median ± QR | 44 ± 52 | 36 ± 24.3 | 43 ± 43 | 47 ± 53 | 81.5 ± 57.5 | 90 ± 41.5 |
| AST (U/L) | ||||||
| Mean ± SD | 53.2 ± 37.6 | 27.5 ± 10.9 | 41.1 ± 21.3 | 55 ± 35.4 | 87.2 ± 53.9 | 88.6 ± 42.5 |
| Median ± QR | 36 ± 43 | 23.5 ± 18.3 | 34 ± 25.8 | 36 ± 39 | 89 ± 61.3 | 85 ± 67.3 |
| Platelet (× 109/L) | ||||||
| Mean ± SD | 213.6 ± 70 | 225.8 ± 49.4 | 240 ± 65.4 | 207.1 ± 70.2 | 164.8 ± 73.8 | 158.3 ± 36.2 |
| Median ± QR | 215 ± 105 | 221.5 ± 77.5 | 233 ± 82.5 | 226 ± 120 | 150.5 ± 90.3 | 162.5 ± 38.8 |
| BMI | ||||||
| Mean ± SD | 27.4 ± 4.5 | 25.7 ± 4.3 | 27.9 ± 5.1 | 27.8 ± 4.3 | 27.2 ± 3.6 | 26.6 ± 3.1 |
| Median ± QR | 27.7 ± 5.8 | 25.9 ± 7.5 | 28.3 ± 7.8 | 27.7 ± 5.3 | 27.6 ± 4.6 | 27.8 ± 4.2 |
| Waist: Hip ratio | ||||||
| Mean ± SD | 0.9 ± 0.1 | 0.9 ± 0.1 | 0.9 ± 0.1 | 0.9 ± 0.1 | 0.9 ± 0.1 | 0.9 ± 0.1 |
| Median ± QR | 0.9 ± 0.1 | 0.9 ± 0.04 | 0.9 ± 0.1 | 0.9 ± 0.1 | 0.9 ± 0.1 | 0.9 ± 0.1 |
| Insulin (uU/mL) | ||||||
| Mean ± SD | 13.9 ± 5.3 | 11.1 ± 4.2 | 12.2 ± 4.5 | 15.8 ± 4.9 | 17.7 ± 7.1 | 15.7 ± 3.3 |
| Median ± QR | 13.6 ± 6.7 | 12.6 ± 7.2 | 12.3 ± 6.3 | 14.6 ± 3.4 | 16.7 ± 10.2 | 16.6 ± 5.8 |
| Albumin (g/dL) | ||||||
| Mean ± SD | 4.2 ± 0.5 | 4.2 ± 0.3 | 4.4 ± 0.5 | 4 ± 0.8 | 4 ± 0.5 | 4 ± 0.3 |
| Median ± QR | 4.2 ± 0.6 | 4.1 ± 0.5 | 4.4 ± 0.5 | 4.2 ± 0.8 | 3.9 ± 0.7 | 4 ± 0.6 |
| Viral load (IU/mL) | ||||||
| Mean ± SD | 372826.7 ± 902784.9 | 338113.1 ± 624770.4 | 409890.1 ± 941388.1 | 283586 ± 858939.26 | 264338.4 ± 452377.9 | 119830.8 ± 162200.8 |
| Median ± QR | 78000 ± 280088 | 117466.5 ± 358614 | 59112 ± 310055 | 156797 ± 251419 | 47546 ± 278956 | 97133 ± 167712 |
SD: Standard deviation; QR: Quartile range; HOMA-IR: Homeostasis model for insulin resistance, a mathematically calculated formula; ACE: Angiotensin converting enzyme; AST: Aspartate transaminase enzyme; ALT: Alanine amino transferase; BMI: Body mass index.
Table 2.
Presentation of quantitative variables and their significance among three levels of fibrosis and significance between groups
| Variant | Mild fibrosis (F0-F1) (n = 179) | Moderate fibrosis (F2) (n = 64) | Advanced fibrosis (F3-F4) (n = 89) | P1 | P2 | P3 |
| Age (yr) | ||||||
| Mean ± SD | 39.1 ± 9.6 | 42 ± 7.4 | 49 ± 8.2 | 0.001 | 0.001 | 0.001 |
| Median ± QR | 38.5 ± 16 | 42 ± 10 | 50 ± 11 | |||
| Gender (male) | ||||||
| n (%) | 101 (56) | 40 (62) | 43 (48) | 0.100 | 0.060 | 0.832 |
| HOMA-IR | ||||||
| Mean ± SD | 2.6 ± 0.9 | 3.4 ± 1.2 | 4.1 ± 1.5 | 0.027 | 0.001 | 0.008 |
| Median ± QR | 2.5 ± 1.4 | 3.4 ± 1.4 | 4.1 ± 2.2 | |||
| ACE (U/mL) | ||||||
| Mean ± SD | 271.5 ± 127.3 | 287.2 ± 122.5 | 323.2 ± 150.9 | 0.051 | 0.001 | 0.022 |
| Median ± QR | 255 ± 187.5 | 300 ± 190 | 275 ± 142.5 | |||
| Glucose (mmol) | ||||||
| Mean ± SD | 5.1 ± 0.9 | 4.8 ± 0.8 | 5.4 ± 1 | 0.629 | 0.013 | 0.017 |
| Median ± QR | 5 ± 1 | 4.6 ± 1.1 | 5.3 ± 1.5 | |||
| ALT (U/L) | ||||||
| Mean ± SD | 50.2 ± 34.9 | 55.5 ± 30.3 | 80.7 ± 38.4 | 0.004 | 0.001 | 0.022 |
| Median ± QR | 40 ± 43 | 47 ± 53 | 85.5 ± 53.3 | |||
| AST (U/L) | ||||||
| Mean ± SD | 38.3 ± 20.3 | 55 ± 35.4 | 87.8 ± 48.5 | 0.001 | 0.001 | 0.001 |
| Median ± QR | 34 ± 20.5 | 36 ± 39 | 87 ± 61 | |||
| Platelet (× 109/L) | ||||||
| Mean ± SD | 237.1 ± 62.4 | 207.1 ± 70.2 | 162 ± 59.8 | 0.003 | 0.001 | 0.001 |
| Median ± QR | 231 ± 81.3 | 226 ± 120 | 160.5 ± 64.3 | |||
| Insulin (uU/mL) | ||||||
| Mean ± SD | 11.9 ± 4.4 | 15.8 ± 4.9 | 16.8 ± 5.8 | 0.016 | 0.001 | 0.071 |
| Median ± QR | 12.4 ± 6.2 | 14.6 ± 3.4 | 16.7 ± 6.4 | |||
| Creatinine (mg/dL) | ||||||
| Mean ± SD | 0.7 ± 0.2 | 0.6 ± 0.1 | 0.7 ± 0.2 | 0.999 | 0.009 | 0.039 |
| Median ± QR | 0.7 ± 0.2 | 0.6 ± 0.3 | 0.6 ± 0.3 | |||
| Albumin (g/dL) | ||||||
| Mean ± SD | 4.3 ± 0.43 | 4 ± 0.8 | 4 ± 0.41 | 0.044 | 0.001 | 0.005 |
| Median ± QR | 4.4 ± 0.54 | 4.2 ± 0.84 | 4 ± 0.67 | |||
| Viral load1 | ||||||
| Range | 45979 (2.47-6570282) | 36355.5 (2.46-6403601) | 55000 (6.00-5600790) | 0.37 | 0.96 | 0.52 |
| Mean ± SD | 358316.6 ± 909311.81 | 283586 ± 858939.26 | 331799.1 ± 863675.2 |
Comparison was done using non-parametric Mann-Whitney test. SD: Standard deviation; QR: Quartile range; HOMA-IR: Homeostasis model for insulin resistance, a mathematically calculated formula; ACE: Angiotensin converting enzyme; AST: Aspartate transaminase enzyme; ALT: Alanine amino transferase; P1: Significance between mild and moderate fibrosis; P2: Significance between mild and advanced fibrosis; P3: Significance between moderate and advanced fibrosis.
Table 3.
The overall significant variables among the studied variables: Using independent-samples Kruskal-Wallis test
| Variables | P value |
| Age (yr) | 0.001 |
| HOMA-IR | 0.001 |
| ACE (U/mL) | 0.001 |
| Glucose (mmol) | 0.021 |
| ALT (U/L) | 0.001 |
| AST (U/L) | 0.001 |
| Platelet (× 109/L) | 0.001 |
| Insulin (uU/mL) | 0.001 |
| Creatinine (mg/dL) | 0.024 |
| Total Bilirubin (mg/dL) | 0.001 |
| Direct Bilirubin (mg/dL) | 0.002 |
| Albumin (mg/dL) | 0.001 |
| Portal vein diameter | 0.004 |
| Splenic diameter | 0.001 |
HOMA-IR: Homeostasis model for insulin resistance, a mathematically calculated formula; ACE: Angiotensin converting enzyme; AST: Aspartate transaminase enzyme; ALT: Alanine amino transferase.
Statistically significant variables that discriminated between the 3 levels of fibrosis on univariate analysis, namely AST, platelet count and age and HOMA-IR were introduced to a stepwise multivariate discriminant analysis. This analysis requires a normal distribution of the dependent variables and equality of variance. Therefore; HOMA-IR, AST and platelet count were transformed into log10 values.
Table 4 indicates that all variables were statistically significant before being introduced in the model. These variables were introduced into a model that significantly predicted liver fibrosis. Stepwise analysis derived the following equation.
Table 4.
Multivariate discriminant functional analysis among the significant predictive variables
| Variable | Statistic | P value |
| Log AST | 61.295 | 0.001 |
| Log platelet | 44.331 | 0.001 |
| Age (yr) | 39.635 | 0.001 |
| Log HOMA-IR | 33.682 | 0.001 |
HOMA-IR: Homeostasis model for insulin resistance, a mathematically calculated formula; AST: Aspartate transaminase enzyme.
Outcome = 0.514 (age) + 0.373 (Log HOMA-IR) + 0.49 (Log AST) + (-0.532) Log platelet count.
The interpretation of outcome is dependent on the functions of group centroids as: (1) mild fibrosis if outcome is ≤ -0.31 or more negative; (2) moderate fibrosis if outcome is > -0.31 (more positive) and up to +0.86; and (3) advance fibrosis if outcome is > 0.86.
Table 5 presents accuracy indices of the model in the discrimination of fibrosis stages. In mild fibrosis and at a cut-off value -0.31 or more negative, AUC was 0.88 with sensitivity, specificity, positive predictive value, negative predictive value, positive likelihood ratios and negative likelihood ratios were 67.2%, 86.3%, 83.6%, 69.5%, 4.9 and 0.38, respectively, Figure 1. In advanced fibrosis and at a cut-off value > 0.86, AUC was 0.91 with sensitivity, specificity, positive predictive value, negative predictive value, positive likelihood ratios and negative likelihood ratios were 73%, 90.9%, 74.4%, 90.1%, 8.0 and 0.3, respectively (Figure 2). While, in moderate fibrosis and at a cut-off value > -0.31 up to +0.86, AUC was 0.64 with sensitivity, specificity, positive predictive value, negative predictive value, positive likelihood ratios and negative likelihood ratios were 53.1%, 74.1%, 33%, 86.8%, 2.0 and 0.63, respectively, Figure 3.
Table 5.
Accuracy indices of the discriminant score in the prediction of fibrosis
| Stage of fibrosis | Cut-off value | AUC | 95%CI | Sens | Specific | PPV | NPV | PLR | NLR |
| Mild fibrosis (F0-F1) | -0.31 or more negative | 0.88 | 0.84-0.91 | 67.2% | 86.3% | 83.6% | 69.5% | 4.9 | 0.38 |
| Moderate fibrosis (F2) | > -0.31 up to +0.86 | 0.64 | 0.61-0.74 | 53.1% | 74.1% | 33% | 86.8% | 2.0 | 0.63 |
| Advanced fibrosis (F3-F4) | > 0.86 | 0.91 | 0.88-0.94 | 73% | 90.9% | 74.4% | 90.1% | 8.0 | 0.3 |
Sens: Sensitivity; Specific: Specificity; PPV: Positive predictive value; NPV: Negative predictive value; PLR: Positive likelihood ratio; NLR: Negative likelihood ratio; AUC: Area under the curve.
Figure 1.
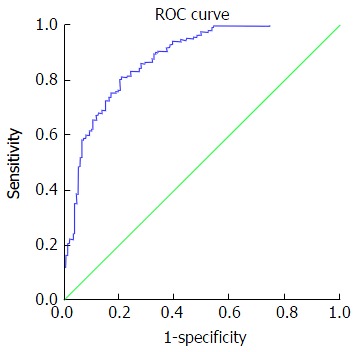
Receiving operating characteristic curve for discriminating mild fibrosis. At cut off value: -0.31 or more negative: AUC 0.88, 95%CI: 0.84 -0.91, sensitivity 67.2%, specificity 6.3%, PPV 83.6%, NPV 69.5%, PLR 4.9 and NLR 0.38. AUC: Area under the curve; PPV: Positive predictive value; NPV: Negative predictive value; PLR: Positive likelihood ratio; NLR: Negative likelihood ratio; ROC: Receiving operating characteristic.
Figure 2.
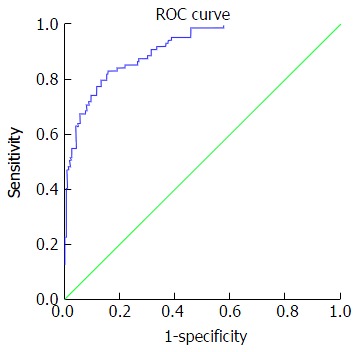
Receiving operating characteristic curve for discriminating advanced fibrosis. At cut off value > 0.86: AUC 0.91, 95%CI: 0.88-0.94, sensitivity 73%, specificity 90.9%, PPV 74.4%, NPV 90.1%, PLR 8.0 and NLR 0.3. PPV: Positive predictive value; NPV: Negative predictive value; PLR: Positive likelihood ratio; NLR: Negative likelihood ratio; ROC: Receiving operating characteristic.
Figure 3.
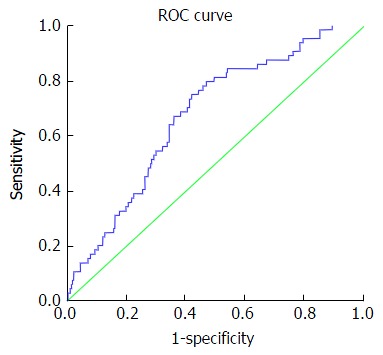
Receiving operating characteristic curve for discriminating moderate fibrosis. At cut off value > -0.31 up to +0.86: AUC 0.64, 95%CI: 0.61-0.74, sensitivity 53.1%, specificity 74.1%, PPV 33%, NPV 86.8%, PLR 2.0 and NLR 0.63. AUC: Area under the curve; PPV: Positive predictive value; NPV: Negative predictive value; PLR: Positive likelihood ratio; NLR: Negative likelihood ratio; ROC: Receiving operating characteristic.
The obtained model was validated by applying the model to the selected studied groups. Table 6 shows the results of this validation which indicated that two-thirds of the cases were correctly classified by the model (66.1%). This sensitivity increased to 67.2% and 73% in mild and advanced fibrosis, respectively, but dropped to 53.1% in moderate fibrosis.
Table 6.
Validation results done on the studied selected groups
| Stage of fibrosis |
Predicted group membership |
Total | ||
| Mild fibrosis | Moderate fibrosis | Advanced fibrosis | ||
| Count | ||||
| Mild fibrosis | 119 | 50 | 8 | 177 |
| Moderate fibrosis | 16 | 34 | 14 | 64 |
| Advanced fibrosis | 5 | 19 | 65 | 89 |
| Percent | ||||
| Mild fibrosis | 67.2 | 28.2 | 4.5 | 100.0 |
| Moderate fibrosis | 25.0 | 53.1 | 21.9 | 100.0 |
| Advanced fibrosis | 5.6 | 21.3 | 73.0 | 100.0 |
DISCUSSION
The prediction of liver fibrosis is a major issue for management and follow-up of patients with chronic hepatitis C. Liver biopsy provides the best for evaluation of liver fibrosis stages[17], but this technique has its drawbacks. Liver biopsy is not the perfect tool for follow-up assessments of fibrosis in patients with chronic hepatitis C with or without virological cure[18].
The limitations of liver biopsy disclosed the need for the development of non-invasive tests to assess liver fibrosis. Currently available methods to predict liver fibrosis rely on two different but complementary approaches: (1) a biological approach based on measurements of serum levels of biological markers that are independent predictors of liver fibrosis[19]; and (2) a “physical” approach based on the measurement of liver stiffness using transient elastography or other recent radiological tools[20].
Many biomarkers have been developed and validated, but none of these markers provide the perfect test. This result may be due to the relatively reduced accuracy of otherwise the sophisticated techniques and the high costs of these tests[21]. We developed a non-invasive biomarker using variables that are biologically relevant to the development and progression of liver fibrosis, because of limitations of the available methods of non-invasive markers for assessment of liver fibrosis[22].
Our study demonstrated on univariate analysis that age significantly (P < 0.001) correlated with the stage of liver fibrosis. Age is used with some of the current biomarkers as an independent determinant of liver fibrosis, such as Forn’s Index[23] and Fib 4[24].
The results of univariate and multivariate analyses demonstrated that AST was a highly significant (P < 0.0001) independent predictor of liver fibrosis stage. AST is used in many available biomarker tests as an independent predictor for liver fibrosis, such as Fib-4[24], APRI test[25], Fibro index[26], and Fibrometere[27].
Our results indicated that platelets were significantly negatively correlated with the advancement of liver fibrosis stage (P < 0.0001). Platelet count was reported previously to progressively decrease with the progression of liver fibrosis[28], which makes it to be included in some currently available biomarker evaluations of liver fibrosis stage including Forn’s index[23], and Fib-4[24], APRI test[25], and Fibro index[26].
Our univariate analysis results demonstrated a significantly increasing level of HOMA-IR with the progression of liver fibrosis stage (P < 0.0001). Insulin resistance is a powerful promoter of fibrogenesis via direct HSC stimulation, TNF-α, connective growth factor production and ductular reaction induction[29]. However, only the Sud index included insulin resistance as a variable to evaluate liver fibrosis[30].
Our study is the first report of the correlation of the progressive rise of serum ACE levels with the advancement of liver fibrosis stage (P < 0.0001). Multivariate analysis of ACE serum level significantly predicted the stage of liver fibrosis (P < 0.001).
ACE is the key rate-limiting enzyme for activation of the RAS, which results in the production of angiotensin II. Angiotensin II induces the contraction and proliferation of the human HSCs that are responsible for hepatic fibrogenesis[31]. However, it was excluded from our discriminating analysis to avoid the possible confounding effect of some disease states that may alter ACE serum level.
Stepwise multiple discriminative functional analysis indicated that platelets, age, AST, and HOMA-IR variables, in this order of frequency, were independent predictors of liver fibrosis with highly significant values (P < 0.0001).
Log AST, log platelet count, log HOMA-IR and age were introduced in a stepwise discriminant analysis model. Our discriminating index for the prediction of liver fibrosis was processed into three levels based on 2014 EASL recommendations for the management of HCV patients to discriminate fibrosis in chronic hepatitis C: 1-No to Mild Fibrosis = F0-F1. 2-Moderate fibrosis = F2 3-Advanced fibrosis = F3-F4 according to Metavir staging score.
All variables were statistically significant before introduction into the model. The following discriminative outcome was obtained using multiple stepwise analysis: Outcome = 0.514 (age) + 0.373 (Log HOMA-IR) + 0.49 (Log AST) + (-0.532) Log platelet count.
Where the level of fibrosis was predicted using the following cut-off values: (1) mild fibrosis = -0.31 or more negative; (2) moderate fibrosis if outcome > -0.31 (more positive) and up to +0.86; and (3) advance fibrosis if outcome > 0.86.
Our index with a cut-off value ≥ 0.86 exhibited an AUROC of 0.91 for predicting advanced stages of liver fibrosis (F3-F4) with a sensitivity, specificity, positive predictive value, negative predictive value and positive likelihood ratio of 73%, 90.9%, 74.7%, 90.0% and 8.0, respectively. The diagnostic accuracy of our index for the predicting of advanced liver fibrosis (F3-F4) was more effective than other scores such as the Fibrotest, APRI, Fibrometere, Hepascore. Degos et al[32] performed a large study (n = 1307) that compared transient elastography with patented and non-patented biomarkers (e.g., Fibrotest, Fibrometere, Hepascore and APRI) compared to liver biopsy. They reported an AUROCs of 0.76 for transient elastography, which did not differ from the AUROCs of the serum markers (0.72-0.78) for the diagnosing of significant fibrosis (F2-F3). However, they reported an AUROC of 0.90 for transient elastography compared to 0.82, 0.86, 0.77 and 0.86 for the Fibrotest, Fibrometere, APRI and Hepascore respectively, for the diagnosing of F4.
Our discriminating index using a cut-off value < 0.31 exhibited an AUROC of 0.88 in the diagnosing of no or mild fibrosis (F0-F2) with a sensitivity, specificity, positive predictive value, negative predictive value, positive likelihood ratio of 67.2%, 86.3%, 83.6%, 69.5% and 4.9, respectively, which indicates high diagnostic performance in the diagnosing of this group of patients. Most currently available scores did not diagnose this group of patients. Poynard et al[33] performed a meta-analysis of 30 studies that assessed the diagnostic value of the Fibrotest compared to liver biopsy and found that the AUROC for Fibrotest in the diagnosing of adjacent stages of fibrosis (F1 vs F2) was 0.77 (0.75-0.79), and the AUROC was 0.83 (0.81-0.85) for advanced fibrosis (F3-F4). These figures for Fibrotest in the diagnosing of mild and advanced fibrosis are lower in performance than in our index.
Koda et al[26] formulated their Fibroindex and reported its accuracy compared to APRI and Forns indices. Their data indicated that the AUROCs of APRI, Forns index, and Fibronectin were 0.78, 0.78 and 0.83, respectively, in discriminating mild degrees of fibrosis (F0-F1) vs significant stages of fibrosis (F2-F3), but the AUROCs were 0.81, 0.83 and 0.85, respectively, for discriminating F3-F4.
These data indicate that our index exhibited higher AUROCs for predicting advanced and mild stages of fibrosis than the currently available scores with higher performance accuracy.
Attallah et al[34] reported the Fibronectin discriminant score (FDS), using fibronectin, APRI and albumin. FDS exhibited an AUROC of 0.91 in discriminating F0-F1 vs F2-F4 and an AUROC of 0.86 in discriminating F0-F2 vs F3-F4. These data are nearly equal to the values of our discriminating index.
However, one limitation of our index is the low performance in the diagnosing of F2. The AUROCs for the diagnosing of F2 was 0.64 with cut-off values of ≥ -0.31 up to +0.86 with a sensitivity, specificity, positive predictive value, negative predictive value, and a positive likelihood ratio of 53.1%, 74.1%, 33.0%, 86.8% and 2.0, respectively.
Crisan et al[35] validated the performance of six blood scores (APRI, Forns, Fib-4, Hepascore, Fibrotest and Fibrometere) using transient elastography compared to liver biopsy. Their data indicated that significant fibrosis F > 2 was predicted with AUROCs of 0.727, 0.680, 0.714, 0.778, 0.688, 0.797 and 0.751 for APRI, Forns, Fib-4, Fibrotest, Hepascore, Fibrometere and transient elastography, respectively, and AUROCs were 0741, 0.737, 0.767, 0.705, 0.811, 0.782 and 0.809 in the diagnosis of severe fibrosis (F3-F4). These data provide further support to the higher performance of our index compared to these six serum scores.
Chisti et al[36] performed a prospective study to validate three biological scores (Fibrotest, Fibrometere and Hepascore) and reported AUROCs for the predicting of mild to moderate fibrosis of 0.81, 0.85, and 0.77, respectively and AUROCs for the diagnosing of F4 of 0.84, 0.92 and 0.88 respectively. These figures approximate our discriminating scores in the predicting of mild and advanced stages of fibrosis.
Our discriminating index was validated via application to originally selected patients. The results indicated that the model correctly classified two-thirds of the cases (66.1%). This sensitivity increased to 67.2% and 73% in mild and advanced fibrosis, respectively, but dropped to 53.1% in moderate fibrosis.
Our discriminating score exhibited higher performance in the diagnosing of mild or no fibrosis and advanced stages of liver fibrosis than the currently available blood tests, but our study and others evaluations of biological scores used liver biopsy as the reference standard.
Pyonard et al[37] investigated the performance of liver biopsy itself compared to two non-invasive tests (Fibrotest and Fibroscan) in the absence of the gold standard. The authors reported a relatively lower level of performance for liver biopsy even with the use of 20 mm length for the diagnosis of significant fibrosis (F2-F3). The specificity and sensitivity were 0.67 and 0.63, respectively, for liver biopsy compared to 0.93 and 70 and 0.95 and 0.50 for the Fibrotest and Fibroscan, respectively. These reported data suggested that the discordance between a non-invasive blood test and liver biopsy may be due to the lower diagnostic efficiency of the liver biopsy itself.
The end point of treatment of patients with HCV infections is virus eradication, improvements in liver histology and prevention of the development of complications. Lee et al[38] recently reported on the regression, maintenance and progression of liver fibrosis after virological cure. Pyonard et al[39] validated the use of non-invasive markers (Fibrotest and Fibroscan) in a prospective longitudinal study for the prediction of fibrosis regression and development of complications.
The current policy is to follow-up with hepatitis C patients even if these patients are cured virologically. Here, the availability of an easily assessed, less expensive, reproducible blood test with high performance may alleviate or reduce the need for liver biopsy.
In conclusion, our discriminating index for liver fibrosis in hepatitis C genotype 4 patients is a simple, easily reproducible test with accepted accuracy. The index is based on biomarkers that are related to the development and progression of liver fibrosis.
Limitation of the study
The lack of external validation of the obtained discriminating index is a limitation of this study. Our index is a candidate for multicenter external validation. This index may also be subjected to longitudinal studies to validate its prediction of future complications in HCV patients. Other limitations are the lack of two pathological observers for each specimen and the lack of determination of elastin connective tissue added to collagens.
COMMENTS
Background
Hepatitis C virus (HCV) induces liver fibrosis through transforming hepatic stellate cells and other intrahepatic cells to fibrous tissue laying cells. The severity of liver fibrosis is related to multiple host and viral factors. These factors are reflected on changes on biological variables. Studying levels of serum levels of some of these biological markers may provide a non-invasive test that can predict the liver fibrosis stage.
Research frontiers
Multiple studies have reported about the increased insulin resistance in HCV infections, possibly as a part of HCV-induced metabolic syndrome. Also, there are available data about the impact of increased activity of hepatitis on the development and progression of liver fibrosis. The authors studied multiple biological and host factors in a cohort of genotype 4 Egyptian patients to assess the predictive ability of these variables in diagnosis of liver fibrosis stage.
Innovations and breakthroughs
This study identified insulin resistance as estimated by homeostasis model of insulin resistance, aspartate transaminase enzyme, platelet count, and age as significant predictors of liver fibrosis stage. A model could be obtained utilizing these markers that could predict liver fibrosis stage with accuracy performance higher than available biological tests. The index is easily applicable and with low expenses.
Applications
The non-invasive test for diagnosis of liver fibrosis stage can alleviate or reduce the need of the invasive liver biopsy to determine the level of liver fibrosis at basal level before starting antiviral treatment. Because liver biopsy cannot be done sequentially to follow-up HCV patients with or without virus cure, the non-invasive test may provide acceptable tool to do this task.
Terminology
HOMA-IR: Homeostasis model for insulin resistance, a mathematically calculated formula; ACE: Angiotensin converting enzyme; AST: Aspartate transaminase enzyme; BMI: Body mass index; W/H: Waist/hip ratio.
Peer-review
The study is interesting and shows a good bibliographic study.
Footnotes
Manuscript source: Invited manuscript
Specialty type: Gastroenterology and hepatology
Country of origin: Egypt
Peer-review report classification
Grade A (Excellent): 0
Grade B (Very good): 0
Grade C (Good): C, C
Grade D (Fair): 0
Grade E (Poor): 0
Institutional review board statement: The study protocol was approved by the Institutional ethics committee of Minia School of medicine in Egypt. The study was conducted in accordance with the ethical guidelines of the 1975 Helsinki declaration.
Informed consent statement: All patients signed informed consent to participate in the study.
Conflict-of-interest statement: The authors declare that they have no competing interests.
Data sharing statement: Participants gave informed consent to share in the study anonymously and risk of identification is low.
Peer-review started: June 26, 2016
First decision: September 2, 2016
Article in press: October 9, 2016
P- Reviewer: Cabibi D, Wang Y S- Editor: Ji FF L- Editor: A E- Editor: Li D
References
- 1.Lavanchy D. Evolving epidemiology of hepatitis C virus. Clin Microbiol Infect. 2011;17:107–115. doi: 10.1111/j.1469-0691.2010.03432.x. [DOI] [PubMed] [Google Scholar]
- 2.Mohd Hanafiah K, Groeger J, Flaxman AD, Wiersma ST. Global epidemiology of hepatitis C virus infection: new estimates of age-specific antibody to HCV seroprevalence. Hepatology. 2013;57:1333–1342. doi: 10.1002/hep.26141. [DOI] [PubMed] [Google Scholar]
- 3.Sievert W, Altraif I, Razavi HA, Abdo A, Ahmed EA, Alomair A, Amarapurkar D, Chen CH, Dou X, El Khayat H, et al. A systematic review of hepatitis C virus epidemiology in Asia, Australia and Egypt. Liver Int. 2011;31 Suppl 2:61–80. doi: 10.1111/j.1478-3231.2011.02540.x. [DOI] [PubMed] [Google Scholar]
- 4.Moreira RK. Hepatic stellate cells and liver fibrosis. Arch Pathol Lab Med. 2007;131:1728–1734. doi: 10.5858/2007-131-1728-HSCALF. [DOI] [PubMed] [Google Scholar]
- 5.Friedman SL. Mechanisms of hepatic fibrogenesis. Gastroenterology. 2008;134:1655–1669. doi: 10.1053/j.gastro.2008.03.003. [DOI] [PMC free article] [PubMed] [Google Scholar]
- 6.Presser LD, McRae S, Waris G. Activation of TGF-β1 promoter by hepatitis C virus-induced AP-1 and Sp1: role of TGF-β1 in hepatic stellate cell activation and invasion. PLoS One. 2013;8:e56367. doi: 10.1371/journal.pone.0056367. [DOI] [PMC free article] [PubMed] [Google Scholar] [Retracted]
- 7.Franciscus A. HCV diagnostic tools: grading and staging a liver biopsy. 2010 [Google Scholar]
- 8.Seeff LB, Everson GT, Morgan TR, Curto TM, Lee WM, Ghany MG, Shiffman ML, Fontana RJ, Di Bisceglie AM, Bonkovsky HL, et al. Complication rate of percutaneous liver biopsies among persons with advanced chronic liver disease in the HALT-C trial. Clin Gastroenterol Hepatol. 2010;8:877–883. doi: 10.1016/j.cgh.2010.03.025. [DOI] [PMC free article] [PubMed] [Google Scholar]
- 9.Basaranoglu M, Basaranoglu G. Pathophysiology of insulin resistance and steatosis in patients with chronic viral hepatitis. World J Gastroenterol. 2011;17:4055–4062. doi: 10.3748/wjg.v17.i36.4055. [DOI] [PMC free article] [PubMed] [Google Scholar]
- 10.Moucari R, Ripault MP, Martinot-Peignoux M, Voitot H, Cardoso AC, Stern C, Boyer N, Maylin S, Nicolas-Chanoine MH, Vidaud M, et al. Insulin resistance and geographical origin: major predictors of liver fibrosis and response to peginterferon and ribavirin in HCV-4. Gut. 2009;58:1662–1669. doi: 10.1136/gut.2009.185074. [DOI] [PubMed] [Google Scholar]
- 11.Medina J, Arroyo AG, Sánchez-Madrid F, Moreno-Otero R. Angiogenesis in chronic inflammatory liver disease. Hepatology. 2004;39:1185–1195. doi: 10.1002/hep.20193. [DOI] [PubMed] [Google Scholar]
- 12.Oruç N, Lamb J, Whitcomb DJ, Sass DA. The ACE gene I/D polymorphism does not affect the susceptibility to or prognosis of PBC. Turk J Gastroenterol. 2008;19:250–253. [PubMed] [Google Scholar]
- 13.American Diabetes Association. Diagnosis and classification of diabetes mellitus. Diabetes Care. 2004;27 Suppl 1:S5–S10. doi: 10.2337/diacare.27.2007.s5. [DOI] [PubMed] [Google Scholar]
- 14.Bedossa P, Poynard T. An algorithm for the grading of activity in chronic hepatitis C. The METAVIR Cooperative Study Group. Hepatology. 1996;24:289–293. doi: 10.1002/hep.510240201. [DOI] [PubMed] [Google Scholar]
- 15.Bonora E, Targher G, Alberiche M, Bonadonna RC, Saggiani F, Zenere MB, Monauni T, Muggeo M. Homeostasis model assessment closely mirrors the glucose clamp technique in the assessment of insulin sensitivity: studies in subjects with various degrees of glucose tolerance and insulin sensitivity. Diabetes Care. 2000;23:57–63. doi: 10.2337/diacare.23.1.57. [DOI] [PubMed] [Google Scholar]
- 16.Eslam M, Kawaguchi T, Del Campo JA, Sata M, Khattab MA, Romero-Gomez M. Use of HOMA-IR in hepatitis C. J Viral Hepat. 2011;18:675–684. doi: 10.1111/j.1365-2893.2011.01474.x. [DOI] [PubMed] [Google Scholar]
- 17.Bedossa P, Carrat F. Liver biopsy: the best, not the gold standard. J Hepatol. 2009;50:1–3. doi: 10.1016/j.jhep.2008.10.014. [DOI] [PubMed] [Google Scholar]
- 18.Castera L, Bedossa P. How to assess liver fibrosis in chronic hepatitis C: serum markers or transient elastography vs. liver biopsy? Liver Int. 2011;31 Suppl 1:13–17. doi: 10.1111/j.1478-3231.2010.02380.x. [DOI] [PubMed] [Google Scholar]
- 19.Pinzani M, Vizzutti F, Arena U, Marra F. Technology Insight: noninvasive assessment of liver fibrosis by biochemical scores and elastography. Nat Clin Pract Gastroenterol Hepatol. 2008;5:95–106. doi: 10.1038/ncpgasthep1025. [DOI] [PubMed] [Google Scholar]
- 20.Lupsor Platon M, Stefanescu H, Feier D, Maniu A, Badea R. Performance of unidimensional transient elastography in staging chronic hepatitis C. Results from a cohort of 1,202 biopsied patients from one single center. J Gastrointestin Liver Dis. 2013;22:157–166. [PubMed] [Google Scholar]
- 21.Poynard T, Ngo Y, Munteanu M, Thabut D, Massard J, Moussalli J, Varaud A, Benhamou Y, Ratziu V. Biomarkers of liver injury for hepatitis clinical trials: a meta-analysis of longitudinal studies. Antivir Ther. 2010;15:617–631. doi: 10.3851/IMP1570. [DOI] [PubMed] [Google Scholar]
- 22.Castera L. Non-invasive assessment of liver fibrosis in chronic hepatitis C. Hepatol Int. 2011;5:625–634. doi: 10.1007/s12072-010-9240-0. [DOI] [PMC free article] [PubMed] [Google Scholar]
- 23.Forns X, Ampurdanès S, Llovet JM, Aponte J, Quintó L, Martínez-Bauer E, Bruguera M, Sánchez-Tapias JM, Rodés J. Identification of chronic hepatitis C patients without hepatic fibrosis by a simple predictive model. Hepatology. 2002;36:986–992. doi: 10.1053/jhep.2002.36128. [DOI] [PubMed] [Google Scholar]
- 24.Sterling RK, Lissen E, Clumeck N, Sola R, Correa MC, Montaner J, S Sulkowski M, Torriani FJ, Dieterich DT, Thomas DL, et al. Development of a simple noninvasive index to predict significant fibrosis in patients with HIV/HCV coinfection. Hepatology. 2006;43:1317–1325. doi: 10.1002/hep.21178. [DOI] [PubMed] [Google Scholar]
- 25.Wai CT, Greenson JK, Fontana RJ, Kalbfleisch JD, Marrero JA, Conjeevaram HS, Lok AS. A simple noninvasive index can predict both significant fibrosis and cirrhosis in patients with chronic hepatitis C. Hepatology. 2003;38:518–526. doi: 10.1053/jhep.2003.50346. [DOI] [PubMed] [Google Scholar]
- 26.Koda M, Matunaga Y, Kawakami M, Kishimoto Y, Suou T, Murawaki Y. FibroIndex, a practical index for predicting significant fibrosis in patients with chronic hepatitis C. Hepatology. 2007;45:297–306. doi: 10.1002/hep.21520. [DOI] [PubMed] [Google Scholar]
- 27.Halfon P, Bacq Y, De Muret A, Penaranda G, Bourliere M, Ouzan D, Tran A, Botta D, Renou C, Bréchot MC, et al. Comparison of test performance profile for blood tests of liver fibrosis in chronic hepatitis C. J Hepatol. 2007;46:395–402. doi: 10.1016/j.jhep.2006.09.020. [DOI] [PubMed] [Google Scholar]
- 28.Kawasaki T, Takeshita A, Souda K, Kobayashi Y, Kikuyama M, Suzuki F, Kageyama F, Sasada Y, Shimizu E, Murohisa G, et al. Serum thrombopoietin levels in patients with chronic hepatitis and liver cirrhosis. Am J Gastroenterol. 1999;94:1918–1922. doi: 10.1111/j.1572-0241.1999.01231.x. [DOI] [PubMed] [Google Scholar]
- 29.Macaluso FS, Maida M, Minissale MG, Li Vigni T, Attardo S, Orlando E, Petta S. Metabolic factors and chronic hepatitis C: a complex interplay. Biomed Res Int. 2013;2013:564645. doi: 10.1155/2013/564645. [DOI] [PMC free article] [PubMed] [Google Scholar]
- 30.Sud A, Hui JM, Farrell GC, Bandara P, Kench JG, Fung C, Lin R, Samarasinghe D, Liddle C, McCaughan GW, et al. Improved prediction of fibrosis in chronic hepatitis C using measures of insulin resistance in a probability index. Hepatology. 2004;39:1239–1247. doi: 10.1002/hep.20207. [DOI] [PubMed] [Google Scholar]
- 31.Bataller R, Ginès P, Nicolás JM, Görbig MN, Garcia-Ramallo E, Gasull X, Bosch J, Arroyo V, Rodés J. Angiotensin II induces contraction and proliferation of human hepatic stellate cells. Gastroenterology. 2000;118:1149–1156. doi: 10.1016/s0016-5085(00)70368-4. [DOI] [PubMed] [Google Scholar]
- 32.Degos F, Perez P, Roche B, Mahmoudi A, Asselineau J, Voitot H, Bedossa P. Diagnostic accuracy of FibroScan and comparison to liver fibrosis biomarkers in chronic viral hepatitis: a multicenter prospective study (the FIBROSTIC study) J Hepatol. 2010;53:1013–1021. doi: 10.1016/j.jhep.2010.05.035. [DOI] [PubMed] [Google Scholar]
- 33.Poynard T, Morra R, Halfon P, Castera L, Ratziu V, Imbert-Bismut F, Naveau S, Thabut D, Lebrec D, Zoulim F, et al. Meta-analyses of FibroTest diagnostic value in chronic liver disease. BMC Gastroenterol. 2007;7:40. doi: 10.1186/1471-230X-7-40. [DOI] [PMC free article] [PubMed] [Google Scholar]
- 34.Attallah AM, Abdallah SO, Attallah AA, Omran MM, Farid K, Nasif WA, Shiha GE, Abdel-Aziz AA, Rasafy N, Shaker YM. Diagnostic value of fibronectin discriminant score for predicting liver fibrosis stages in chronic hepatitis C virus patients. Ann Hepatol. 2013;12:44–53. [PubMed] [Google Scholar]
- 35.Crisan D, Radu C, Lupsor M, Sparchez Z, Grigorescu MD, Grigorescu M. Two or more synchronous combination of noninvasive tests to increase accuracy of liver fibrosis assessement in chronic hepatitis C; results from a cohort of 446 patients. Hepat Mon. 2012;12:177–184. doi: 10.5812/hepatmon.853. [DOI] [PMC free article] [PubMed] [Google Scholar]
- 36.Chisti MJ, Graham SM, Duke T, Ahmed T, Ashraf H, Faruque AS, La Vincente S, Banu S, Raqib R, Salam MA. A prospective study of the prevalence of tuberculosis and bacteraemia in Bangladeshi children with severe malnutrition and pneumonia including an evaluation of Xpert MTB/RIF assay. PLoS One. 2014;9:e93776. doi: 10.1371/journal.pone.0093776. [DOI] [PMC free article] [PubMed] [Google Scholar]
- 37.Poynard T, de Ledinghen V, Zarski JP, Stanciu C, Munteanu M, Vergniol J, France J, Trifan A, Le Naour G, Vaillant JC, et al. Relative performances of FibroTest, Fibroscan, and biopsy for the assessment of the stage of liver fibrosis in patients with chronic hepatitis C: a step toward the truth in the absence of a gold standard. J Hepatol. 2012;56:541–548. doi: 10.1016/j.jhep.2011.08.007. [DOI] [PubMed] [Google Scholar]
- 38.Lee YA, Friedman SL. Reversal, maintenance or progression: what happens to the liver after a virologic cure of hepatitis C? Antiviral Res. 2014;107:23–30. doi: 10.1016/j.antiviral.2014.03.012. [DOI] [PMC free article] [PubMed] [Google Scholar]
- 39.Poynard T, Vergniol J, Ngo Y, Foucher J, Munteanu M, Merrouche W, Colombo M, Thibault V, Schiff E, Brass CA, et al. Staging chronic hepatitis C in seven categories using fibrosis biomarker (FibroTest™) and transient elastography (FibroScan®) J Hepatol. 2014;60:706–714. doi: 10.1016/j.jhep.2013.11.016. [DOI] [PubMed] [Google Scholar]