

Abstract
Introduction
Human arylamine N-acetyltransferase 1 (NAT1) is a phase II xenobiotic metabolizing enzyme found in almost all tissues. Expression of NAT1 is elevated in several cancers including breast cancer. However, the exact mechanism by which NAT1 expression affects cancer risk and progression remains unclear.
Objective
This study explored polar metabolome differences between MDA-MB-231 breast cancer cells expressing varying levels of NAT1 activity using an untargeted approach.
Methods
Three MDA-MB-231 breast adenocarcinoma cell lines that stably express wild-type, increased, and decreased levels of human NAT1 were investigated for differences in polar metabolic profile using a comprehensive two-dimensional gas chromatography time-of-flight mass spectrometry (GC×GC-TOF MS) system.
Results
Increased levels of human NAT1 in the transformed cell lines resulted in a statistically significant decreased abundance of the metabolite palmitoleic acid (q = 0.0006), when compared to normal and decreased levels of human NAT1. The fatty acid synthesis pathway utilizes acetyl coenzyme A (acetyl-CoA) in the first two reactions of the pathway and eventually leads to the synthesis of palmitoleic acid.
Conclusion
These data suggest a link between increased levels of NAT1 activity and decreased flux of acetyl-CoA through this portion of the fatty acid synthesis pathway.
Keywords: Breast Cancer, Metabolomics, NAT1, Palmitoleic Acid, Acetyl-CoA
1 Introduction
It is estimated that in 2016 breast cancer will account for 29% of all new cancer cases diagnosed in women and 14% of all cancer related deaths in women (Siegel et al. 2016). From 2002–2003 there was a sharp decline in breast cancer incidence in non-Hispanic Caucasian women correlating with the decreased use of hormone replacement therapy, but that trend did not continue into the subsequent years (DeSantis et al. 2011). From 2004 to 2010, breast cancer incidence rates have not significantly changed, thus emphasizing the necessity of further investigation into the factors affecting breast cancer risk and progression. A better understanding of the drivers of the heterogeneity in disease risk and progression is needed to enable earlier detection and more precise treatment options.
Human arylamine N-acetyltransferase 1 (NAT1) is a cytosolic phase II xenobiotic metabolizing enzyme that acetylates a wide range of aromatic and heterocyclic amines via a ping-pong bi-bi reaction mechanism (Hein et al. 2000; Hein 2002). Although NAT1 has been shown to be expressed in most tissues, the only known endogenous substrate of NAT1 is p-aminobenzoyl-glutamate (PABA-glu), a folate catabolite (Minchin 1995). Although NAT1 has many exogenous substrates, p-aminobenzoic acid (PABA), an aromatic amine, is most commonly used in NAT1 studies because of its selectivity for NAT1. We suspect NAT1 has other endogenous substrates that have yet to be elucidated, given the extensive tissue distribution and presence in almost all species. Historically, studies investigating the role NAT1 plays in cancer risk and progression have focused on NAT1’s role as a xenobiotic metabolizing enzyme that can deactivate or bioactivate potential carcinogens, but we propose NAT1 affects cancer risk and/or progression through regulation of acetyl coenzyme A (acetyl-CoA). Human NAT1, in addition to metabolizing arylamines and hydrazines through N-, O-, and N,O- acetylation, can also catalyze the direct hydrolysis of acetyl-CoA in the absence of a NAT1 arylamine substrate using folate as a cofactor (Laurieri et al. 2014; Stepp et al., 2015). In this reaction, the folate is not acetylated, instead the acetate released from acetyl-CoA is excreted. This additional function of NAT1 provides support for the hypothesis that NAT1 has an undetermined endogenous role in addition to the role as a xenobiotic metabolizing enzyme.
NAT1 acetylation activity is heterogeneous in humans due to modulation by a plethora of post-translational and environmental factors (Dupret et al. 2005; Buranrat et al. 2007; Rodrigues-Lima et al. 2008; Russell et al. 2009; Ragunathan et al. 2010; Tiang et al. 2010; Sanfins et al. 2011; Butcher and Minchin 2012; Paterson et al. 2011). The exact effect this variance in acetylation activity has on breast cancer risk and progression has been difficult to isolate and study. This is partly because many of the breast cancer cell lines used in research, in addition to having innately different levels of human NAT1 activity, also have many other genetic differences that may confound a study on the effect of varying NAT1 activity. NAT1 activity (measured as acetylated PABA/min/mg of cellular protein) in breast cancer cell lines commonly used in research varies over 1,000 fold between the cell line with the highest activity and the cell line with the lowest activity (Wakefield et al. 2008).
Analysis of publicly available microarray data has shown that differences in NAT1 mRNA levels are associated with specific cancers and cancer subtypes (Butcher and Minchin 2012). Of all cancers, the association between NAT1 and breast cancer has been the most extensively investigated. A microarray study of 66 breast cancer samples revealed NAT1 expression was higher in invasive carcinoma compared with normal tissue (Casey et al. 2009; Butcher and Minchin 2012). Using computational approaches to analyze a previously published microarray dataset containing 89 breast cancer samples, it has been shown that NAT1 is commonly amplified in breast carcinomas (Yuan et al. 2012; Chin et al. 2006). Comparative proteomic analysis of 8 normal breast samples and 25 breast cancer derived tissues revealed NAT1 is elevated in invasive ductal carcinoma (IDC) and invasive lobular carcinoma (ILC) when compared to the normal tissue (Adam et al. 2003). In the same study it was also shown that overexpression of NAT1 in HB4a, conditionally immortalized human mammary luminal epithelial derived cells, enhanced cell growth and resistance to etoposide, a cytotoxic anticancer drug, relative to control cells (Adam et al. 2003). In a study of 107 breast cancer samples, high NAT1 levels in primary tumors were significantly associated with increased metastasis to the bone (Smid et al. 2006). These association studies between NAT1 and breast cancer illuminate the need for further investigation into the role NAT1 has in breast cancer heterogeneity.
Cancer cells characteristically exhibit rapid, uncontrolled growth requiring increased levels of energy and cellular components when compared to normal cells. Reprogramming of cellular metabolism to meet these needs is one of the next generation hallmarks of cancer proposed by Hanahan and Weinberg (2011). Although, the exact mechanism by which cellular metabolism is reprogrammed remains unclear, it is likely specific to each type of cancer and is also influenced by a combination of factors. Preceding this study, metabolomics had not been utilized to investigate how differences in NAT1 alter the abundance distribution of metabolites in breast cancer cells. It is expected that if NAT1 is involved in cancer risk or progression, changes in metabolite abundances would be observed between breast cancer cell lines expressing varying levels of human NAT1 activity that were derived from a single breast cancer cell line. Elucidating these potential changes in cellular metabolic pathways would improve our understanding of the role NAT1 plays in cancer progression, eventually leading to earlier breast cancer detection and/or improved treatment options.
2 Materials and methods
2.1 Metabolomics samples
2.1.1 Construction of MDA-MB-231 cell lines expressing different levels of NAT1
The breast adenocarcinoma cell line, MDA-MB-231, (ATCC Manassas, VA) was cultured in high-glucose Dulbecco’s Modified Eagle Medium (DMEM), with 10% fetal bovine serum, 2 mM glutamine, 100 units penicillin, and 100 μg/mL streptomycin added. The Flp-In™ System (Life Technologies, Grand Island, NY) was used to create a single Flp Recombination Target (FRT) site in the parent MDA-MB-231 cell line according to manufacturer’s instructions. SureSilencing™ NAT1 specific shRNA plasmids and a corresponding scrambled shRNA plasmid were purchased from SA Biosciences (Valencia, CA). Since the SureSilencing™ NAT1 shRNA Clone 3 was the most effective of the four provided by SA Biosciences at silencing NAT1 activity in the MDA-MB-231 cell line, Clone 3 was chosen as the shRNA plasmid that would be used when generating a stable NAT1 knockdown MDA-MB-231 cell line. Next, the shRNA plasmids containing the scrambled and NAT1 clone 3 shRNA sequences were integrated into the pcDNA5/FRT vector from the pGeneclip™ vector, independently. For the construction of the MDA-MB-231 cell line overexpressing NAT1, the NATb/NAT1*4 plasmid in the pcDNA5/FRT vector previously constructed in our lab (Millner et al. 2012) was chosen. The construction of a MDA-MB-231 cell line containing a single FRT site in the transcriptionally active region allowed us to transfect each of the plasmids into the same genetic location in different cells, thus creating three new MDA-MB-231 cell lines whose only difference is the level of NAT1 activity. The pcDNA5/FRT plasmids containing the scrambled shRNA, NAT1 clone 3 shRNA plasmid or NATb/NAT1*4 overexpression plasmid, were co-transfected into the MDA-MB-231 cell line containing the single FRT site with pOG44 (Life Technologies), a Flp recombinase expression plasmid, using Amaxa Cell Line Nucleofector Kit V (Lonza, Basel, Switzerland) following manufacturer’s instructions. Resulting cells were then cultured in complete DMEM media containing 500 μg/mL hygromycin to select for cells that had successfully undergone transfection and stably integrated the pcDNA5/FRT plasmid into their genomic DNA since the pcDNA5/FRT vector contains a hygromycin resistance cassette. Hygromycin resistant colonies were selected approximately two weeks after transfection and isolated using cloning cylinders. The resulting transformed cell lines, “Scrambled”, “Down”, and “Up”, express wild-type (18.9 ± 0.2 nmol PABA acetylated/min/mg protein), decreased (11.6 ± 0.6 nmol PABA acetylated/min/mg protein), and increased (233.9 ± 2.2 nmol PABA acetylated/min/mg protein) NAT1 activity, respectively. Relative to the Scrambled cell line, the Down cell line expressed 50% of the NAT1 mRNA and the Up cell line expressed 3100% of the NAT1 mRNA. The transformed MDA-MB-231 cell lines also have the same genetic background. This removes any potential confounding factors due to genetic differences that would arise if the cell lines that innately have different NAT1 activity, but also different mutations, were used. Construction of the cell lines is illustrated in Fig 1 and detailed in Carlisle (2015).
Fig. 1.

Construction of cell lines used as metabolomics samples. The Flp-In™ System (Life Technologies, Grand Island, NY) was used to insert a single FRT site into the parent MDA-MB-231 cell line. The MDA-MB-231 cell line containing the FRT site was then stably transfected with either a plasmid containing a nonspecific shRNA plasmid into the FRT site (Scrambled), a plasmid containing NAT1 specific shRNA into the FRT site (Down), or a plasmid containing the NATb/NAT1*4 vector into the FRT site (Up). Each plasmid contained a hygromycin resistant cassette therefore cells successfully stably transfected were selected for using hygromycin. The resulting MDA-MB-231 cell lines, Scrambled, Down, and Up, express wild-type, decreased, and increased PABA NAT1 mRNA and enzymatic activity, respectively
2.1.2 Measurement of endogenous acetyl-coenzyme A in the constructed cell lines
Endogenous acetyl-CoA levels of the three transformed MDA-MB-231 cell lines were measured in triplicate via HPLC-UV. Cells were cultured as described above with the addition of 500 μg/mL hygromycin for continued selection of transformed cells. Once cells reached 80% confluence, medium was aspirated from each plate followed by a rinse with 10 mL of 1 × PBS. After removal of the PBS, cells were released from the plate with the addition of 0.5 mL trypsin per plate and then re-suspended in 5 mL of 20% medium and 80% PBS. Cells were then counted via a Coulter automated cell counter. Cell suspensions were then centrifuged in 15 mL tubes for 2.5 minutes at 400 × g at 4°C. Supernatant was removed and cell pellets were re-suspended in 1 mL of cold PBS. Cell suspensions were centrifuged again in 15 mL tubes for 2.5 minutes at 400 × g at 4°C. Cells were transferred and re-suspended in 1 mL of cold PBS. Resulting cell suspensions were then centrifuged at 4°C 300 × g for approximately 5 minutes. Supernatant was removed and cells were lysed in 100 μL of 5% 5-sulfosalicylic acid by pipetting up and down. The resulting suspension was centrifuged at 4°C 15,000 × g for 10 minutes. Supernatant (100 μL) was collected and injected onto a C18 reverse-phase HPLC column (250 mm × 4 mm; 5 μM pore size). Reactants and products were separated and quantitated using a Beckman System Gold high performance liquid chromatography (HPLC) system. HPLC separation of CoA and acetyl-CoA was achieved using a linear gradient of 100:0 sodium phosphate (NaH2PO4) pH 4: methanol to 0:100 sodium phosphate pH 4: methanol over 20 minutes and was quantitated by absorbance at 260 nm. Since the cells were lysed in 5% 5-sulfosalicylic acid, this buffer solution was used as a reference to subtract any background signal or noise coming from the lysis buffer.
2.1.3 Polar metabolite extraction
Cell pellets were collected from eight petri dish replicates per cell line and frozen at −80°C until time of lysis and extraction to be used as metabolomics samples. Each replicate contained approximately five million cells with a wet weight of 20 mg. Polar metabolites were then extracted from each cell pellet replicate independently. The cells were lysed by homogenization in 200 μL of deionized water. Next, samples were mixed using a vortex mixer for 2 minutes after the addition of 800 μL of ice cold methanol. Samples were then incubated on ice for 10 minutes followed by 3 minutes of mixing on the vortex mixer. Next, samples were centrifuged at 12,000 × g for 10 minutes. Supernatant (800 μL) was then transferred to a 1.5 mL eppendorf tube and dried via speed vacuum until dry (roughly three hours). Each dried sample was dissolved in 40 μL methoxyamine hydrochloride solution (20 mg/mL in pyridine) and sonicated for 20 minutes. Methoxymation was carried out at 60°C for 1 hour. After adding 40 μL N-tert-Butyldimethylsilyl-N-methyltrifluoroacetamide (MTBSTFA) (with 1% tert-Butyldimethylchlorosilane (t-BDMCS)), derivatization was carried out at 60°C for 1 hour. Samples were then transferred to GC vials for analysis. The methoxymation and derivatization were performed just before GC×GC-TOF MS analysis.
2.2 Analysis by GC×GC-TOF MS
The LECO Pegasus 4D GC×GC-TOF MS instrument was equipped with an Agilent 6890 gas chromatograph and a Gerstel MPS2 auto-sampler (GERSTEL Inc., Linthicum, MD), featuring a LECO two-stage cryogenic modulator and secondary oven. The primary column was a 60 m × 0.25 mm 1dc × 0.25 μm 1df, DB-5ms GC capillary column (phenyl arylene polymer virtually equivalent to a (5%-phenyl)-methylpolysiloxane). A second GC column of 1 m × 0.25 mm 1dc × 0.25 μm 2df, DB17ms ((50%-phenyl)-methylpolysiloxane) was placed inside the secondary GC oven after the thermal modulator. Both columns were obtained from Agilent Technologies (Agilent Technologies J&W, Santa Clara, CA). The helium carrier gas (99.999% purity) flow rate was set to 2.0 mL/minute at a corrected constant flow via pressure ramps. The inlet temperature was set at 280°C. The primary column temperature was programmed with an initial temperature of 60°C for 30 seconds and then ramped at 5°C/minute to 270°C and maintained for 12 min. The secondary column temperature program was set to an initial temperature of 70°C for 0.5 minutes and then also ramped at the same temperature gradient employed in the first column to 280°C, accordingly. The thermal modulator was set to +15°C relative to the primary oven, and a modulation time of PM = 2 s was used. The mass range was set as 29−800 m/z with an acquisition rate of 200 mass spectra per second. The ion source chamber was set at 230°C with the transfer line temperature of 280°C, and the detector voltage was 1410 V with electron energy of 70 eV. The acceleration voltage was turned on after a solvent delay of 660 s. The split ratio was set at 10:1.
2.3 GC×GC–TOF MS data analysis
The GC×GC-TOF MS data were then processed using LECO’s instrument control software ChromaTOF for peak picking and tentative metabolite identification, followed by retention index matching, peak merging and peak list alignment using software MetPP (Wei et al. 2013). To verify the identification of metabolites detected with significant abundance difference between sample groups, the authentic standards of these metabolites, if commercially available, were analyzed on GC×GC-TOF MS under the same experimental conditions as the biological samples analyzed. A tentative metabolite assignment was considered as a correct identification only if the experimental information of the authentic metabolite agreed with the corresponding information of the chromatographic peak in the biological samples, i.e., difference of the first dimension retention time Δ1tR ≤ 10 s, difference of the second dimension retention time Δ2tR ≤ 0.05 s, and the mass spectral similarity ΔS ≥ 700. All of the metabolites identified and discussed in this journal article are identified to the Metabolomics Standards Initiative (MSI) Level 1.
2.4 Statistical analyses
The data was analyzed using both a univariate and multivariable/multivariate approach (Fig. 2). Imputation, normalization, and univariate statistical significance testing, (student’s t-tests and one-way ANOVA) were performed using R 3.0 (R Core Team, 2015). Given that multiple hypotheses were tested, q-values for preserving False Discovery Rates (FDR) at or below a given threshold were computed from the unadjusted p-values, using the R package qvalue (John Storey). Volcano plots are presented in order to simultaneously assess fold change and significance. Distribution of metabolite abundances are shown by boxplots which represent the median with a central notch and the inter-quartile range as a box. Metabolite abundance fold-change between the Scrambled & Up, Scrambled & Down, and Down & Up groups were calculated using Equation 1 (shown below).
| Equation 1 |
In the equation, FC = fold-change, = average metabolite abundance in the reference group, = average metabolite abundance in the comparison group. A negative sign was added to the fold-change when metabolite abundance was lower in the comparison group compared to the reference group. Log-transformed fold change is represented on the horizontal axis of the volcano plots while the negative-signed log-transformed p-value is represented on the vertical axis. Principal Component Analysis (PCA) was conducted to examine the data in a lower dimensional space. To determine the contributions of multiple metabolites in discriminating between the cell groups, Orthogonal Partial Least Squares Discriminant Analysis (OPLS-DA) were conducted (Bylesjo et al. 2006). The loadings of the first component of the OPLS-DA model was plotted to visualize the contributions. The variance of the metabolite contributions was estimated using a jackknife procedure.
Fig. 2.

Workflow of metabolomics data analyses
2.5 Pathway analysis
We chose to conduct pathway analysis using the Roche Biochemical Pathways chart (F. Hoffmann-La Roche AG, Basel, Switzerland) on only those metabolites that were verified with standards and found to be significant following student’s t-tests and/or one-way ANOVA. We first located all nodes containing acetyl-CoA on the Roche Biochemical Pathways Chart. We then followed pathways to and from acetyl-CoA that led to our identified metabolites. Some metabolites were not located in a node involving acetyl-CoA therefore they have not been considered further at this time. For those that were located in a node involving acetyl-CoA, we then developed hypotheses that could explain how each metabolite’s abundance distribution across the three groups related to the amount of free acetyl-CoA available.
3 Results
Endogenous acetyl-CoA levels were measured via HPLC-UV. The acetyl-CoA levels of the Scrambled, Down, and Up transformed cell lines were found to be 0.046 ± 0.0025 nmoles acetyl-CoA/1 million cells, 0.049 ± 0.0072 nmoles acetyl-CoA/1 million cells, and 0.031 ± 0.0026 nmoles acetyl-CoA/1 million cells, respectively. Significant differences in endogenous acetyl-CoA levels were found between the transformed cell lines with an one-way ANOVA p=0.0218 (Fig. 3). The difference in endogenous acetyl-CoA levels between the Down and Up group was statistically significant (Tukey’s post-hoc t-test p < 0.05).
Fig. 3.

Endogenous acetyl-CoA levels in constructed cell lines. Endogenous levels of acetyl-CoA were measured via HPLC-UV in the three transformed MDA-MB-231 cell lines with n=3. In this figure, Scrambled refers to the MDA-MB-231 cell line that has wild-type levels of NAT1 activity, Down refers to the MDA-MB-231 cell line that has decreased NAT1 activity, and Up refers to the MDA-MB-231 cell line that has increased NAT1 activity. The bars represent results from a single determination in triplicate in nmoles of acetyl-CoA per one million cells ± standard deviation. Endogenous acetyl-CoA was significantly decreased in the Up group compared to the Scrambled and Down groups following one-way ANOVA (p=0.0218) followed by a Tukey’s post-hoc test (p<0.05)
One hundred thirty-two metabolites were detected via GC×GC-TOF MS. All metabolites were given an arbitrary metabolite number (M#) to provide a unique identification given that some metabolites appeared multiple times and others were unnamed. Of all metabolites detected by GC×GC-TOF MS, 52.3% were tentatively identified based on mass spectrum and retention index matching. Following student’s t-tests, 8.3% of metabolites detected by GC×GC-TOF MS had a p-value ≤ 0.05 and were verified with standards (Table 1). Following student’s t-tests, 13.6% of metabolites detected by GC×GC-TOF MS had a q-value ≤ 0.05 but were not verified with standards (Supplementary Table 1).
Table 1. Verified metabolites altered by an increase or decrease in NAT1 activity in breast cancer cells.
Metabolites differed significantly between designated groups following student’s t-test, and were technically validated.
| Metabolite Number | Metabolite | t-test p-value | t-test q-value | Fold Change | 1tR (s) | 2tR (s) | CAS no. | |
|---|---|---|---|---|---|---|---|---|
| Up vs Downa | M73 | L-threonine | 0.0006 | 0.01 | −1.64 | 1745 | 0.992 | 72-19-5 |
| M96 | L-aspartic acid | 0.0008 | 0.01 | 1.44 | 2243 | 0.992 | 56-84-8 | |
| M102 | palmitoleic acid | 0.006 | 0.04 | −1.40 | 2376 | 1.04 | 373-49-9 | |
| M66 | L-valine | <0.0001 | 0.004 | 1.36 | 1640 | 0.928 | 72-18-4 | |
| M69 | L-leucine | 0.0003 | 0.008 | 1.27 | 1693 | 0.918 | 61-90-5 | |
| M103 | L-ornithine | 0.03 | 0.1 | 1.73 | 2376 | 0.962 | 70-26-8 | |
|
| ||||||||
| Down vs Scrambledb | M106 | L-asparagine | 0.002 | 0.02 | −1.54 | 2396 | 1.06 | 70-47-3 |
| M113 | trans-9-octadecenoic acid | 0.01 | 0.07 | −1.90 | 2573 | 1.09 | 112-79-8 | |
|
| ||||||||
| Up vs Scrambledc | M73 | L-threonine | 0.0009 | 0.01 | −1.62 | 1745 | 0.992 | 72-19-5 |
| M102 | palmitoleic acid | 0.001 | 0.02 | −1.57 | 2376 | 1.04 | 373-49-9 | |
| M106 | L-asparagine | 0.002 | 0.02 | −1.53 | 2396 | 1.06 | 70-47-3 | |
| M69 | L-leucine | 0.001 | 0.02 | 1.21 | 1693 | 0.918 | 61-90-5 | |
Down is the reference group, therefore a positive fold change indicates that metabolite was higher in the Up group whereas a negative value indicates the metabolite was lower in the Up group.
Scrambled is the reference group, therefore a positive fold change indicates that metabolite was higher in the Down group whereas a negative value indicates the metabolite was lower in the Down group.
Scrambled is the reference group, therefore a positive fold change indicates that metabolite was higher in the Up group whereas a negative value indicates the metabolite was lower in the Up group. T-test q-values were calculated to adjust p-values for the multiple comparisons we are testing. 1tR is the first dimension retention time in seconds and 2tR is the second dimension retention time. The CAS number is a unique numerical identifier assigned to chemical compounds by the Chemical Abstracts Service (CAS).
Most of the statistically significant metabolites are amino acids. Three metabolites, L-asparagine, palmitoleic acid, and L-leucine were found to be significantly different between groups in two student’s t-test comparisons. Following one-way ANOVA, 29.0% of tentatively identified metabolites had a p ≤ 0.05 (Supplementary Table 2). After technical validation, only 7.6% of metabolites had a one-way ANOVA p ≤ 0.05 and were verified with standards (Table 2). Of the metabolites we submitted for technical validation, 52.3% were either misidentified or had no standard available for comparison.
Table 2. Verified metabolites altered by an increase and decrease in NAT1 activity in breast cancer cells.
Ten metabolites were found to differ significantly across groups following a one-way ANOVA and were also technically validated with standards. These metabolites were included in subsequent pathway analysis. ANOVA q-values were calculated to adjust p-values for the multiple comparisons we are testing. 1tR is the first dimension retention time in seconds and 2tR is the second dimension retention time. The CAS number is a unique numerical identifier assigned to chemical compounds by the Chemical Abstracts Service (CAS).
| Metabolite Number | Metabolite | ANOVA p-value | ANOVA q-value | 1tR (s) | 2tR (s) | CAS no. |
|---|---|---|---|---|---|---|
| M73 | L-threonine | 0.0002 | 0.0009 | 1745 | 0.992 | 72-19-5 |
| M106 | L-asparagine | 0.002 | 0.003 | 2396 | 1.06 | 70-47-3 |
| M66 | L-valine | <0.0001 | 0.0004 | 1640 | 0.928 | 72-18-4 |
| M69 | L-leucine | <0.0001 | 0.0004 | 1693 | 0.918 | 61-90-5 |
| M96 | L-aspartic acid | 0.0008 | 0.002 | 2243 | 0.992 | 56-84-8 |
| M84 | L-methionine | 0.05 | 0.03 | 2034 | 1.05 | 63-68-3 |
| M102 | palmitoleic acid | 0.0001 | 0.0006 | 2376 | 1.04 | 373-49-9 |
| M65 | beta alanine | 0.03 | 0.02 | 1626 | 0.960 | 107-95-9 |
| M77 | L-proline | 0.04 | 0.03 | 1789 | 1.02 | 147-85-3 |
| M80 | glycerol | 0.02 | 0.02 | 1921 | 0.875 | 56-81-5 |
After stratification of the metabolites by student’s t-test p-value and fold-change via volcano plots, it was observed that L-asparagine and trans-9-octadeconic acid had both a p-value ≤ 0.05 and a fold-change of at least ± 1.5 between the Scrambled and Down groups (Fig. 4a); between the Scrambled and Up groups, L-threonine, palmitoleic acid, and L-asparagine had both a p-value ≤ 0.05 and a fold-change of at least ± 1.5 (Fig. 4b). From the volcano plot comparing the Down and Up groups, L-threonine and L-ornithine had both a p-value ≤ 0.05 and a fold-change of at least ±1.5 (Fig. 4c). In the volcano plots, only those metabolites that were verified with standards and had a p-value ≤ 0.05 were labeled.
Fig. 4.

Volcano plots comparing Scrambled vs Down (a), Scrambled vs Up (b), and Down vs Up (c). Fold-change of metabolite abundance was calculated and plotted versus unadjusted student’s t-test p-values to compare the transformed cell lines. In this figure, Scrambled refers to the MDA-MB-231 cell line that has wild-type levels of NAT1 activity, Down refers to the MDA-MB-231 cell line that has decreased NAT1 activity, and Up refers to the MDA-MB-231 cell line that has increased NAT1 activity. Metabolites located at the top left and top right of each plot indicate that metabolite has both a substantial fold-change and a significant p-value. The dotted vertical blue lines indicate a fold-change of ± 1.5
Box plots are presented for all metabolites that were identified as significant and had a fold change of ± 1.5 between at least 2 of the groups. The metabolites L-leucine, L-aspartic acid, and L-valine display the same abundance distribution pattern between the Scrambled, Down, and Up groups although there is significant overlap between the abundance distribution of L-aspartic acid in the Up and Scrambled groups (Fig. 5). In general terms, the Down group has the lowest abundance, the Scrambled group has a mid-level abundance, and the Up group has the highest abundance. The box plot for palmitoleic acid shows that the Up group has the lowest abundance while the Scrambled group has the highest abundance (Fig. 6). Of the seven amino acids that are degraded to acetyl-CoA, only L-leucine, L-tyrosine, and L-threonine were verified with standards and showed a significant difference in abundance distribution between the three groups although the metabolite abundance distribution does not follow the same pattern between the three amino acids (Fig. 7).
Fig. 5.

Box plots showing median scaled abundances of (a) L-leucine, (b) L-aspartic acid, and (c) L-valine. In this figure, Scrambled refers to the MDA-MB-231 cell line that has wild-type levels of NAT1 activity, Down refers to the MDA-MB-231 cell line that has decreased NAT1 activity, and Up refers to the MDA-MB-231 cell line that has increased NAT1 activity. Abundances were median scaled for each metabolite. Boxplots represent the median with a central notch, the inter-quartile range as a box, and the open dots represent outliers. These three metabolites all follow the same pattern of abundance distribution
Fig. 6.

Box plot showing median scaled abundances of palmitoleic acid. In this figure, Scrambled refers to the MDA-MB-231 cell line that has wild-type levels of NAT1 activity, Down refers to the MDA-MB-231 cell line that has decreased NAT1 activity, and Up refers to the MDA-MB-231 cell line that has increased NAT1 activity. Boxplots represent the median with a central notch, the inter-quartile range as a box, and the open dots represent outliers. Abundances were median scaled
Fig. 7.

Box plots showing median scaled abundances of (a) L-leucine, (b) L-tyrosine, and (c)&(d) L-threonine. In this figure, Scrambled refers to the MDA-MB-231 cell line that has wild-type levels of NAT1 activity, Down refers to the MDA-MB-231 cell line that has decreased NAT1 activity, and Up refers to the MDA-MB-231 cell line that has increased NAT1 activity. Boxplots represent the median with a central notch, the inter-quartile range as a box, and the open dots represent outliers. Abundances were median scaled for each metabolite. L-leucine and L-tyrosine exhibit the same distribution pattern with metabolite levels increased in the Up group when compared to the Scrambled and Down groups. The two L-threonine box plots represent different derivitazation forms of that amino acid
The goal of using multivariate/multivariable analyses methods is to identify groups of metabolites that together are driving between group variation versus within-group variation. Principal component analysis (PCA) demonstrated that the metabolic profile of the Scrambled cell line was intermediate to that of the Up and Down cell lines (Fig. 8).
Fig. 8.

Principal component analysis. Two component PCA explained 40% of the total variance. In this figure, S (in black) refers to the MDA-MB-231 cell line that has wild-type levels of NAT1 activity, D (in blue) refers to the MDA-MB-231 cell line that has decreased NAT1 activity, and U (in red) refers to the MDA-MB-231 cell line that has increased NAT1 activity. The number following each letter indicates the individual replicate number. Each component on the axes represents a linear combination of all metabolites
Two component Orthogonal Partial Least Squares-Discriminant Analysis (OPLS-DA) showed complete group separation where the first component explained group predictive variation and the second component explained variation uncorrelated with group membership (Fig 9).
Fig. 9.

Orthogonal partial least squares- discriminant analysis. OPLS-DA achieved complete separation between groups. In this figure, S (in black) refers to the MDA-MB-231 cell line that has wild-type levels of NAT1 activity, D (in blue) refers to the MDA-MB-231 cell line that has decreased NAT1 activity, and U (in red) refers to the MDA-MB-231 cell line that has increased NAT1 activity. The number following each letter indicates the individual sample number. Each component represents a linear combination of all metabolites
Since the first component of the OPLS-DA model explained between group variance, the loadings of the first component were plotted to identify the metabolites that contributed most to explaining the separation between groups (Fig. 10). The loadings of the first component demonstrated that L-threonine, L-methionine, and palmitoleic acid are key drivers of the separation between the groups and are higher in the Down group and conversely lower in the Up group. The loadings of the first component from OPLS-DA also show L-valine, L-leucine, and L-aspartic acid explained the separation between the groups but are higher in the Up group and conversely lower in the Down group.
Fig. 10.
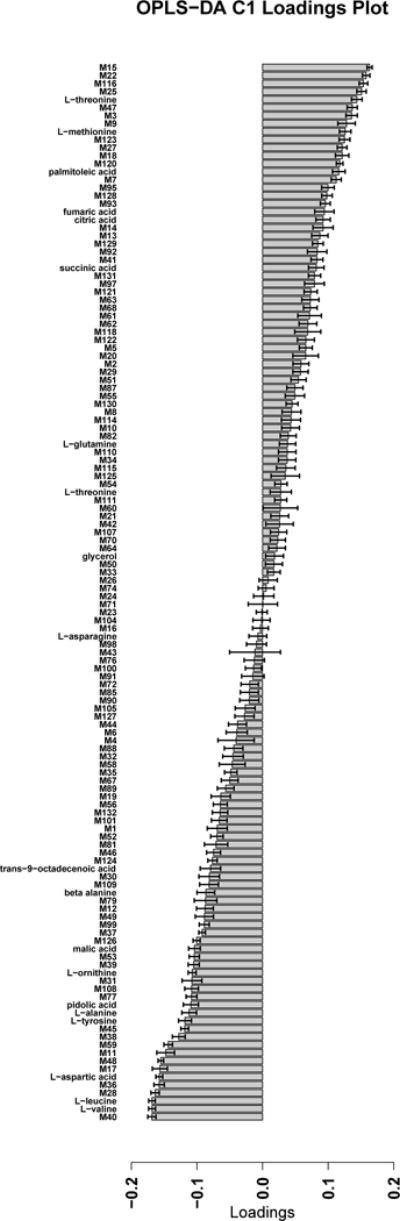
Jack-knife loadings plot of OPLS-DA. The metabolites at the extremes of the plot are the largest contributors to the separation of the groups in the OPLS-DA model. Error bars represent mean ± SD
4 Discussion
The purpose of this untargeted metabolomics study was to identify metabolic changes induced by varying levels of human NAT1 in MDA-MB-231 breast cancer cells and use that information to formulate hypotheses. From our results we hypothesize that cellular pathways are altered between MDA-MB-231 breast cancer cells that express varying levels of human NAT1 due to differences in the amount of free acetyl-CoA available. Acetyl-CoA is a central mediator of many cellular pathways including fatty acid synthesis and degradation, ketone body and isoprenoid synthesis and mobilization, and the TCA cycle. Our original hypothesis was that changing the level of NAT1 activity would change the level of free acetyl-CoA available and this change in acetyl-CoA levels would thus induce alterations in cellular pathways. We have observed that acetyl-CoA is significantly decreased in the Up group when compared to the Scrambled and Down groups (Figure 3). The mechanism(s) by which acetyl-CoA is decreased may result from NAT1-catalyzed hydrolysis but this remains to be determined in future studies. Consistent with this hypothesis, we began the pathway analysis portion of this study by first following pathways that involved acetyl-CoA and identifying where the metabolites that were classified as significant and verified with standards were located in those pathways. We then applied our hypothesis to see if the change in abundance of metabolite is biologically plausible. We found the abundance of palmitoleic acid to be decreased in the Up group when compared to the Scrambled group with a student’s t-test q-value < 0.02 and a fold change of 1.57. Our refined hypothesis is that acetyl-CoA hydrolysis by NAT1 is increased in the Up group compared to the Scrambled group, leaving less free acetyl-CoA available for other reactions.
We expected to see an increase in the flux of acetyl-CoA through the fatty acid synthesis pathway in the cell line that had increased NAT1 activity since cancer cells require increased amounts of cellular components and energy due to their rapidly dividing nature and overexpression of NAT1 in cell lines has been shown to increase cell growth and invasion. The fatty acid synthesis pathway (Fig. 11) begins with the synthesis of malonyl-CoA by acetyl-CoA carboxylase (ACC) from acetyl-CoA and bicarbonate. Acetyl-CoA carboxylase (ACC) is a biotin-dependent enzyme that catalyzes the irreversible carboxylation of acetyl-CoA to produce malonyl-CoA through its two catalytic activities. In the next step of fatty acid synthesis, malonyl-CoA and acetyl-CoA are combined by fatty acid synthase I (FAS1) to form palmitate (16:0). Palmitate is a branch point in the fatty acid synthesis pathway. Either stearate (18:0) or palmitoleic acid (16:1 (Δ9)) can be synthesized from palmitate. Palmitoleic acid is synthesized from palmitate by fatty acyl-CoA desaturase. Palmitate negatively feeds back on acetyl-CoA carboxylase (ACC) thus preventing further palmitate generation. In this study we observed a decrease in the abundance of palmitoleic acid (16:1 (Δ9)) when NAT1 activity was increased. We now propose that the abundance of palmitoleic acid is decreased in the cell line that has increased NAT1 activity because there is less free acetyl-CoA available. Therefore, palmitate is selectively shunted to the other branch of the fatty acid synthesis pathway, which synthesizes stearate. From stearate, longer saturated fatty acids are synthesized. In a cell that is rapidly dividing, the synthesis of stearate may be more important than the synthesis of palmitoleic acid, which is an end point in the pathway. Unfortunately, stearate was not one of the metabolites detected by GC×GC TOF-MS analysis. This may be because it is not present in the samples or is present at levels below the limit of detection. Palmitoleic acid was the only fatty acid detected by GC×GC TOF-MS and verified with a standard. We are currently in the process of performing a more robust metabolomics analysis of our sample groups that should identify more metabolites.
Fig. 11.
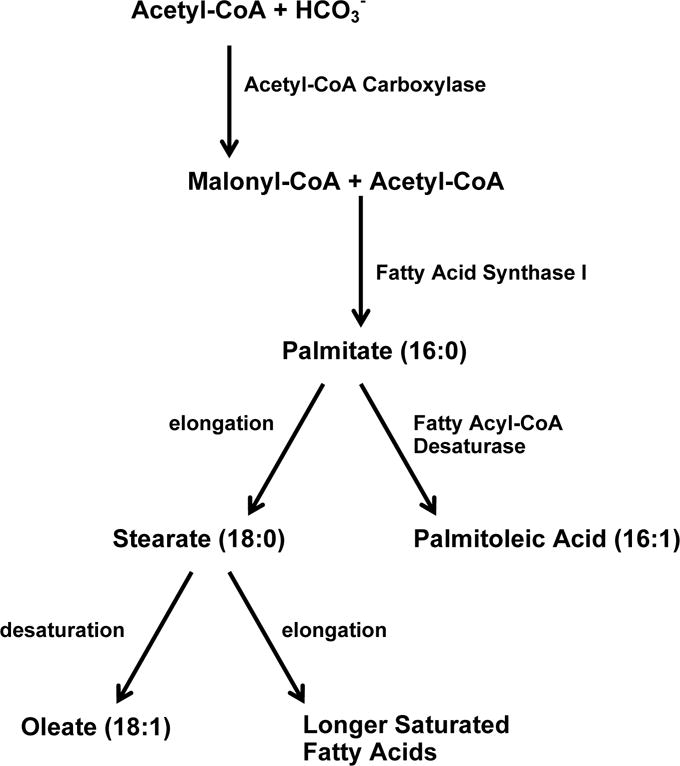
Abbreviated fatty acid synthesis pathway. This pathway shows the utilization of Acetyl-CoA in the fatty acid synthesis pathway. Palmitoleic acid is synthesized from palmitate by the enzyme fatty acyl-CoA desaturase. Palmitate can also be elongated to form stearate which can then be further elongated to form longer saturated fatty acids. The numbers in parentheses next to the names of the fatty acids are lipid numbers which have the form C:D, where C is the number of carbon atoms and D is the number of double bonds in the fatty acid
There are seven amino acids that are degraded to acetyl-CoA; 1. tryptophan, 2. lysine, 3. phenylalanine, 4. tyrosine, 5. leucine, 6. isoleucine, and 7. threonine. If our hypothesis that different levels of human NAT1 in the MDA-MB-231 cells lead to altered levels of acetyl-CoA and these altered levels of acetyl-CoA lead to alterations in cellular pathways is correct, it is plausible that there could be increased or decreased degradation of one or more of these seven amino acids to compensate for the altered levels of acetyl-CoA. In our data, leucine, tyrosine, and threonine were verified with standards and showed a significant difference in abundance distribution between the three groups. Of those three amino acids, leucine and tyrosine had the same relative abundance distribution pattern suggesting there may be a shared mechanism by which these metabolites are being regulated.
In our data there were several misidentified or unknown metabolites that were statistically significant (Supplementary Tables 1 and 2). One such metabolite, M116, with a one-way ANOVA p < 0.0001 was initially identified as L-glutamine but was later shown to be misidentified by comparison to the L-glutamine standard. Unfortunately, there is currently no method to retroactively identify these metabolites with confidence; we can only see that they are misidentified. As a result we may be missing important metabolites that could provide a key link between varying levels of NAT1 and altered cellular metabolism. As the field of metabolomics progresses, libraries containing spectral data of metabolites, such as the METLIN Metabolomics Database, are quickly growing. The number of metabolites with MS/MS spectra in METLIN has more than octupled from 2008 to 2016. This increase in metabolites with spectra in metabolomics databases will lead to a larger number of correctly identified metabolites in future studies.
Given our hypothesis, we expected the abundance distribution of any metabolite that is changed, as a result of NAT1, to be increased and decreased or decreased and increased in the Up and Down groups respectively when compared to the abundance of the metabolite in the Scrambled group. Since we did not observe this in the data collected, there may be different compensatory mechanisms for each metabolite regulating the amount of acetyl-CoA. Also, there may be a separate threshold for each metabolite in the amount of acetyl-CoA that must be altered in order for a change in metabolite abundance to be observed.
In summary, our data suggest a link between increased levels of NAT1 activity and decreased flux of acetyl-CoA through the fatty acid synthesis pathway. Further studies to explore this link are needed and are in progress.
Supplementary Material
Footnotes
Conflict of interest
The authors declare that they have no conflict of interest.
Research involving human participants and/or animals
No studies contained in this article involved human participants or animals. Informed consents were not required for this study.
References
- Adam PJ, Berry J, Loader JA, Tyson KL, Craggs G, Smith P, et al. Arylamine N-acetyltransferase-1 is highly expressed in breast cancers and conveys enhanced growth and resistance to etoposide in vitro. Mol Cancer Res. 2003;1(11):826–835. [PubMed] [Google Scholar]
- Buranrat B, Prawan A, Sripa B, Kukongviriyapan V. Inflammatory cytokines suppress arylamine N-acetyltransferase 1 in cholangiocarcinoma cells. World J Gastroenterol. 2007;13(46):6219–6225. doi: 10.3748/wjg.v13.i46.6219. [DOI] [PMC free article] [PubMed] [Google Scholar]
- Butcher NJ, Minchin RF. Arylamine N-acetyltransferase 1: a novel drug target in cancer development. Pharmacol Rev. 2012;64(1):147–165. doi: 10.1124/pr.110.004275. [DOI] [PubMed] [Google Scholar]
- Bylesjo M, Rantalainen M, Cloarec O, Nicholson JK, Holmes E, Trygg J. OPLS discriminant analysis: combining the strengths of PLS-DA and SIMCA classification. Journal of Chemometrics. 2006;20(8–10):341–351. doi: 10.1002/cem.1006. [DOI] [Google Scholar]
- Carlisle SM. Master’s Thesis, University of Louisville, Electronic Theses and Dissertations. 2015. Metabolomics of transformed MDA-MB-231 cell lines expressing different levels of human arylamine N-acetyltransferase 1 (NAT1) [Google Scholar]
- Casey T, Bond J, Tighe S, Hunter T, Lintault L, Patel O, et al. Molecular signatures suggest a major role for stromal cells in development of invasive breast cancer. Breast Cancer Res Treat. 2009;114(1):47–62. doi: 10.1007/s10549-008-9982-8. [DOI] [PubMed] [Google Scholar]
- Chin K, DeVries S, Fridlyand J, Spellman PT, Roydasgupta R, Kuo WL, et al. Genomic and transcriptional aberrations linked to breast cancer pathophysiologies. Cancer Cell. 2006;10(6):529–541. doi: 10.1016/j.ccr.2006.10.009. [DOI] [PubMed] [Google Scholar]
- DeSantis C, Howlader N, Cronin KA, Jemal A. Breast cancer incidence rates in U.S. women are no longer declining. Cancer Epidemiol Biomarkers Prev. 2011;20(5):733–739. doi: 10.1158/1055-9965.EPI-11-0061. [DOI] [PubMed] [Google Scholar]
- Dupret JM, Dairou J, Atmane N, Rodrigues-Lima F. Inactivation of human arylamine N-acetyltransferase 1 by hydrogen peroxide and peroxynitrite. Methods Enzymol. 2005;400:215–229. doi: 10.1016/S0076-6879(05)00012-1. [DOI] [PubMed] [Google Scholar]
- Hanahan D, Weinberg RA. Hallmarks of cancer: the next generation. Cell. 2011;144(5):646–674. doi: 10.1016/j.cell.2011.02.013. [DOI] [PubMed] [Google Scholar]
- Hein DW. Molecular genetics and function of NAT1 and NAT2: role in aromatic amine metabolism and carcinogenesis. Mutat Res. 2002;506–507:65–77. doi: 10.1016/s0027-5107(02)00153-7. [DOI] [PubMed] [Google Scholar]
- Hein DW, Doll MA, Fretland AJ, Leff MA, Webb SJ, Xiao GH, et al. Molecular genetics and epidemiology of the NAT1 and NAT2 acetylation polymorphisms. Cancer Epidemiol Biomarkers Prev. 2000;9(1):29–42. [PubMed] [Google Scholar]
- Laurieri N, Dairou J, Egleton JE, Stanley LA, Russell AJ, Dupret JM, et al. From arylamine N-acetyltransferase to folate-dependent acetyl CoA hydrolase: impact of folic acid on the activity of (HUMAN)NAT1 and its homologue (MOUSE)NAT2. PLoS One. 2014;9(5):e96370. doi: 10.1371/journal.pone.0096370. [DOI] [PMC free article] [PubMed] [Google Scholar]
- Millner LM, Doll MA, Cai J, States JC, Hein DW. NATb/NAT1*4 promotes greater arylamine N-acetyltransferase 1 mediated DNA adducts and mutations than NATa/NAT1*4 following exposure to 4-aminobiphenyl. Mol Carcinog. 2012;51(8):636–646. doi: 10.1002/mc.20836. [DOI] [PMC free article] [PubMed] [Google Scholar]
- Minchin RF. Acetylation of p-aminobenzoylglutamate, a folic acid catabolite, by recombinant human arylamine N-acetyltransferase and U937 cells. Biochem J. 1995;307(Pt 1):1–3. doi: 10.1042/bj3070001. [DOI] [PMC free article] [PubMed] [Google Scholar]
- Paterson S, Sin KL, Tiang JM, Minchin RF, Butcher NJ. Histone deacetylase inhibitors increase human arylamine N-acetyltransferase-1 expression in human tumor cells. Drug Metab Dispos. 2011;39(1):77–82. doi: 10.1124/dmd.110.036202. [DOI] [PubMed] [Google Scholar]
- Ragunathan N, Dairou J, Sanfins E, Busi F, Noll C, Janel N, et al. Cadmium alters the biotransformation of carcinogenic aromatic amines by arylamine N-acetyltransferase xenobiotic-metabolizing enzymes: molecular, cellular, and in vivo studies. Environ Health Perspect. 2010;118(12):1685–1691. doi: 10.1289/ehp.1002334. [DOI] [PMC free article] [PubMed] [Google Scholar]
- Rodrigues-Lima F, Dairou J, Dupret JM. Effect of environmental substances on the activity of arylamine N-acetyltransferases. Curr Drug Metab. 2008;9(6):505–509. doi: 10.2174/138920008784892092. [DOI] [PubMed] [Google Scholar]
- Russell AJ, Westwood IM, Crawford MH, Robinson J, Kawamura A, Redfield C, et al. Selective small molecule inhibitors of the potential breast cancer marker, human arylamine N-acetyltransferase 1, and its murine homologue, mouse arylamine N-acetyltransferase 2. Bioorg Med Chem. 2009;17(2):905–918. doi: 10.1016/j.bmc.2008.11.032. [DOI] [PubMed] [Google Scholar]
- Sanfins E, Dairou J, Hussain S, Busi F, Chaffotte AF, Rodrigues-Lima F, et al. Carbon black nanoparticles impair acetylation of aromatic amine carcinogens through inactivation of arylamine N-acetyltransferase enzymes. ACS Nano. 2011;5(6):4504–4511. doi: 10.1021/nn103534d. [DOI] [PubMed] [Google Scholar]
- Siegel RL, Miller KD, Jemal A. Cancer statistics, 2016. CA Cancer J Clin. 2016;66(1):7–30. doi: 10.3322/caac.21332. [DOI] [PubMed] [Google Scholar]
- Smid M, Wang Y, Klijn JG, Sieuwerts AM, Zhang Y, Atkins D, et al. Genes associated with breast cancer metastatic to bone. J Clin Oncol. 2006;24(15):2261–2267. doi: 10.1200/JCO.2005.03.8802. [DOI] [PubMed] [Google Scholar]
- Stepp MW, Mamaliga G, Doll MA, States JC, Hein DW. Folate-Dependent Hydrolysis of Acetyl-Coenzyme A by Recombinant Human and Rodent Arylamine N-Acetyltransferases. Biochem Biophys Rep. 2015;3:45–50. doi: 10.1016/j.bbrep.2015.07.011. [DOI] [PMC free article] [PubMed] [Google Scholar]
- Tiang JM, Butcher NJ, Minchin RF. Small molecule inhibition of arylamine N-acetyltransferase Type I inhibits proliferation and invasiveness of MDA-MB-231 breast cancer cells. Biochem Biophys Res Commun. 2010;393(1):95–100. doi: 10.1016/j.bbrc.2010.01.087. [DOI] [PubMed] [Google Scholar]
- Wakefield L, Robinson J, Long H, Ibbitt JC, Cooke S, Hurst HC, et al. Arylamine N-acetyltransferase 1 expression in breast cancer cell lines: a potential marker in estrogen receptor-positive tumors. Genes Chromosomes Cancer. 2008;47(2):118–126. doi: 10.1002/gcc.20512. [DOI] [PubMed] [Google Scholar]
- Wei X, Shi X, Koo I, Kim S, Schmidt RH, Arteel GE, et al. MetPP: a computational platform for comprehensive two-dimensional gas chromatography time-of-flight mass spectrometry-based metabolomics. Bioinformatics. 2013;29(14):1786–1792. doi: 10.1093/bioinformatics/btt275. [DOI] [PMC free article] [PubMed] [Google Scholar]
- Yuan Y, Curtis C, Caldas C, Markowetz F. A sparse regulatory network of copy-number driven gene expression reveals putative breast cancer oncogenes. IEEE/ACM Trans Comput Biol Bioinform. 2012;9(4):947–954. doi: 10.1109/TCBB.2011.105. [DOI] [PubMed] [Google Scholar]
Associated Data
This section collects any data citations, data availability statements, or supplementary materials included in this article.