

Abstract
IMPORTANCE
Cardiovascular risk assessment is a fundamental component of prevention of cardiovascular disease (CVD). However, commonly used prediction models have been formulated in primarily or exclusively white populations. Whether risk assessment in black adults is dissimilar to that in white adults is uncertain.
OBJECTIVES
To develop and validate risk prediction models for CVD incidence in black adults, incorporating standard risk factors, biomarkers, and subclinical disease.
DESIGN, SETTING, AND PARTICIPANTS
The Jackson Heart Study (JHS), a longitudinal community-based study of 5301 black adults in Jackson, Mississippi. Inclusive study dates were the date of a participant’s first visit (September 2000 to March 2004) to December 31, 2011. The median (75th percentile) follow-up was 9.1 (9.7) years. The dates of the analysis were August 2013 to May 2015. Measurements included standard risk factors, including age, sex, body mass index, systolic and diastolic blood pressure, ratio of fasting total cholesterol to high-density lipoprotein cholesterol, estimated glomerular filtration rate, antihypertensive therapy, diabetes mellitus, and smoking; blood biomarkers; and subclinical disease measures, including ankle-brachial index, carotid intimal-medial thickness, and echocardiographic left ventricular hypertrophy and systolic dysfunction.
MAIN OUTCOMES AND MEASURES
Incident CVD event was defined as the first occurrence of myocardial infarction, coronary heart disease death, congestive heart failure, stroke, incident angina, or intermittent claudication. Model performance was compared with the American College of Cardiology/American Heart Association (ACC/AHA) CVD risk algorithm and the Framingham Risk Score (FHS) refitted to the JHS data and evaluated in the Atherosclerosis Risk in Communities (ARIC) and Multi-Ethnic Study of Atherosclerosis cohorts.
RESULTS
The study cohort comprised 3689 participants with mean (SD) age at baseline was 53 (11) years, and 64.8% (n = 2390) were female. Over a median of 9.1 years, 270 participants (166 women) experienced a first CVD event. A simple combination of standard CVD risk factors, B-type natriuretic peptide, and ankle-brachial index (model 6) yielded modest improvement over a model without B-type natriuretic peptide and ankle-brachial index (C statistic, 0.79; 95% CI, 0.75–0.83 [relative integrated discrimination improvement, 0.22; 95% CI, 0.15–0.30]). However, the reclassification improvement was not substantially different between model 6 and the ACC/AHA CVD Pooled Cohort risk equations or between model 6 and the FHS. The models discriminated reasonably well in the ARIC and Multi-Ethnic Study of Atherosclerosis data (C statistic range, 0.70–0.77).
CONCLUSIONS AND RELEVANCE
Our findings using the JHS data in the present study are valuable because they confirm that current FHS and ACC/AHA risk algorithms work well in black individuals and are not easily improved on. A unique risk calculator for black adults may not be necessary.
Compared with non-Hispanic white adults, black adults have a higher risk of myocardial infarction1 and congestive heart failure (CHF)2,3 and a 2-fold greater risk of stroke1 and peripheral arterial disease (PAD). Therefore, prediction and prevention of cardiovascular disease (CVD) in black adults is a public health priority.
One fundamental gap of knowledge in the medical literature is the paucity of data on the summated risk of all CVD events in black adults, rather than just of individual CVD components, such as coronary heart disease (CHD), PAD, or CHF.4–10 Data are limited regarding risk prediction models in black adults that focus on all CVD (general CVD risk prediction), analogous to similar algorithms available in white adults, such as in the Framingham Heart Study (FHS).11,12
Our major hypothesis in the present investigation was that novel biomarkers and subclinical disease measures offer incremental predictive usefulness over standard CVD risk factors for predicting CVD risk in black adults. We also posited that a parsimonious combination of risk factors, a few novel biomarkers, and select subclinical disease measures will offer an efficient approach to CVD risk prediction in this group. We tested these hypotheses in the community-based Jackson Heart Study (JHS). In addition, we compared the best prediction models with the performance of the 2013 American College of Cardiology/American Heart Association (ACC/AHA) CVD Pooled Cohort risk equations.13
Methods
Study Sample
The study sample consisted of participants in the JHS14 who attended their first examination cycle between September 2000 and March 2004. Race/ethnicity in the JHS was determined by self-report and confirmed using the Household Enumeration Form. The JHS recruited 5301 self-identified black adults from the tricounty area (Hinds, Rankin, and Madison counties) that includes the city of Jackson, Mississippi. Approximately 30% were surviving members of the JHS cohort of the Atherosclerosis Risk in Communities (ARIC) study.15
For the present investigation, participants were eligible if they attended examination 1 and had available data on key covariates considered for prediction models (Figure 1). Written informed consent was obtained from all study participants, and the research protocol was approved by the institutional review board of the University of Mississippi Medical Center for the JHS.
Figure 1. Study Design.
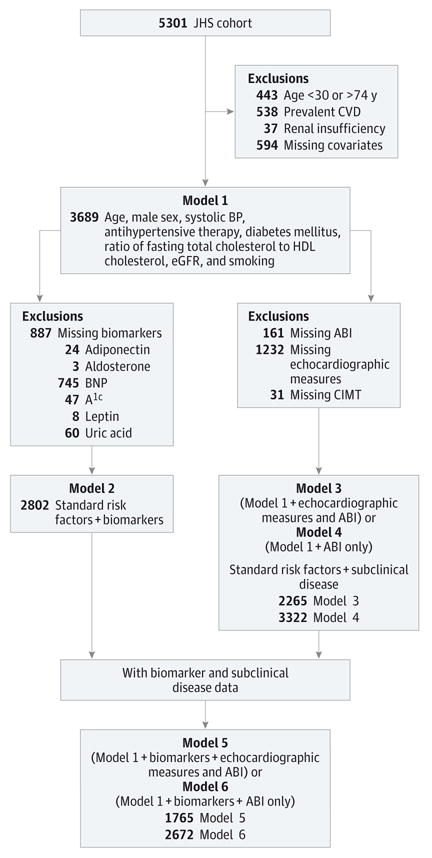
Model 1 includes standard cardiovascular disease (CVD) risk factors only. Model 2 includes significant standard CVD risk factors plus significant biomarkers selected from a total of 10 circulation biomarkers representing various pathways. Model 3 includes significant standard CVD risk factors plus selected subclinical diseases selected from echocardiographic measures and ankle-brachial index (ABI). Model 4 includes significant standard risk factors plus ABI only. Model 5 includes significant standard CVD risk factors plus significant biomarkers and subclinical disease. Model 6 includes significant standard CVD risk factors plus B-type natriuretic peptide (BNP) and ABI. A1c indicates glycated hemoglobin; BP, blood pressure; CIMT, carotid intimal-medial thickness; eGFR, estimated glomerular filtration rate; HDL; high-density lipoprotein; and JHS, Jackson Health Study.
Standard Risk Factors
For the present investigation, we evaluated the following standard CVD risk factors reported in the literature to be associated with CVD risk in black adults: age, sex, body mass index, systolic blood pressure (BP), antihypertensive therapy, diabetes mellitus status (yes or no), ratio of fasting total cholesterol to high-density lipoprotein cholesterol, current smoking status (yes or no), and estimated glomerular filtration rate (calculated using the Chronic Kidney Disease Epidemiology Collaboration equations16).
Blood Biomarkers
In the investigation, the following circulating biomarkers representing distinctive biological pathways and that were available at the first examination in the JHS were considered: adiposity (adiponectin and leptin), neurohormonal activation (aldosterone, B-type natriuretic peptide [BNP], and cortisol), inflammation (high-sensitivity C-reactive protein [hs-CRP]), endothelial function (endothelin and homocysteine), glycemic control (glycated hemoglobin), and insulin resistance (the homeostasis model assessment of insulin resistance [HOMA-IR]). Most of these biomarkers have been reported to be associated with CVD either individually or as part of a multimarker risk score.17–19
Plasma aldosterone was measured by radioimmunoassay (intra-assay coefficient of variation for high and low concentrations, 8.7% and 6.2%, respectively). Circulating BNP and cortisol levels were measured by chemiluminescent immunoassay performed on an immunoassay system (ADVIA Centaur; Siemens) (intra-assay coefficient of variation, 4.2%, 3.1%, and 3.4% for 3 BNP concentrations, respectively, and 9.1% and 7.7% for high and low cortisol concentrations, respectively). The hs-CRP was measured by the latex particle immunoturbidimetric assay (ITA; Roche Diagnostics) (intra-assay coefficient of variation,4.5%). Enzyme-linked immunosorbent assay methods were used to measure endothelin (intra-assay coefficient of variation range, 9.3%–19.1%). Insulin resistance was calculated using the following formula for HOMA-IR: HOMA-IR (Mass Units) = Fasting Plasma Insulin (Microunits per Liter) × [Fasting Plasma Glucose (Millimoles per Liter)/22.5]. Homocysteine was measured by the fluorescence polarization immunoassay (IMx; Abbott) (intra-assay coefficient of variation, 4.6%, 3.2%, and 2.1%, respectively, for 3 homocysteine concentrations). Leptin levels were measured by radioimmunoassay using the double-antibody/polyethylene glycol technique (Human Leptin RIA; EMD Millipore) (intra-assay coefficient of variation, 10%).
Subclinical Disease Variables
Ankle-Brachial Index
To determine the ankle-brachial index (ABI), systolic BP measurements were obtained at the ankle on each lower extremity twice. The systolic BP was also measured twice in the brachial artery on the right arm. Two ABIs (one for the right and one for the left lower extremity) were calculated as the mean of the 2 measurements of ankle systolic BP divided by the mean of the brachial BP readings obtained twice. The lower of the 2 ABIs was considered the ABI for the participant. Those with an ankle systolic BP exceeding 75 mm Hg above the brachial systolic BP were excluded to avoid falsely elevated ABIs due to noncompressibility.20
Carotid Intimal-Medial Thickness
To determine the carotid intimal-medial thickness (CIMT), 3 segments of the carotid artery were imaged bilaterally using a 7.5-MHz transducer on an ultrasound machine(SONOS4500; Hewlett Packard). The CIMT was defined as the mean of the far wall IMT measurements of the common carotid, bifurcation carotid, and internal carotid bilaterally. Participants whose summary measures were in the upper pooled 10th percentile of CIMT were compared with participants whose summary measures were below the upper pooled 10th percentile.
Echocardiographic Variables
Echocardiograms were performed using a 2.5-MHz transducer mounted on the ultrasound machine. A single cardiologist with level III training in echocardiography (T.E.S.) read all studies. Comparisons of the readings were performed by a local expert (P.R.L.) and an outside expert reader. The correlation coefficient between readers was 0.70 for left ventricular mass (LVM).
For the present study, LVM was calculated using the American Society of Echocardiography corrected formula by Devereux et al.21 The LVM was indexed to height in meters to the exponential of 2.7 (LVM index [LVMI]) to adjust for body habitus.22 The LV ejection fraction was determined by visual estimation. The LV hypertrophy was defined as an LVMI of at least 51g/m to the exponential of 2.7 in women and men.22 The LV systolic dysfunction was defined as an estimated LV ejection fraction of less than 50%.23
Cardiovascular Events
For the present investigation, the incidence of a CVD event was defined as the first occurrence of any of 4 major CVD outcomes (myocardial infarction, fatal CHD, CHF, and stroke) or any of the 2 nonmajor outcomes (incident angina or intermittent claudication) between the date of a participant’s first visit and December 31, 2011, in the JHS.24 Incident MI, fatal CHD, CHF, and stroke were determined through adjudication on review of relevant medical records. Annual follow-up records on Rose angina and intermittent claudication questionnaires were used to determine the incidence of these events.24
Design and Statistical Analysis
Multivariable Cox Proportional Hazards Models and Selection of Important Predictors From Candidate Variables From Different Data Tiers
The approach to the analysis and validation for the prediction model was based on guidelines described in the Transparent Reporting of a Multivariable Prediction Model for Individual Prognosis or Diagnosis (TRIPOD) statement.25 In this investigation, each checklist item of the TRIPOD statement was addressed, allowing for assessment of bias and clinical relevance of the prediction model.
Variables were tested and then removed from the models using a variable selection procedure. After variable selection, we tested for time-dependent covariates among predictors that were selected (retained). We used Cox proportional hazards regressions26 to assess the association of risk factors with the incidence of the CVD event over a median follow-up period of 9.1 years. We performed feature selection using a stepwise sequence27 that combines stepwise selection and the Akaike information criterion to select the most parsimonious model using various combinations of risk factors (Figure 1). In model 1, we assessed the association of standard risk factors (ie, age, sex, systolic and diastolic BP, use of antihypertensive medications, ratio of fasting total cholesterol to high-density lipoprotein (HDL) cholesterol and fasting triglycerides, estimated glomerular filtration rate, current smoking, and diabetes mellitus) with incident CVD. The candidate variables in model 2 included all standard risk factors and a panel of 10 biomarkers from various pathways, including adiposity (adiponectin and leptin), endothelial function (endothelin and homocysteine), inflammation (hs-CRP), insulin resistance (HOMA-IR and glycated hemoglobin), and neurohormonal activation (aldosterone, BNP, and cortisol). The candidate variables in model 3 and model 4 included standard risk factors and measures of subclinical disease (ABI, LV hypertrophy, LV systolic dysfunction, and CIMT). Specifically, candidate variables for model 3 included all subclinical measures for model 3 and included ABI only for model 4. We evaluated 2 additional models that included standard risk factors, biomarkers, and measures of subclinical disease. Candidate variables for model 5 consisted of standard risk factors, biomarkers, and all subclinical disease. Candidate variables for model 6 included standard risk factors, variables, BNP, and ABI based on the ease and practicality of obtaining these variables in primary care settings. All continuous variables and biomarkers were natural logarithmically transformed and then standardized within sex to account for their skewed distributions and sex-specific differences.
The performance of all models was evaluated using the C statistic by Harrell et al28 and the integrated discrimination improvement (IDI) was proposed.29 Relative IDI quantifies the separation between estimated risks of disease for cases vs controls after the addition of a biomarker or a measure of subclinical disease. The models with superior discriminative ability from among those not including echocardiographic traits were selected for comparison with the Framingham Risk Score (FRS)30 and the ACC/AHA CVD Pooled Cohort risk equations.13 Following recent recommendations, we refitted the FRS and ACC/AHA models to the JHS sample to obtain conservative estimates of their ability to move CVD prediction upward or downward across clinically meaningful boundaries (10-year event rate, 7.5%) using the Net Reclassification Improvement (NRI).31 We used the FRS model for all CVD, which included the outcomes of CHF, fatal MI, stroke, angina, and claudication (similar to the outcomes used in the present model). The age limits for the comparison with the FRS model were between 30 and 74 years. Comparison with the ACC/AHA CVD Pooled Cohort risk equations involved a subsample of participants 40 to 79 years old who were not receiving statin therapy and who were evaluated for incident major outcomes only (including fatal MI and stroke but excluding angina, claudication, and CHF).32 The NRI quantifies the increase in predicted risk categories for events and the decrease in risk categories for nonevents with the addition of a new marker. Therefore, the NRI helps identify patients who may benefit from more intensive preventive measures and helps identify those for whom pharmacotherapy could potentially be deferred.32
Assessment of Prediction Model Validity
We assessed the validity of the selected prediction models through external validation using 2 independent black adult data sets from the ARIC study (n = 825), excluding overlapping participants from the JHS and the Multi-Ethnic Study of Atherosclerosis (MESA) (n = 1564). The data sets from these 2 cohorts included the same sets of covariates as the prediction models we evaluated in the JHS, with the notable exception of the use of N-terminal pro-BNP (instead of BNP) in the ARIC study and the MESA. To minimize differences in distributions of the variables, all continuous variables were natural logarithmically transformed and standardized within sex (as in the JHS). Categorical traits were coded as in the JHS model development sample. Detailed descriptions of the ARIC study and the MESA cohorts used are provided in the eAppendix in the Supplement. Fixed regression coefficients associated with selected prediction models in the JHS (eTable 1 in the Supplement) were transported and applied to the validation samples, applying the same inclusion and exclusion criteria. The external validity of the predictions was quantified by performance related to discrimination and calibration.
Discrimination was evaluated by the C statistic by Harrell et al.28 Calibration was assessed using a calibration plot comparing the predicted probabilities (obtained using fixed regression coefficients of the prediction models) with the observed probabilities in the ARIC study and the MESA according to the Harrell regression modeling strategy (R package, version 3.2.2; R Foundation for Statistical Computing). The Green-wood-Nam-D’Agostino statistic was used in the evaluation of goodness of fit.33
Results
Study Sample
Table 1 summarizes the sex-specific and sex-pooled clinical and biochemical characteristics of the study sample. The mean (SD) age at baseline was 53 (11) years, and 64.8% (2390 of 3689) of the participants were female. Men had higher mean values (or percentages for categorical factors) for all standard risk factors, with the exception of age and diabetes mellitus status. Biomarker distributions (median and 25th and 75th percentiles) and proportions of participants with prevalent subclinical disease are also summarized in Table 1.
Table 1.
Baseline Characteristics of the Study Sample
| Variable | Women (n = 2390) |
Men (n = 1299) |
Sex Pooled (N = 3689) |
|---|---|---|---|
| Age, mean (SD), y | 54 (11) | 52 (11) | 53 (11) |
| Body mass index, mean (SD) | 32.9 (7.4) | 29.9 (6.1) | 31.8 (7.1) |
| BP, mean (SD), mm Hg | |||
| Systolic | 125 (18) | 128 (17) | 126 (18) |
| Diastolic | 78 (10) | 83 (10) | 80 (10) |
| Ratio of fasting total cholesterol to HDL cholesterol | 3.9 (1.1) | 4.6 (1.5) | 4.1 (1.3) |
| Fasting triglyceride levels, mean (SD), mg/dL | 101 (67) | 117 (96) | 107 (79) |
| eGFR, mean (SD), mL·min·1.73 m2a | 86.0 (16.7) | 87.0 (16.0) | 86.3 (17.4) |
| Antihypertensive therapy, No. (%) | 1248 (52.2) | 514 (39.6) | 1762 (47.8) |
| Statin therapy, No. (%) | 228 (9.5) | 105 (8.1) | 333 (9.0) |
| Type 2 diabetes mellitus, No. (%) | 379 (15.9) | 150 (11.5) | 529 (14.3) |
| Current smoking, No. (%) | 230 (9.6) | 227 (17.5) | 457 (12.4) |
| Follow-up, median (25th to 75th percentiles), y | 9.2 (8.4–9.8) | 8.9 (8.2–9.7) | 9.1 (8.3–9.7) |
| Total person-years | 21 474 | 11 412 | 32 886 |
| CVD event rate, No. (95% CI) per 1000 person-years | 7.7 (6.6–9.0) | 9.1 (7.5–11.0) | 8.2 (7.3–9.3) |
| 10-y Risk, mean % | |||
| FRS | 9.6 | 17.9 | 12.5 |
| ACC/AHA | 5.9 | 10.5 | 7.5 |
| Biomarker Level, Median (25th to 75th Percentiles) | |||
| Adiponectin, ng/mL | 4795 (3136–7072) | 3008 (1956–4885) | 4081 (2603–6369) |
| Aldosterone, ng/mL | 1.4 (2.4–7.0) | 4.8 (3.1–7.4) | 4.4 (2.6–7.2) |
| BNP, pg/mL | 7.6 (2.4–16.8) | 5.5 (2.2–12.3) | 6.6 (2.3–15.1) |
| Cortisol, μg/dL | 8.2 (6.2–10.8) | 10.5 (8.1–13.1) | 9.0 (6.8–11.9) |
| C-reactive protein, mg/L | 3.6 (1.5–7.3) | 1.6 (0.7–3.4) | 2.7 (1.1–5.7) |
| Endothelin 1, pg/mL | 1.2 (0.9–1.6) | 1.3 (1.0–1.6) | 1.2 (1.0–1.6) |
| A1c,% | 5.6 (5.3–6.1) | 5.7 (5.3–6.0) | 5.6 (5.3–6.1) |
| HOMA-IR, mass units | 3.54 (2.39–5.36) | 3.13 (2.19–5.03) | 3.42 (2.35–5.30) |
| Homocysteine, mg/L | 0.92 (0.77–1.09) | 1.04 (0.90–1.24) | 0.96 (0.81–1.15) |
| Leptin, ng/mL | 33.5 (22.7–47.0) | 8.1 (4.8–13.7) | 23.2 (10.4–39.7) |
| Subclinical Disease | |||
| ABI, median (25th to 75th percentiles) | 1.13 (1.06–1.23) | 1.17 (1.08–1.26) | 1.15 (1.07–1.24) |
| Upper 10th percentile CIMT, No./total No. (%) | 1.77/1452 (12.2) | 95/813 (11.7) | 272/2265 (12.0) |
| LV systolic dysfunction, No./total No. (%) | 20/1452 (1.4) | 27/813 (3.3) | 47/2265 (2.1) |
| LV hypertrophy, No./total No. (%) | 102/1452 (7.1) | 38/813 (5.0) | 140/2265 (6.2) |
Abbreviations: ABI, ankle-brachial index; ACC/AHA, American College of Cardiology/American Heart Association Pooled Cohort risk equations; A1c, glycated hemoglobin; BMI, body mass index (calculated as weight in kilograms divided by height in meters squared); BNP, B-type natriuretic peptide; BP, blood pressure; CIMT, carotid intimal-medial thickness; CVD, cardiovascular disease; eGFR, estimated glomerular filtration rate; FRS, Framingham Risk Score; HDL, high-density lipoprotein; HOMA-IR, homeostasis model assessment of insulin resistance; LV, left ventricular.
SI conversation factors: To convert aldosterone level to picomoles per liter, multiply by 27.74; BNP level to nanograms per liter, multiply by 1.0; cortisol level to nanomoles per liter, multiply by 27.588; C-reactive protein level to nanomoles per liter, multiply by 9.524; A1c level to proportion of total hemoglobin, multiply by 0.01; homocysteine level to micromoles per liter, multiply by 7.397; and triglyceride levels to millimoles per liter, multiply by 0.0113.
Estimated using the Chronic Kidney Disease Epidemiology Collaboration equation.
During a follow-up period of up to 10 years (median [75th percentile], 9.1 [9.7] years), 270 participants (166 women) experienced a first CVD event (Figure 1). The mean sex-specific and sex-pooled CVD event rates are listed in Table 1. The event rates and corresponding total person-years for individual CVD subtypes are summarized in eTable 2 in the Supplement. eTable 3 in the Supplement lists the CVD outcomes (aggregate and disaggregated) for each of the categorical factors included in the models. Briefly, the numbers and event rates of individual CV subtypes were as follows: incident MI and fatal CHD (92 participants [2.7; 95% CI, 2.2–3.3 events per 1000 person-years]), CHF (104 participants [3.1; 95% CI, 2.5–3.7 events per 1000 person-years]), and stroke (75 participants [2.2; 95% CI, 1.8–2.8 events per 1000 person-years).
Sample Sizes and Exclusion Criteria for Models Evaluated
Models considered included those (1) using standard risk factors (model 1) (n = 3689), (2) combining standard risk factors and blood biomarkers (n = 2802), (3) combining standard risk factors and measures of subclinical disease (n = 2265), and (4) combining all 3 (standard risk factors, blood biomarkers, and subclinical disease) (n = 1745). In addition, we considered a model using ABI only (n = 3322) for the subclinical disease option because that model would be easy to implement in primary care settings (no sophisticated imaging would be needed). We also considered a second model using ABI as the subclinical disease measure and blood BNP alone for the biomarker option (n = 2672) because of a greater feasibility of such testing in community-based clinic settings.
For the model incorporating standard CVD risk factors, 1612 participants were excluded as follows (in hierarchical order): those with age outside the age range of 30 to 74 years (n = 343), those with prevalent CVD (n = 551), those with serum creatinine level exceeding 2 mg/dL (n = 25) (to convert creatinine level to micromoles per liter, multiply by 88.4), and those with missing covariates (n = 663). A total of 3689 participants were eligible for this analysis. The demographic profile for the study sample was similar to that of those excluded because of missing individual covariates.
After excluding participants with missing biomarker data, 2802 individuals were eligible for analyses of biomarkers. Excluded (in hierarchical order) were individuals with missing data for adiponectin (n = 24), aldosterone (n = 3), BNP (or those with BNP level exceeding 100 pg/mL) (n = 745) (to convert BNP level to nanograms per liter, multiply by 1.0), glycated hemoglobin (n = 47), or leptin (n = 8) levels, in addition to exclusion criteria in tier 1. Excluded participants had significantly higher mean biomarker levels except for aldosterone, HOMA-IR, hs-CRP, and leptin concentrations (eTable 4 in the Supplement).
A total of 2265 individuals were retained after excluding participants with missing standard risk factors and data on subclinical disease, including (in hierarchical order) LVMI (n = 1219), LV ejection fraction (n = 13), CIMT (n = 31), and ABI (n = 161). As summarized in eTable 4 in the Supplement, participants with missing echocardiographic data were significantly older and hypertensive, had a higher percentage of current smokers, and had higher BNP levels.
Parsimonious Models According to Data Tiers
Parsimonious models from the analysis of the different tiers of variables are summarized in Table 2. Specifically, the estimated multivariable-adjusted hazard ratios and their associated 95% CIs for factors retained in the models are presented.
Table 2.
Results of Risk Prediction Model Selection
| Variable | Hazard Ratio (95% CI) | |||||
|---|---|---|---|---|---|---|
| Model 1 (n = 3689) |
Model 2 (n = 2802) |
Model 3 (n = 2265) |
Model 4 (n = 3322) |
Model 5 (n = 1745) |
Model 6 (n = 2672) |
|
| Log age per 1-SD increment | 1.53 (1.29 to 1.81) |
1.32 (1.09 to 1.61) |
1.81 (1.39 to 2.36) |
1.52 (1.26 to 1.85) |
1.80 (1.31 to 2.47) |
1.36 (1.08 to 1.70) |
| Male sex | 1.27 (0.99 to 1.63) |
1.31 (0.97 to 1.75) |
1.71 (0.95 to 2.01) |
1.39 (1.05 to 1.83) |
1.39 (0.90 to 2.14) |
1.48 (1.07 to 2.05) |
| Log systolic BP per 1-SD increment | 1.72 (1.13 to 1.43) |
1.19 (1.03 to 1.38) |
1.03 (0.85 to 1.25) |
1.20 (1.04 to 1.38) |
0.93 (0.75 to 1.15) |
1.13 (0.96 to 1.33) |
| Log ratio of fasting total cholesterol to HDL cholesterol per 1-SD increment | 1.13 (1.01 to 1.27) |
1.23 (1.07 to 1.43) |
1.21 (1.02 to 1.45) |
1.13 (0.99 to 1.29) |
1.28 (1.04 to 1.56) |
1.27 (1.09 to 1.47) |
| Log eGFR per 1-SD increment | 0.84 (0.76 to 0.88) |
0.86 (0.79 to 0.84) |
0.84 (0.77 to 0.92) |
0.77 (0.71 to 0.83) |
0.80 (0.71 to 0.90) |
0.80 (0.73 to 0.88) |
| Antihypertensive therapy | 1.76 (1.31 to 2.36) |
1.64 (1.16 to 2.30) |
1.50 (0.97 to 2.31) |
1.88 (1.34 to 2.64) |
1.59 (0.96 to 2.63) |
1.90 (1.28 to 2.80) |
| Type 2 diabetes mellitus | 2.70 (2.09 to 3.49) |
2.78 (1.16 to 2.73) |
3.00 (2.04 to 4.41) |
2.66 (2.00 to 3.55) |
2.91 (1.88 to 4.52) |
2.74 (1.96 to 3.82) |
| Current smoking | 2.36 (1.73 to 3.21) |
2.17 (1.50 to 3.13) |
2.14 (1.36 to 3.36) |
2.08 (1.45 to 2.98) |
1.86 (1.06 to 3.27) |
1.77 (1.16 to 2.70) |
| Log BNP | NA | 1.60 (1.29 to 1.99) |
NA | NA | 1.32 (1.00 to 1.79) |
1.58 (1.25 to 2.00) |
| Log HOMA-IR | NA | 1.25 (1.06 to 1.49) |
NA | NA | NA | NA |
| Log adiponectin level | NA | 1.28 (1.09 to 1.50) |
NA | NA | NA | NA |
| Log A1c level | NA | 1.16 (1.00 to 1.36) |
NA | NA | NA | NA |
| Log ABI | NA | NA | 0.84 (0.74 to 0.95) |
0.86 (0.78 to 0.95) |
0.84 (0.72 to 0.98) |
0.87 (0.77 to 0.99) |
| LV ejection fraction <50% | NA | NA | 4.61 (2.56 to 8.31) |
NA | 3.62 (1.65 to 7.94) |
NA |
| LV hypertrophy | NA | NA | 2.52 (1.57 to 4.05) |
NA | 2.13 (1.22 to 3.73) |
NA |
| Model performance metrics | ||||||
| C statistic | ||||||
| Full dataa | 0.77 (0.74 to 0.81) |
0.78 (0.74 to 0.83) |
0.83 (0.78 to 0.88) |
0.78 (0.74 to 0.82) |
0.82 (0.76 to 0.88) |
0.79 (0.75 to 0.83) |
| Same datab | 0.80 (0.74 to 0.86) |
0.80 (0.74 to 0.86) |
0.82 (0.76 to 0.88) |
0.80 (0.74 to 0.86) |
0.82 (0.76 to 0.88) |
0.81 (0.75 to 0.87) |
| Relative IDI | ||||||
| Full dataa | 1 [Reference] | 0.34 (0.26 to 0.43) |
0.35 (0.16 to 0.57) |
0.01 (−0.03 to 0.06) |
0.19 (0.03 to 0.37) |
0.22 (0.15 to 0.30) |
| Same datab | 1 [Reference] | 0.07 (0.03 to 0.12) |
0.35 (0.18 to 0.53) |
0.07 (0.00 to 0.14) |
0.40 (0.22 to 0.60) |
0.14 (0.07 to 0.23) |
Abbreviations: ABI, ankle-brachial index; A1c, glycated hemoglobin; BNP, B-type natriuretic peptide; BP, blood pressure; eGFR, estimated glomerular filtration rate; HDL, high-density lipoprotein; HOMA-IR, homeostasis model assessment of insulin resistance; IDI, integrated discrimination improvement; LV, left ventricular; NA, not applicable.
Full data are the full data set for specific models with varying sample sizes.
Same data are the same sample size for all models.
The standard CVD risk factors retained in model 1 included age, male sex, systolic BP, antihypertensive therapy, ratio of fasting total cholesterol to HDL cholesterol, estimated glomerular filtration rate, type 2 diabetes mellitus status, and smoking status. Triglyceride levels and diastolic BP were among the variables from model 1 that were dropped from this model based on statistical significance (P > .05).
The factors retained in model 2 (standard risk factors and biomarkers) included all standard risk factors and the following blood biomarkers: BNP (P < .001), HOMA-IR (P = .009), adiponectin (P = .002), and glycated hemoglobin (P = .05). The corresponding multivariable-adjusted hazard ratios and 95% CIs are summarized in Table 2.
In model 3 (standard risk factors and subclinical disease), CIMT was the only subclinical disease measure that was not retained in the model. All the other subclinical diseases, LV systolic dysfunction (P < .001), LV hypertrophy (P = .001), and ABI (P = .005) were retained in the final prediction model.
On combining predictors selected among standard risk factors, blood biomarkers, and subclinical disease (model 5), the following variables were retained in the final prediction model: age, ratio of fasting total cholesterol to HDL cholesterol, smoking status, BNP, LV ejection fraction, LV hypertrophy, and ABI (top half of Table 2). Also summarized in the top half of Table 2 are the multivariable-adjusted results for (1) model 4 (which included an analysis of standard risk factors and ABI only and (2) model 6 (which included an analysis of standard risk factors, BNP, and ABI).
Discrimination and Reclassification Performance
Discrimination results for all models are summarized in the bottom half of Table 2. For model 1, the C statistic was 0.77 (95% CI, 0.74–0.81), and the relative IDI was 0.35 (95% CI, 0.16–0.57). Compared with model 3 (with a C statistic of 0.83 [95% CI, 0.78–0.88]), it is apparent that model 3 has better predictive value. On the other hand, the relative IDI suggests an increase by 0.35 times in the difference in predicted probabilities of events vs nonevents between model 3 and model 1. Of the models not including echocardiographic traits, model 6 (which included BNP and ABI, in addition to clinical risk factors) was the best model fit. For model 6, the C statistic was 0.79 (95% CI, 0.75–0.83), and the relative IDI was 0.22 (95% CI, 0.15–0.30). As a result of the models, as well as their being readily available in the clinical setting, we chose model 1and model 6 for reclassification assessment purposes and for external validation. Application of model 1 and model 6 to disaggregated events is summarized in eTable 5 in the Supplement.
Comparing the NRI of Selected Models With the Framingham and ACC/AHA Risk Scores
The C statistics for the FRS and the ACC/AHA CVD Pooled Cohort risk equations were 0.77 (95% CI, 0.73–0.81) and 0.75 (95% CI, 0.71–0.79), respectively. Compared with the FRS, model 1 reclassified 5 participants from a low-risk to high-risk category, but compared with ACC/AHA, only 2 participants were reclassified (Table 3). In a similar comparison, model 1 reclassified 67 participants to a low-risk from a high-risk category among participants without events compared with the FRS and 20 participants when compared with ACC/AHA. Therefore, the CVD event NRIs for model 1 were 0.005, 0.019, and 0.016 when compared with model 6, the FRS, and the ACC/AHA CVD Pooled Cohort risk equations, respectively. The corresponding nonevent NRIs were 0.054, 0.020, and 0.007 compared with the same models, respectively. This conservative assessment comparing model 1 with refitted FRS and ACC/AHA models suggests no substantial improvement in reclassification. Compared with model 1, the FRS, and the ACC/AHA CVD Pooled Cohort risk equations, among CVD events, model 6 moved 1, 3, and 0 participants from the low-risk category to the high-risk category, respectively. Among participants without events, model 6 moved 134, 190, and 49 participants downward to the low-risk category compared with model 1, the FRS, and the ACC/AHA CVD Pooled Cohort risk equations, respectively. Therefore, model 6 resulted in event NRIs of −0.005, 0.016, and 0.000 and nonevent NRIs of 0.054, 0.076, and 0.024, respectively. These results further suggest no substantial improvement in reclassification by model 1 or model 6 compared with the FRS and ACC/AHA prediction models.
Table 3.
Model Comparison in Terms of the Number of Participants With Events Moved Upward to a Higher Risk Category or Participants Without Events Moved Downward to a Lower Risk Category
| Model Compareda | Risk of Events | Risk of Nonevents | Sample Sizeb | ||||
|---|---|---|---|---|---|---|---|
| Base | Enhanced | <0.075 | ≥0.075 | <0.075 | ≥0.075 | Events | Nonevents |
| Model 1 | Model 6 | 0 | −1 (0.005) | 134 (0.054) | 0 | 188 | 2484 |
| FRS | Model 1 | 0 | 5 (0.019) | 67 (0.020) | 0 | 270 | 3419 |
| ACC/AHAc | Model 1 | 0 | 2 (0.016) | 20 (0.007) | 0 | 128 | 2818 |
| FRS | Model 6 | 0 | 3 (0.016) | 190 (0.076) | 0 | 188 | 2484 |
| ACC/AHAc | Model 6 | 0 | 0 (0.000) | 49 (0.024) | 0 | 83 | 2030 |
Abbreviations: ACC/AHA, American College of Cardiology/American Heart Association cardiovascular disease Pooled Cohort risk equations; FRS, Framingham Risk Score.
A base model is compared with an enhanced model in terms of their ability to classify events to a higher risk category (ie, move upward) (C statistic, ≥0.075) or nonevents to a lower risk category (ie, move downward) (C statistic, <0.075). Positive values indicate that the enhanced model is better than the base model, and the reverse is true for negative values.
Sample size refers to the total number of events or nonevents for the specific model.
The ACC/AHA cardiovascular disease Pooled Cohort risk equations was restricted to participants 40 to 79 years old, not receiving statin therapy, and with major outcomes only, excluding congestive heart failure.
External Validation of the Prediction Model
Although model 3 and model 5 generated the highest C statistics, we chose to use model 1 and model 6 for validation because of their ease of use in a resource-sparse setting. As noted above, the ARIC-only (excluding the JHS-ARIC overlap) and MESA black adults were used for validation. Sample characteristics for the participants in the ARIC study and MESA cohorts are summarized in eTable 6 in the Supplement, and the results of external validation for discrimination and calibration are shown in Figure 2. The C statistics for model 1 and model 6 applied to the ARIC study were 0.76 (95% CI, 0.69–0.82) and 0.77 (95% CI, 0.71–0.84), respectively. The corresponding C statistics applied to the MESA were 0.70 (95% CI, 0.66–0.75) and 0.73 (95% CI, 0.68–0.78), respectively. The models appeared to perform better when applied to the ARIC study than when applied to the MESA sample in terms of discrimination, but the reverse was true in terms of calibration. Calibration in the large for model 1 and model 6 in the ARIC study (Figure 2A) and in the MESA (Figure 2B) showed poor calibration of the models developed in the JHS. The intercepts for both models were comparable across validation samples, but the slope for model 6 in the MESA was higher (mean [SD], 0.50 [0.08]) than that in the ARIC study (mean [SD], 0.05 [0.10]), suggesting that the model from derivation samples predicted more CVD events than were observed in both external validation samples. In the MESA, there appeared to be some underestimation at low event rates and some overestimation at high event rates when the predicted rates were compared with the observed event rates.
Figure 2. Calibration Plots With C Statistics and Distribution of Event Rates in ARIC-Only Black Adults and MESA Black Adults.
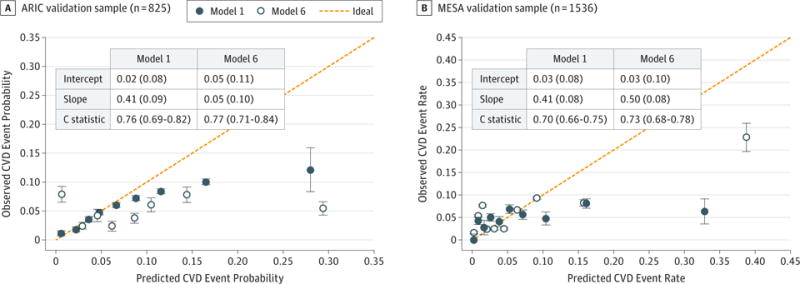
Shown is calibration of the Jackson Heart Study cardiovascular disease (CVD) models 1 and 6 using external ARIC study (79 events) and MESA (146 events) as samples. Model 1 includes standard CVD risk factors only. Model 6 includes significant standard CVD risk factors plus B-type natriuretic peptide and ankle-brachial index. Intercepts and slopes are means (SDs), and C statistics are values (95% CIs). ARIC indicates Atherosclerosis Risk in Communities; MESA, Multi-Ethnic Study of Atherosclerosis.
Discussion
We evaluated a hierarchy of CVD risk prediction algorithms in black adults that start with standard CVD risk factors and expand to incorporate novel biomarkers and then subclinical disease measures. We observed important associations of specific biomarkers (which constitute evidence for activation of key biological pathways involved in CVD) and select subclinical disease measures with CVD incidence in black adults. The 2 selected models for comparison with current global CVD risk prediction models were model 1 (standard risk factor model) and model 6 that incorporated standard risk factors, blood BNP, and ABI. Model 6 yielded superior predictive performance compared with a model without BNP and ABI. However, there was no substantial improvement in reclassification compared with the FRS and the recently introduced ACC/AHA CVD Pooled Cohort risk equations (in a subsample of participants 40–79 years old not receiving statin therapy, looking at major outcomes only, excluding CHF).
The performance of the 2 selected models was validated using 2 independent population-based samples of black adults. Both models exhibited acceptable discrimination in these external cohorts. Based on our results, these selected models that are readily available in the primary care setting are likely generalizable to other black populations originating from different geographical regions within the United States.
Biomarkers added minimal incremental improvement in discrimination beyond model 1. Framingham Heart Study34 investigators studied how 10 biomarkers (hs-CRP, BNP, atrial natriuretic peptide, aldosterone, renin, fibrinogen, D-dimer, plasminogen activator inhibitor type 1, homocysteine, and the ratio of urinary albumin to creatinine) predict cardiovascular events and death. Similar to our study, these biomarkers provided modest incremental predictive information over standard risk factors in that cohort.34 In the present investigation after incorporating standard, subclinical, and risk factors, BNP was the only biomarker retained in the prediction model. The strong predictive usefulness of BNP for CVD incidence is most likely because of several factors, including the use of CHF in the definition of CVD outcomes. In addition, the natriuretic peptide system has a multifaceted role in cardiovascular physiology, which includes salt and water handling,35 BP homeostasis, cardiac and vascular structure and function,36 and inhibition of the renin-angiotensin-aldosterone system.37 The natriuretic peptide system also influences lipid and glucose metabolism and homeostasis, further potentially contributing to the prognostic value of BNP.38–41
Furthermore, our investigation showed that adding subclinical disease measures (both ABI alone or the combination of ABI with echocardiographic LV mass and LV ejection fraction) enhanced the predictive usefulness of model 1. Lower ABI may be associated with CVD through its association with PAD and intermittent claudication, and it is equally plausible that a low ABI also is a marker of a greater burden of atherosclerotic disease in multiple vascular territories.42,43 It is well established that LV hypertrophy and systolic dysfunction are predictive of CVD.44–46 Cardiac remodeling is a result of biomechanical stressors and the activation of biological pathways affecting myocyte hypertrophy and function.47 In LV hypertrophy, the resultant supply-demand mismatch of myocardial oxygen results in a greater potential for myocardial ischemic events (angina and infarction).47 Finally, structural and functional LV remodeling can predispose affected individuals to acute decompensated heart failure and arrhythmic death.46,48,49
There are established prediction models developed and validated in various population-based cohorts for specific cardiovascular outcomes.6–8 Investigators in the FHS, Cardiovascular Health Study, and ARIC study have each developed risk prediction models for CHD.6,7 Specifically, the FRS for CHD performs well in white adults and black adults in different settings and in other racial/ethnic groups if recalibrated for different baseline incidences of CHD. The FHS, ARIC study, and Cardiovascular Health Study have also developed and validated stroke prediction models.4,5,9 The Health ABC Study50 and the ARIC study10 have developed HF prediction scores using common clinical variables to predict incident HF risk. The ARIC study model included middle-aged white adults and black adults, whereas in the Health ABC Study the cohort tested was elderly, and more than 40% of participants were black. The benefit of model 1 in our investigation is that it predicts general CVD risk in a population-based cohort of black adults, allowing for a summated risk across all CVD components. Establishing such a risk prediction model in black adults that focuses on all CVD events may allow for the formulation of prevention strategies that may contribute to lowering the burden of disease in this group and address the disparities in morbidity and mortality in this vulnerable segment of the US population. Application of the present model was not studied in this investigation. Instead, we focused on model development and validation.
Our study had some limitations. We developed prediction models in a community-based sample of black adults in Jackson, Mississippi. Model 3 and model 5, which both included echocardiographic variables, yielded the highest C statistics. However, because of the greater ease of use in a resource-constrained environment, we chose model 1and model 6 for validation. One limitation of this investigation is that the validation cohorts were small, with few events. In addition, external validation of our model was conducted in a subset of black adults in the ARIC study and compared with the ACC/AHA CVD Pooled Cohort risk equations, which was derived in part using data from black and white adults in the ARIC study. There were high rates of medication use in the MESA cohort, and it is unclear to what extent this factor may affect our validation results with that cohort. Because models contained more than 10 variables, this factor may lead to overfitting of the validation cohorts. Further complicating the validation analysis, BNP was used in modeling the JHS sample; however, BNP was not available in either the MESA or the ARIC study. N-terminal pro-BNP was used in place of BNP for the validation of the 2 external cohorts, which may also affect the validation cohorts. Another limitation is that we did not evaluate the predictive usefulness of coronary calcification (as a subclinical disease measure) because it was not available contemporaneously with our variables at JHS examination 1. Finally, additional investigation is warranted to identify the comparative accuracy of CVD prediction models incorporating standard risk factors, blood biomarkers, and measures of subclinical disease in other races/ethnicities. With more complex models, there was significant reduction in the sample size and the number of CVD events. These limitations must be weighed against the unique opportunity to perform an approach using novel models for risk assessment of CVD events in a community-based cohort of black adults.
Conclusions
We propose multiple models for CVD risk prediction in black adults. Previous risk algorithms were developed in predominantly white populations, and validation in black populations has been limited. Our findings using the JHS data in the present study are valuable because they confirm that current FHS and ACC/AHA risk algorithms work well in black individuals and are not easily improved on. A unique risk calculator for blacks may not be necessary.
Supplementary Material
Acknowledgments
Funding/Support: The Jackson Heart Study is supported by contracts HSN268201300046C, HHSN268201300047C, HHSN268201300048C, HHSN268201300049C, and HHSN268201300050C from the National Heart, Lung, and Blood Institute and the National Institute on Minority Health and Health Disparities. This work was also supported by award 13CRP14090010 from the American Heart Association’s Clinical Research Program (Dr Xanthakis) and by grants N01-HC-25915, R01-HL-08675, and R01-HL-080124 from the National Heart, Lung, and Blood Institute’s Framingham Heart Study (Dr Vasan). The Multi-Ethnic Study of Atherosclerosis (MESA) is supported by contracts N01-HC-95159, N01-HC-95160, N01-HC-95161, N01-HC-95162, N01-HC-95163, N01-HC-95164, N01-HC-95165, N01-HC-95166, N01-HC-95167, N01-HC-95168, and N01-HC-95169 from the National Heart, Lung, and Blood Institute and by grants UL1-TR-000040 and UL1-TR-001079 from the National Center for Research Resources, National Institutes of Health. The Atherosclerosis Risk in Communities study is carried out as a collaborative study supported by contracts HHSN268201100005C, HHSN268201100006C, HHSN268201100007C, HHSN268201100008C, HHSN268201100009C, HHSN268201100010C, HHSN268201100011C, and HHSN268201100012C from the National Heart, Lung, and Blood Institute.
Role of the Funder/Sponsor: The National Heart, Lung, and Blood Institute and the National Institute on Minority Health and Health Disparities funded the collection of data used in the study but had no role in the design, conduct, or analysis or the writing of the manuscript. The American Heart Association’s Clinical Research Program and the National Heart, Lung, and Blood Institute’s Framingham Heart Study contributed to the collection of data used in the study but had no role in the design, conduct, or analysis or the writing of the manuscript.
Footnotes
Author Contributions: Drs Fox, Samdarshi, and Musani are joint first authors. Drs Vasan and Taylor are joint senior authors. Dr Musani had full access to all the data in the study and takes responsibility for the integrity of the data and the accuracy of the data analysis.
Study concept and design: Fox, Samdarshi, Musani, Sung, Shreenivas, Covington, Rosamond, Vasan.
Acquisition, analysis, or interpretation of data: Fox, Musani, Pencina, Sung, Bertoni, Xanthakis, Balfour, Covington, Liebson, Sarpong, Butler, Mosley, Rosamond, Folsom, Herrington, Vasan, Taylor.
Drafting of the manuscript: Fox, Samdarshi, Musani, Sung, Balfour, Covington, Liebson, Sarpong, Vasan.
Critical revision of the manuscript for important intellectual content: Fox, Musani, Pencina, Bertoni, Xanthakis, Balfour, Shreenivas, Covington, Sarpong, Butler, Mosley, Rosamond, Folsom, Herrington, Vasan, Taylor.
Statistical analysis: Samdarshi, Musani, Sung, Xanthakis, Herrington.
Obtained funding: Mosley, Rosamond, Taylor.
Administrative, technical, or material support: Balfour, Covington, Sarpong, Butler, Vasan.
Study supervision: Fox, Musani, Xanthakis, Covington, Vasan.
Conflict of Interest Disclosures: All authors have completed and submitted the ICMJE Form for Disclosure of Potential Conflicts of Interest. Dr Pencina reported receiving grants from Regeneron/Sanofi outside of the present work. Dr Butler reported receiving grant support from the National Heart, Lung, and Blood Institute–Atherosclerosis Risk in Communities study and the Jackson Heart Study during the conduct of the study. Dr Herrington reported receiving grants from the National Institutes of Health during the conduct of the study. Dr Taylor reported receiving grants from the National Institutes of Health, during the conduct of the study, and reported receiving personal fees from Alnylam Pharmaceuticals outside of the present work. No other disclosures were reported.
Additional Contributions: We thank the Jackson Heart Study team (University of Mississippi Medical Center, Jackson State University, and Tougaloo College) and participants for their long-term commitment that continues to improve our understanding of the epidemiology of cardiovascular diseases. Specifically, we acknowledge the efforts of surveillance abstractors (Debra Wilson, MS, Jacqueline Mallet, MS, Valerie Wallace, MS, and Ethel Williams, BSN, all of the University of Mississippi Medical Center and with compensation), annual follow-up interviewers (Belinda Johnson, BS, Ida Berry, BS, and LaShondra Upkins, BS, all of the University of Mississippi Medical Center and with compensation), and sonographers (Melanie Omobude, BA, RDMS, Shelia Morgan-Jones, BA, RDCS, and Cora Champion, LPN, all of the University of Mississippi Medical Center and with compensation), as well as Tara Harding, RCS (G.V. [Sonny] Montgomery Veterans Affairs Medical Center and with compensation). We thank Floyd Washington, MPH (Loma Linda University and without compensation) for assistance with graphics for the article. We thank the staff and participants of the Atherosclerosis Risk in Communities study for their important contributions. We thank the other investigators, the staff, and the participants of the MESA for their valuable contributions.
Additional Information: A full list of participating MESA investigators and institutions can be found at http://www.mesa-nhlbi.org.
References
- 1.Roger VL, Go AS, Lloyd-Jones DM, et al. American Heart Association Statistics Committee and Stroke Statistics Subcommittee Heart disease and stroke statistics: 2012 update: a report from the American Heart Association [published correction appears in Circulation. 2012;125(22):e1002] Circulation. 2012;125(1):e2–e220. doi: 10.1161/CIR.0b013e31823ac046. [DOI] [PMC free article] [PubMed] [Google Scholar]
- 2.Bahrami H, Kronmal R, Bluemke DA, et al. Differences in the incidence of congestive heart failure by ethnicity: the Multi-Ethnic Study of Atherosclerosis. Arch Intern Med. 2008;168(19):2138–2145. doi: 10.1001/archinte.168.19.2138. [DOI] [PMC free article] [PubMed] [Google Scholar]
- 3.Loehr LR, Rosamond WD, Chang PP, Folsom AR, Chambless LE. Heart failure incidence and survival (from the Atherosclerosis Risk in Communities study) Am J Cardiol. 2008;101(7):1016–1022. doi: 10.1016/j.amjcard.2007.11.061. [DOI] [PubMed] [Google Scholar]
- 4.Lumley T, Kronmal RA, Cushman M, Manolio TA, Goldstein S. A stroke prediction score in the elderly: validation and Web-based application. J Clin Epidemiol. 2002;55(2):129–136. doi: 10.1016/s0895-4356(01)00434-6. [DOI] [PubMed] [Google Scholar]
- 5.Wolf PA, D’Agostino RB, Belanger AJ, Kannel WB. Probability of stroke: a risk profile from the Framingham Study. Stroke. 1991;22(3):312–318. doi: 10.1161/01.str.22.3.312. [DOI] [PubMed] [Google Scholar]
- 6.Koller MT, Leening MJ, Wolbers M, et al. Development and validation of a coronary risk prediction model for older U.S. and European persons in the Cardiovascular Health Study and the Rotterdam Study. Ann Intern Med. 2012;157(6):389–397. doi: 10.7326/0003-4819-157-6-201209180-00002. [DOI] [PMC free article] [PubMed] [Google Scholar]
- 7.Wilson PW, D’Agostino RB, Levy D, Belanger AM, Silbershatz H, Kannel WB. Prediction of coronary heart disease using risk factor categories. Circulation. 1998;97(18):1837–1847. doi: 10.1161/01.cir.97.18.1837. [DOI] [PubMed] [Google Scholar]
- 8.Chambless LE, Folsom AR, Sharrett AR, et al. Coronary heart disease risk prediction in the Atherosclerosis Risk in Communities (ARIC) study. J Clin Epidemiol. 2003;56(9):880–890. doi: 10.1016/s0895-4356(03)00055-6. [DOI] [PubMed] [Google Scholar]
- 9.Chambless LE, Heiss G, Shahar E, Earp MJ, Toole J. Prediction of ischemic stroke risk in the Atherosclerosis Risk in Communities Study. Am J Epidemiol. 2004;160(3):259–269. doi: 10.1093/aje/kwh189. [DOI] [PubMed] [Google Scholar]
- 10.Agarwal SK, Chambless LE, Ballantyne CM, et al. Prediction of incident heart failure in general practice: the Atherosclerosis Risk in Communities (ARIC) study. Circ Heart Fail. 2012;5(4):422–429. doi: 10.1161/CIRCHEARTFAILURE.111.964841. [DOI] [PMC free article] [PubMed] [Google Scholar]
- 11.Pencina MJ, D’Agostino RB, Sr, Larson MG, Massaro JM, Vasan RS. Predicting the 30-year risk of cardiovascular disease: the Framingham Heart Study. Circulation. 2009;119(24):3078–3084. doi: 10.1161/CIRCULATIONAHA.108.816694. [DOI] [PMC free article] [PubMed] [Google Scholar]
- 12.Chiuve SE, Cook NR, Shay CM, et al. Lifestyle-based prediction model for the prevention of CVD: the Healthy Heart Score. J Am Heart Assoc. 2014;3(6):e000954. doi: 10.1161/JAHA.114.000954. [DOI] [PMC free article] [PubMed] [Google Scholar]
- 13.Goff DC, Jr, Lloyd-Jones DM, Bennett G, et al. American College of Cardiology/American Heart Association Task Force on Practice Guidelines 2013 ACC/AHA guideline on the assessment of cardiovascular risk: a report of the American College of Cardiology/American Heart Association Task Force on Practice Guidelines [published correction appears in Circulation. 2014;129(25, suppl 2)S74–S75] Circulation. 2014;129(25 suppl 2):S49–S73. doi: 10.1161/01.cir.0000437741.48606.98. [DOI] [PubMed] [Google Scholar]
- 14.Taylor HA, Jr, Wilson JG, Jones DW, et al. Toward resolution of cardiovascular health disparities in African Americans: design and methods of the Jackson Heart Study. Ethn Dis. 2005;15(4 suppl 6):S6-4–17. [PubMed] [Google Scholar]
- 15.Fuqua SR, Wyatt SB, Andrew ME, et al. Recruiting African-American research participation in the Jackson Heart Study: methods, response rates, and sample description. Ethn Dis. 2005;15(4 suppl 6):S6-18–29. [PubMed] [Google Scholar]
- 16.Matsushita K, Selvin E, Bash LD, Astor BC, Coresh J. Risk implications of the new CKD Epidemiology Collaboration (CKD-EPI) equation compared with the MDRD Study equation for estimated GFR: the Atherosclerosis Risk in Communities (ARIC) study. Am J Kidney Dis. 2010;55(4):648–659. doi: 10.1053/j.ajkd.2009.12.016. [DOI] [PMC free article] [PubMed] [Google Scholar]
- 17.Kim HC, Greenland P, Rossouw JE, et al. Multimarker prediction of coronary heart disease risk: the Women’s Health Initiative. J Am Coll Cardiol. 2010;55(19):2080–2091. doi: 10.1016/j.jacc.2009.12.047. [DOI] [PubMed] [Google Scholar]
- 18.Melander O, Newton-Cheh C, Almgren P, et al. Novel and conventional biomarkers for prediction of incident cardiovascular events in the community. JAMA. 2009;302(1):49–57. doi: 10.1001/jama.2009.943. [DOI] [PMC free article] [PubMed] [Google Scholar]
- 19.Velagaleti RS, Gona P, Larson MG, et al. Multimarker approach for the prediction of heart failure incidence in the community. Circulation. 2010;122(17):1700–1706. doi: 10.1161/CIRCULATIONAHA.109.929661. [DOI] [PMC free article] [PubMed] [Google Scholar]
- 20.Orchard TJ, Strandness DE., Jr Assessment of peripheral vascular disease in diabetes: report and recommendations of an international workshop sponsored by the American Diabetes Association and the American Heart Association September 18–20, 1992 New Orleans, Louisiana. Circulation. 1993;88(2):819–828. doi: 10.1161/01.cir.88.2.819. [DOI] [PubMed] [Google Scholar]
- 21.Devereux RB, Alonso DR, Lutas EM, et al. Echocardiographic assessment of left ventricular hypertrophy: comparison to necropsy findings. Am J Cardiol. 1986;57(6):450–458. doi: 10.1016/0002-9149(86)90771-x. [DOI] [PubMed] [Google Scholar]
- 22.de Simone G, Devereux RB, Daniels SR, Koren MJ, Meyer RA, Laragh JH. Effect of growth on variability of left ventricular mass: assessment of allometric signals in adults and children and their capacity to predict cardiovascular risk. J Am Coll Cardiol. 1995;25(5):1056–1062. doi: 10.1016/0735-1097(94)00540-7. [DOI] [PubMed] [Google Scholar]
- 23.Ingelsson E, Sullivan LM, Murabito JM, et al. Prevalence and prognostic impact of subclinical cardiovascular disease in individuals with the metabolic syndrome and diabetes. Diabetes. 2007;56(6):1718–1726. doi: 10.2337/db07-0078. [DOI] [PubMed] [Google Scholar]
- 24.Keku E, Rosamond W, Taylor HA, Jr, et al. Cardiovascular disease event classification in the Jackson Heart Study: methods and procedures. Ethn Dis. 2005;15(4 suppl 6):S6-62–70. [PubMed] [Google Scholar]
- 25.Moons KG, Altman DG, Reitsma JB, et al. Transparent Reporting of a Multivariable Prediction Model for Individual Prognosis or Diagnosis (TRIPOD): explanation and elaboration. Ann Intern Med. 2015;162(1):W1–73. doi: 10.7326/M14-0698. [DOI] [PubMed] [Google Scholar]
- 26.Cox DR. Regression Models and Life-Tables: Breakthroughs in Statistics. New York, NY: Springer; 1992. pp. 527–541. [Google Scholar]
- 27.Shtatland ES, Kleinman K, Cain EM. Model Building in PROC PHREG With Automatic Variable Selection and Information Criteria. Philadelphia, PA: SAS Users Group International Paper; 2005. pp. 206–230. [Google Scholar]
- 28.Harrell FE, Jr, Califf RM, Pryor DB, Lee KL, Rosati RA. Evaluating the yield of medical tests. JAMA. 1982;247(18):2543–2546. [PubMed] [Google Scholar]
- 29.Pencina MJ, D’Agostino RB, Sr, D’Agostino RB, Jr, Vasan RS. Evaluating the added predictive ability of a new marker: from area under the ROC curve to reclassification and beyond. Stat Med. 2008;27(2):157–172. doi: 10.1002/sim.2929. [DOI] [PubMed] [Google Scholar]
- 30.D’Agostino RB, Sr, Vasan RS, Pencina MJ, et al. General cardiovascular risk profile for use in primary care: the Framingham Heart Study. Circulation. 2008;117(6):743–753. doi: 10.1161/CIRCULATIONAHA.107.699579. [DOI] [PubMed] [Google Scholar]
- 31.Wang TJ. Multiple biomarkers for predicting cardiovascular events: lessons learned. J Am Coll Cardiol. 2010;55(19):2092–2095. doi: 10.1016/j.jacc.2010.02.019. [DOI] [PubMed] [Google Scholar]
- 32.Pepe MS. Problems with risk reclassification methods for evaluating prediction models. Am J Epidemiol. 2011;173(11):1327–1335. doi: 10.1093/aje/kwr013. [DOI] [PMC free article] [PubMed] [Google Scholar]
- 33.Demler OV, Paynter NP, Cook NR. Tests of calibration and goodness-of-fit in the survival setting. Stat Med. 2015;34(10):1659–1680. doi: 10.1002/sim.6428. [DOI] [PMC free article] [PubMed] [Google Scholar]
- 34.Wang TJ, Gona P, Larson MG, et al. Multiple biomarkers for the prediction of first major cardiovascular events and death. N Engl J Med. 2006;355(25):2631–2639. doi: 10.1056/NEJMoa055373. [DOI] [PubMed] [Google Scholar]
- 35.Martinez-Rumayor A, Richards AM, Burnett JC, Januzzi JL., Jr Biology of the natriuretic peptides. Am J Cardiol. 2008;101(3A):3–8. doi: 10.1016/j.amjcard.2007.11.012. [DOI] [PubMed] [Google Scholar]
- 36.Woodard GE, Rosado JA. Natriuretic peptides in vascular physiology and pathology. Int Rev Cell Mol Biol. 2008;268:59–93. doi: 10.1016/S1937-6448(08)00803-4. [DOI] [PubMed] [Google Scholar]
- 37.Mangiafico S, Costello-Boerrigter LC, Andersen IA, Cataliotti A, Burnett JC., Jr Neutral endopeptidase inhibition and the natriuretic peptide system: an evolving strategy in cardiovascular therapeutics. Eur Heart J. 2013;34(12):886–893c. doi: 10.1093/eurheartj/ehs262. [DOI] [PMC free article] [PubMed] [Google Scholar]
- 38.Lafontan M, Moro C, Sengenes C, Galitzky J, Crampes F, Berlan M. An unsuspected metabolic role for atrial natriuretic peptides: the control of lipolysis, lipid mobilization, and systemic nonesterified fatty acids levels in humans. Arterioscler Thromb Vasc Biol. 2005;25(10):2032–2042. doi: 10.1161/01.ATV.0000183728.14712.d8. [DOI] [PubMed] [Google Scholar]
- 39.You H, Laychock SG. Atrial natriuretic peptide promotes pancreatic islet β-cell growth and Akt/Foxo1a/cyclin D2 signaling. Endocrinology. 2009;150(12):5455–5465. doi: 10.1210/en.2009-0468. [DOI] [PubMed] [Google Scholar]
- 40.Olsen MH, Hansen TW, Christensen MK, et al. N-terminal pro brain natriuretic peptide is inversely related to metabolic cardiovascular risk factors and the metabolic syndrome. Hypertension. 2005;46(4):660–666. doi: 10.1161/01.HYP.0000179575.13739.72. [DOI] [PubMed] [Google Scholar]
- 41.Musani SK, Vasan RS, Bidulescu A, et al. Aldosterone, C-reactive protein, and plasma B-type natriuretic peptide are associated with the development of metabolic syndrome and longitudinal changes in metabolic syndrome components: findings from the Jackson Heart Study. Diabetes Care. 2013;36(10):3084–3092. doi: 10.2337/dc12-2562. [DOI] [PMC free article] [PubMed] [Google Scholar]
- 42.Frohlich ED. State of the Art Lecture: risk mechanisms in hypertensive heart disease. Hypertension. 1999;34(4, pt 2):782–789. doi: 10.1161/01.hyp.34.4.782. [DOI] [PubMed] [Google Scholar]
- 43.Hirsch AT, Criqui MH, Treat-Jacobson D, et al. Peripheral arterial disease detection, awareness, and treatment in primary care. JAMA. 2001;286(11):1317–1324. doi: 10.1001/jama.286.11.1317. [DOI] [PubMed] [Google Scholar]
- 44.Fox ER, Taylor HA, Jr, Benjamin EJ, et al. Left ventricular mass indexed to height and prevalent MRI cerebrovascular disease in an African American cohort: the Atherosclerotic Risk in Communities study. Stroke. 2005;36(3):546–550. doi: 10.1161/01.STR.0000154893.68957.55. [DOI] [PubMed] [Google Scholar]
- 45.Taylor HA, Penman AD, Han H, et al. Left ventricular architecture and survival in African-Americans free of coronary heart disease (from the Atherosclerosis Risk in Communities [ARIC] study) Am J Cardiol. 2007;99(10):1413–1420. doi: 10.1016/j.amjcard.2006.12.065. [DOI] [PMC free article] [PubMed] [Google Scholar]
- 46.Blecker S, Matsushita K, Fox E, et al. Left ventricular dysfunction as a risk factor for cardiovascular and noncardiovascular hospitalizations in African Americans. Am Heart J. 2010;160(3):488–495. doi: 10.1016/j.ahj.2010.06.035. [DOI] [PMC free article] [PubMed] [Google Scholar]
- 47.Lorell BH, Carabello BA. Left ventricular hypertrophy: pathogenesis, detection, and prognosis. Circulation. 2000;102(4):470–479. doi: 10.1161/01.cir.102.4.470. [DOI] [PubMed] [Google Scholar]
- 48.Bikkina M, Larson MG, Levy D. Asymptomatic ventricular arrhythmias and mortality risk in subjects with left ventricular hypertrophy. J Am Coll Cardiol. 1993;22(4):1111–1116. doi: 10.1016/0735-1097(93)90424-y. [DOI] [PubMed] [Google Scholar]
- 49.Haider AW, Larson MG, Benjamin EJ, Levy D. Increased left ventricular mass and hypertrophy are associated with increased risk for sudden death. J Am Coll Cardiol. 1998;32(5):1454–1459. doi: 10.1016/s0735-1097(98)00407-0. [DOI] [PubMed] [Google Scholar]
- 50.Butler J, Kalogeropoulos A, Georgiopoulou V, et al. Health ABC Study Incident heart failure prediction in the elderly: the Health ABC Heart Failure Score. Circ Heart Fail. 2008;1(2):125–133. doi: 10.1161/CIRCHEARTFAILURE.108.768457. [DOI] [PMC free article] [PubMed] [Google Scholar]
Associated Data
This section collects any data citations, data availability statements, or supplementary materials included in this article.