Abstract
Purpose
To demonstrate the clinical utility of optical coherence tomography (OCT) angiography (OCT-A) in inherited retinal dystrophies (IRDs) complicated by choroidal neovascularization (CNV).
Methods
OCT-A and structural OCT were performed using a 70 kHz spectral-domain OCT system employing the split-spectrum amplitude-decorrelation angiography algorithm. Semiautomated image processing software was used to segment and measure the CNV.
Results
Four participants were enrolled to study the following IRDs complicated by CNV: choroideremia, EFEMP1-related retinopathy, Best vitelliform dystrophy, and adult-onset vitelliform dystrophy. Interpretation of fluorescein angiography was difficult due to abnormal retinal architecture but suggested the presence of CNV. Structural OCT revealed subretinal or sub-RPE fibrovascular tissue, within which flow signal was observed on OCT-A. CNV morphology varied from dense capillary networks in active lesions to asymptomatic large caliber loops. Baseline CNV vessel areas ranged from 0.07 to 0.98 mm2. Following treatment with intravitreal bevacizumab, the CNV in choroideremia decreased in vessel area then rebounded, while the one in EFEMP1-related retinopathy remained largely unchanged.
Conclusions
OCT-A enables the morphologic characterization and quantification of CNV in patients with retinal dystrophies despite distorted retinal architecture, can assess response to treatment, and may facilitate the differentiation between active and regressed lesions.
Keywords: Adult-onset vitelliform dystrophy, Best vitelliform dystrophy, Choroidal neovascularization, Choroideremia, EFEMP1-related maculopathy, OCT angiography
Introduction
Choroidal neovascularization (CNV) is a common complication of multiple inherited chorioretinal dystrophies (IRDs), including vitelliform dystrophies, Sorsby macular dystrophy, pattern dystrophy, choroideremia, and EFEMP1-related retinopathy.1–4 In addition to the loss of visual acuity and visual field restriction frequently resulting from retinal degeneration, CNV is capable of triggering acute visual loss via fluid exudation and hemorrhage, as well as persistent symptoms from the development of fibrotic subretinal scars. The primary pathology in IRDs varies by disease; nonetheless, CNV can arise as a stereotypic, nonspecific response to cellular degeneration.5
Fluorescein angiography (FA) is the current gold standard for diagnosis and classification of new-onset CNV, while spectral-domain optical coherence tomography (OCT) is routinely employed to monitor fibrovascular morphology and fluid accumulation, including in response to anti-vascular endothelial growth factor (anti-VEGF) therapy. Patients with retinal degenerative diseases often have distorted retinal architecture, which may complicate the interpretation of both FA and OCT. Moreover, exposure to light at levels employed in clinical fundus photography has been shown to accelerate neurodegeneration in animal models of retinal dystrophies, including dogs heterozygous for a RHO mutation and ABCA4 knockout mice.6, 7 Hence FA may be relatively contraindicated in some patients with IRDs due to the repetitive light exposure.
OCT angiography (OCT-A) is a noninvasive, functional extension of OCT for visualizing retinal and choroidal microvasculature.8, 9 Unlike the two dimensional view provided by FA, OCT-A permits topographic isolation of vascular flow by retinal layer.10 CNV may be delineated by selection of flow localized to the normally avascular outer retina. Furthermore, the area of neovascular vessels may be quantified for comparison over time concurrent with therapy.10–13
This study describes the morphologic and quantitative analysis of 4 cases of CNV secondary to distinct IRDs by OCT-A along with the progression with and without treatment.
Methods
Patients were enrolled after informed consent was obtained in accordance with a protocol approved by the Institutional Review Board at Oregon Health & Science University and adhering to the tenets of the Declaration of Helsinki.
Four patients who presented to the ophthalmic genetics clinic at the Casey Eye Institute from January through September 2015 were found to have CNV secondary to an IRD. Other causes of CNV, including age-related macular degeneration (AMD), choroidal rupture, ocular histoplasmosis, angioid streaks, multifocal choroiditis, and high myopia, were ruled out on the basis of their clinical exam and axial length measurement. The patients underwent a comprehensive eye examination, including measurement of best-corrected visual acuity, slit-lamp bimicroscopy, color fundus photography (FF450; Carl Zeiss Meditec, Dublin, CA), fundus autofluorescence (Optos 200Tx confocal scanning laser ophthalmoscope; Optos PLC, Marlborough, MA), and spectral-domain OCT (Spectralis; Heidelberg Engineering, Heidelberg, Germany). Intravenous angiography was obtained at the time of CNV diagnosis in all patients by injection of 10% sodium fluorescein in 5 mL water with excitation by a 488 nm wavelength laser (Figs. 1 and 3: FF450; Fig. 4: FF3, Carl Zeiss Meditec; Fig. 5: Spectralis). Inclusion criteria were patients aged 12 or more years with CNV confirmed or suggested by fluorescein dye leakage on angiogram and subretinal fluid on OCT. Exclusion criteria were the presence of severe media opacities, such as advanced cataract, or inability to maintain fixation.
Figure 1.
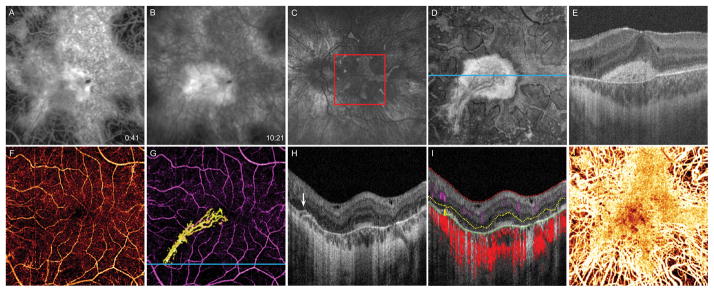
14-year-old boy with choroideremia complicated by CNV OS. A, 6 × 6 mm early-phase FA taken at diagnosis of CNV shows a central area of blockage, with, B, late-phase dye leakage. C, Fundus autofluorescence image 16 months after diagnosis shows diffuse chorioretinal atrophy with irregular perimacular sparing. Red box delineates 6 × 6 mm area corresponding to FA and OCT-A images. D, 16 months after diagnosis, en face OCT slab from 24 to 45 μm above BM, approximating the inner segment/outer segment junction, shows preserved photoreceptors at the macula. E, B scan corresponding to blue line in D illustrates that the central hyperreflective area in the en face image represents subretinal scar tissue with permeating vessels. F, OCT-A of the inner retinal vasculature shows preserved vessels. G, OCT-A of the inner retinal vasculature (purple) and CNV (yellow). H, B scan at the blue line in G reveals a bridging vessel (white arrow) from the choriocapillaris. I, Segmentation of the B scan illustrates flow at the location of the bridging vessel. Inner limiting membrane (red), outer boundary of the outer plexiform layer (yellow), and outer boundary of the RPE (green). Inner retinal circulation (purple shading), neovascular flow (yellow shading), and choroidal circulation (red shading). J, OCT-A of the choroid shows preserved choriocapillaris at the macula with deeper choroidal vessels visible at the periphery.
Figure 3.
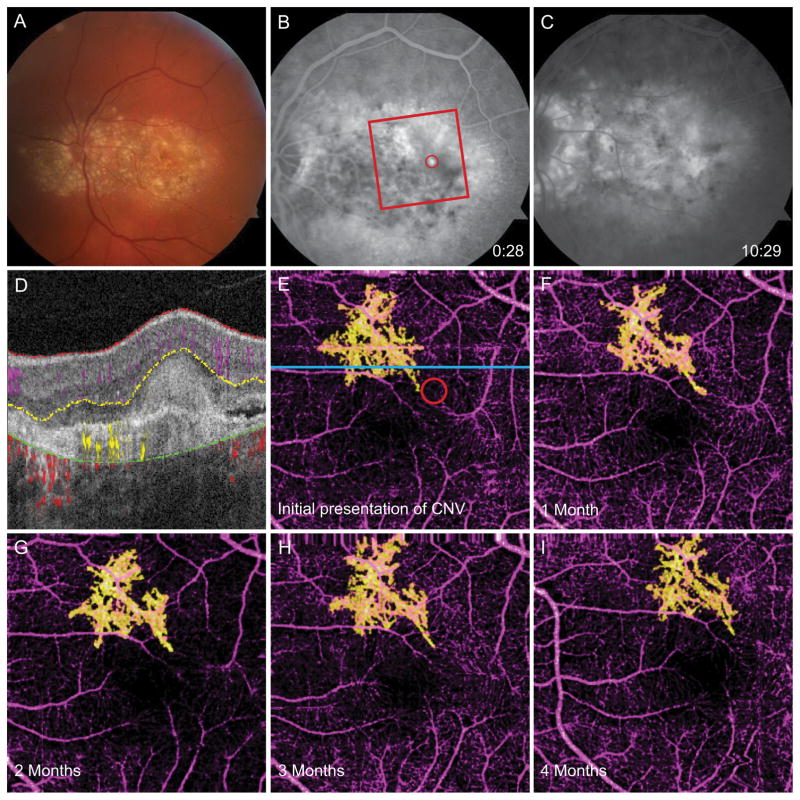
65-year-old woman with EFEMP1-related retinopathy complicated by CNV OS. A, Fundus photograph shows diffuse drusen at the posterior pole. B, Early-phase FA taken at diagnosis of CNV reveals hyperfluorescent region (red circle). Red box marks 3 × 3 mm area captured by OCT-A. C, Late-phase FA shows dye leakage. D, Segmented B scan corresponding to blue line in E shows diffuse confluent subretinal drusen and angiographic signal in the outer retina. E, OCT-A of the inner retinal vessels (purple) and CNV (yellow). The red circle corresponds to the area of early-phase dye leakage in B. F, OCT-A 1 month after CNV diagnosis and first bevacizumab treatment. G, OCT-A 2 months after CNV diagnosis and 2 injections of bevacizumab. H, OCT-A 3 months after CNV diagnosis and 3 injections of bevacizumab. I, OCT-A 4 months after CNV diagnosis and 4 injections of bevacizumab, demonstrating similar morphology to previous scans.
Figure 4.
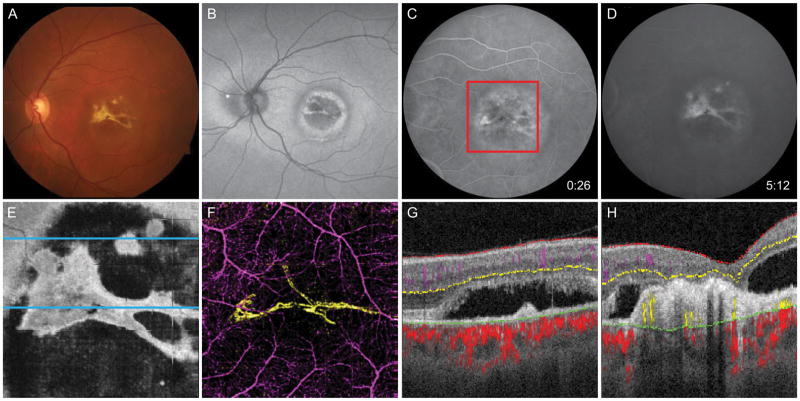
60-year-old man with Best vitelliform dystrophy complicated by CNV OS. A, Fundus photo shows yellow region at macula with bright lesion resembling fibrosis. B, Fundus autofluorescence demonstrates alternating concentric rings of hyperautofluorescence and hypoautofluorescence at the macula. C, Early-phase FA reveals mottled early hyperfluorescence, and D, late staining. E, En face OCT slab at the inner segment/outer segment junction demonstrates subretinal fluid containing subretinal fibrosis. F, 6 × 6 mm OCT-A corresponding to the red box in C demonstrates the CNV (yellow) is composed of two broad loops with minimal capillary networks. G, Segmented B scan at the superior blue line in E reveals avascular fibrotic tissue and subretinal fluid but no detectable flow. H, Segmented B scan at the inferior blue line in E shows angiographic flow within fibrotic tissue.
Figure 5.
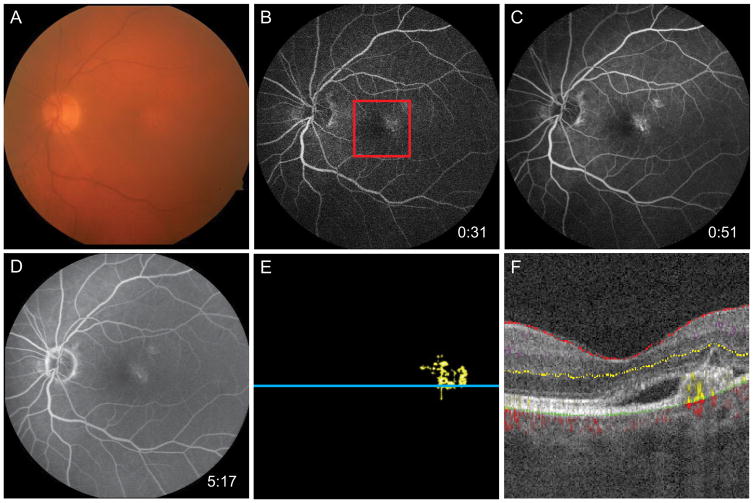
74-year-old man with AOVD found to have CNV OS. A, Fundus photo demonstrates mild pigmentary changes at the macula. B and C, Early-phase FA shows staining of the PED in the temporal fovea with, D, mild leakage evident in later frames. E, 3 × 3 mm OCT-A corresponding to the red box in B reveals neovascular flow at the temporal fovea. F, Segmented B scan at the blue line in E demonstrates angiographic flow below the PED surrounded by subretinal fluid.
OCT angiograms were acquired using the commercial RTVue-XR Avanti with AngioVue (OptoVue Inc, Fremont, CA) with a center wavelength of 840 nm and an axial scan rate of 70 kHz. Two or three repetitions of both 3 × 3 mm and 6 × 6 mm scans were performed at every visit to assess the repeatability of quantitative CNV vessel area analysis. Each volumetric macular data set consisted of 2 orthogonal scans covering a 3 × 3 or 6 × 6 mm area with 2 mm depth. In the fast transverse direction, 304 A-scans were sampled. Two repeated B scans were obtained at each position before proceeding to the next location. In the slow transverse direction, 304 locations along a 3 mm or 6 mm distance were sampled to generate a volumetric data set. The split-spectrum amplitude-decorrelation angiography (SSADA) algorithm was applied to detect flow as decorrelation between the two consecutive B scans.8, 14 Motion artifacts were removed by registration of two orthogonal scans.15
An advanced semi-automatic algorithm based on analysis of reflectance and reflectance-gradient was employed to segment the 3D angiograms, as previously described.16 The inner retinal layer was defined from the internal limiting membrane and the outer boundary of the outer plexiform layer (OPL), thus containing normal retinal vasculature. The outer retinal layer was defined from the outer OPL to Bruch’s membrane (BM); decorrelation within this normally avascular region was interpreted as CNV. Choroidal flow was defined as signal below BM, and was subdivided into the superficial choriocapillaris (from 6 to 12 μm below BM) and deep choroid (beneath 24 μm below BM) layers.
Flow projection artifact from superficial retinal vessels onto the outer retina was removed by subtracting a binary large inner retinal vessel map generated by applying a Gaussian filter from a binary outer retinal flow map.10 The CNV area was calculated using a previously described saliency-based method17 performed on the two dimensional maximum projection angiogram of the outer retina. Multiplying the number of pixels at which the decorrelation value was above a given threshold (set at one-quarter of the maximum decorrelation value unless motion artifact necessitated a greater value) by the pixel size yielded the CNV area. The CNV areas calculated from the two or three angiograms obtained at each visit were compared by standard deviation and coefficient of variation analysis.
Results
OCT angiograms were obtained on a total of 4 patients who had been diagnosed with an IRD complicated by CNV as confirmed or suggested by FA. Two cases were treated with anti-VEGF injection and follow-up OCT-A was obtained at subsequent visits.
Case 1. Choroideremia
A 14-year-old boy was diagnosed with choroideremia at the age of 8. At the age of 13 he noted decreased visual acuity in his left eye from 20/150 to 20/200; in the right eye, vision remained stable at 20/20. FA (Fig. 1A, B) revealed early blockage and late leakage in the inferior nasal region of the macula OS, confirming the presence of type I CNV. A series of intravitreal injections of bevacizumab every 4 to 8 weeks was initiated. Sixteen months and 13 injections following the diagnosis of CNV, his visual acuity had improved to 20/50 OS, fundus autofluorescence and en face structural OCT demonstrated diffuse chorioretinal atrophy with irregular preservation at the macula, and cross-sectional OCT showed a subretinal fibrovascular scar with perforating neovascular vessels (Fig. 1C–E). Central foveal thickness (CFT) on spectral-domain OCT was 367 μm. OCT-A was performed at this visit, revealing a well-defined CNV (Fig. 1G) appearing to arise from the edge of the preserved foveal island, as illustrated by the inferonasal bridging vessel (Fig. 1H, I), and branching extended in the direction of the fovea. The neovascular lesion was composed of predominantly linear larger diameter vessels with branching capillaries bounded by an anastamotic vessel along the outer edges.
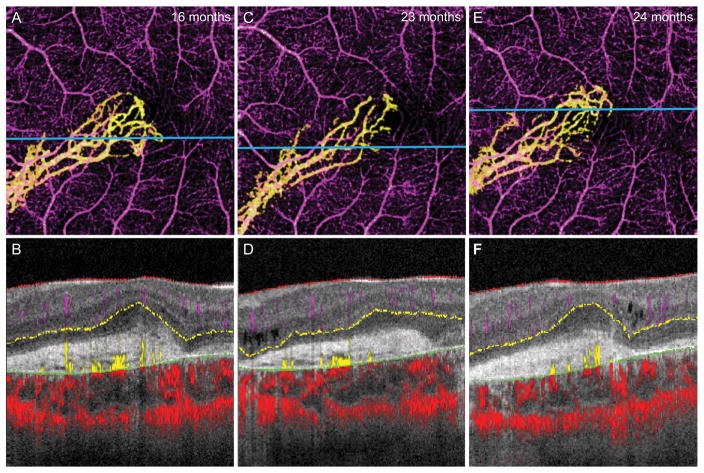
He continued to receive bevacizumab injections every 5 to 10 weeks. At 23 and 24 months after the diagnosis of CNV, follow-up OCT-A was performed revealing persistent CNV of a similar configuration (Fig. 2C). Quantitative analysis demonstrated a significant decrease of the CNV area at the second imaging session compared to the first (Table 1), paralleling a decrease in CFT from 367 μm to 353 μm. No anti-VEGF injection was administered at that time. One month later visual acuity dropped to 20/100 OS and the CNV area had rebounded (Fig. 2E), corresponding to an increase in subretinal fluid and CFT to 398 μm.
Figure 2.
14-year-old boy with choroideremia complicated by CNV OS. A, 3 × 3 mm OCT-A of the isolated CNV 16 months after diagnosis, with B, the segmented B scan at the level of the blue line shown in A. C, 3 × 3 mm OCT-A of the CNV 23 months after diagnosis shows diminished capillary branching in the inferior temporal region but increased growth at the temporal tip. D, Segmented B scan at the level of the blue line shown in C. E, 3 × 3 mm OCT-A of CNV 24 months after diagnosis, with F, the segmented B scan at the level of the blue line shown in E, which appears similar to the previous scan.
Table 1.
Analysis of CNV by automatic vessel area quantification
| Case | Diagnosis | Time after CNV diagnosis [months] | Previous anti-VEGF injections | Visual acuity | CFT [μm] | CNV vessel area [mm2] (SD) |
|---|---|---|---|---|---|---|
| 1 | Choroideremia | 16 | 13 | 20/50 | 367 | 0.98 (0.03) |
| 23 | 18 | 20/60 | 353 | 0.84 (0.04) | ||
| 24 | 18 | 20/100 | 398 | 0.96 (0.08) | ||
| 2 | EFEMP1-related retinopathy | 0 | 0 | 20/200 | 332 | 0.50 (0.01) |
| 1 | 1 | 20/200 | 281 | 0.45 (0.03) | ||
| 2 | 2 | 20/400 | 263 | 0.56 (0.04) | ||
| 3 | 3 | 20/400 | 259 | 0.57 (0.02) | ||
| 4 | 4 | CF at 4′ | 258 | 0.42 (0.02) | ||
| 3 | Best vitelliform dystrophy | 0 | - | 20/30 | 321 | 0.21* |
| 7 | - | 20/30 | - | 0.16 (0.01) | ||
| 12 | - | 20/30 | 299 | 0.22 (0.03) | ||
| 4 | AOVD | 0 | 0 | 20/30 | 265 | 0.07* |
More than 1 OCT angiogram was not suitable for quantification of CNV area at these visits due to motion artifact.
CF = count fingers
Case 2. EFEMP1-Related Retinopathy
A 65-year-old woman with a known family history of EFEMP1-related retinopathy, also known as Doyne honeycomb retinal dystrophy, presented with a one week history of decreased and distorted vision OS. Her visual acuity was found to have decreased from 20/40 to 20/200 OS, but was unchanged at 20/30 OD. Fundus examination demonstrated extensive large drusen at the macula and extending nasal to the optic disc (Fig. 3A), with mild subretinal fluid on OCT. FA revealed early hyperfluorescence and an area of late leakage superior temporal to the fovea consistent with classic subretinal CNV, but difficult to visualize due to the mottled staining of drusen (Fig. 3B, C). OCT-A readily revealed a plexus of dense capillary networks surrounding larger branching vessels just superior to the fovea. Overlay of the fluorescein angiography frame with the outer retinal vasculature scan revealed the dye leakage corresponded to the inferotemporal tip of the visible CNV, as illustrated by the red circle in Fig. 3E.
She received an intravitreal injection of bevacizumab on the same day as well as at her follow-up visits 4, 8, 12, and 16 weeks later, at which time improvement in subretinal fluid was noted but visual acuity OS continued to decline. Repeat OCT-A prior to each injection demonstrated fluctuating but generally unchanged in CNV area (Fig. 3F–I, Table 1).
Case 3. Best vitelliform macular dystrophy
A 60-year-old man with an extensive family history of Best disease presented for an initial diagnostic visit. Visual acuity was 20/100 OD and 20/30 OS, and he was found to have vitelliform deposits OD as well as subretinal fluid and scar at the macula OS. FA demonstrated early hyperfluorescence and late staining of the scar (Fig. 4C, D). OCT-A showed two loops of large caliber subretinal vessels within the scar consistent with a regressed CNV OS (Fig. 4E–H). He was observed without treatment and 7 months later repeat imaging revealed the CNV was morphologically similar but with decreased flow in the inferior branch such that the CNV area decreased (Table 1). At 12 months, subretinal fluid had decreased and the CNV again closely resembled the initial scan with a similar area by OCT-A.
Case 4. Adult-onset vitelliform dystrophy
A 74-year-old man with a strong family history of maculopathy was referred for evaluation of a vitelliform dystrophy. Visual acuity was 20/20 OD and 20/30 OS. He was noted to have pigmentary macular changes OU and a pigment epithelial detachment (PED) OS but no vitelliform material was visualized. Electrooculogram revealed a mildly subnormal Arden ratio (OD = 1.46, OS = 1.52), that together with the onset late in life was most consistent with a diagnosis of adult-onset vitelliform dystrophy (AOVD). FA revealed early hyperfluorescence and late leakage and staining in the temporal fovea OS associated with the PED (Fig. 5B–D). OCT-A was limited by motion artifact but demonstrated a region of CNV in the temporal fovea (Fig. 5E, F). He was referred for outside treatment of CNV and did not return for repeat imaging.
Considering all four patients at all visits, the coefficient of variation of the CNV area averaged 6.03%, comparable to 6.70% in previously published cases,17 demonstrating good intra-visit repeatability.
Discussion
Apart from the well-known complication of CNV secondary to AMD, CNV may also arise as a complication of IRDs.18, 19 In patients diagnosed with an IRD, acute changes in central vision are atypical, so any sudden loss of vision or unexplained subretinal fluid accumulation should prompt evaluation for potential CNV. We present four cases of CNV secondary to distinct retinal dystrophies.
OCT-A permits the visualization of neovascular structures isolated from retinal and choroidal vasculature. Unlike dye-based angiography, it is noninvasive, allowing repeated imaging at short intervals without undue risk, and avoids light exposure that may be toxic to some patients with IRDs. OCT-A of our 4 patients with an IRD detected blood flow within the subretinal fibrovascular tissue consistent with CNV.
All patients had pathologic retinal changes related to their underlying diagnosis, including chorioretinal atrophy, extensive drusen, or vitelliform deposits. Such elements had irregular fluorescein staining patterns, hindering the capability of FA to diagnosis and define the extent of the CNV. Despite significantly distorted retinal architecture at the area of CNV, the semi-automatic OCT-A segmentation algorithm could define the outer retina to delineate neovascular flow. Thus OCT-A may offer a feasible complimentary imaging technique when FA is inconclusive.
Three of the patients had dense neovascular networks on OCT-A, with untreated lesions (Fig. 3E, Fig. 5E) demonstrating smaller caliber vessels and capillaries. The patient who had received previous anti-VEGF therapy (Fig. 1G) had large trunk vessels with sparse capillaries, similar to the morphology seen in a cross-sectional analysis of 17 eyes with AMD complicated by CNV treated with an average of 47 intravitreal anti-VEGF injections prior to OCT-A.20 In contrast, Case 3 was asymptomatic on presentation, with a CNV composed of a few large caliber vessels that remained largely unchanged after 12 months. Thus morphologic evaluation using OCT-A may assist in distinguishing regressed CNV from those meriting treatment.
Notably, Case 1 developed CNV in the presence of diffuse retinal dystrophy with macular sparing. Studies suggest that loss of retinal pigment epithelium (RPE) is more extensive than choriocapillaris loss in choroideremia,9 so at the transition zone the RPE-BM complex may be disrupted while CNV developed from intact choriocapillaris (Fig. 1I). Following the vascular penetration of the RPE-BM complex, the CNV expansion is dependent on the production of VEGF and potentially inflammatory cytokines.20, 21 The precise site of VEGF production is uncertain, although RPE, macrophages, Müller cells, endothelial cells, and fibroblasts are all potential sources.22–24 In this case, RPE is intact only at the macula, such that the net vector of VEGF production would be directed toward the fovea, potentially accounting for the CNV orientation.
Our study has several limitations, including its retrospective design, small study population, absence of a control group, lack of uniform treatment with anti-VEGF, and variable schedule of obtaining OCT angiograms. Unlike FA, OCT-A relies on the patient’s ability to maintain central fixation for approximately 3 seconds. Therefore it has restricted utility in scanning patients with maculopathies or severe loss of visual acuity due to acute exudative CNV.
Our study demonstrates that despite severely distorted retinal architecture, OCT-A and advanced image processing tools are capable of segmenting retinal layers and performing quantitative analysis of CNV areas. Patients with IRDs complicated by CNV may benefit from treatment with intravitreal anti-VEGF,25–27 and we herein demonstrate that OCT-A is capable of monitoring progression over short intervals concurrent with therapy. Future investigations into the value of morphologic and quantitative analyses of CNV in diagnosing occult presentations and guiding treatment would help elucidate the potential uses of OCT-A in routine clinical care.
Summary Statement.
OCT-A enables the delineation, quantification, and morphologic assessment of choroidal neovascularization in inherited retinal diseases including vitelliform dystrophies, choroideremia, and EFEMP1-related retinopathy.
Acknowledgments
This work was supported by the Choroideremia Research Foundation; NIH grants R01 EY023285, R01 EY024544, DP3 DK104397, P30 EY010572, 5 K08 EY021186-05; Foundation Fighting Blindness grants C-CL-0711-0534-OHSU01, CD-NMT-0714-0648-OHSU, CD-NMT-0914-0659-OHSU; a Research to Prevent Blindness Career Development Award, and an unrestricted grant from Research to Prevent Blindness.
Footnotes
Proprietary interest: Oregon Health & Science University, Y.J., and D.H. have a significant financial interest in Optovue, Inc, a company that may have a commercial interest in the results of this research. These potential conflicts of interest have been reviewed and managed by OHSU. D.H. receives royalties on an optical coherence tomography patent licensed by the Massachusetts Institute of Technology to Carl Zeiss Meditec. R.G.W. serves on Scientific Advisory Boards for the Foundation Fighting Blindness. This relationship has been reviewed and managed by OHSU. The other authors have no proprietary or commercial interest in any materials discussed in this article.
References
- 1.Marano F, et al. Hereditary retinal dystrophies and choroidal neovascularization. Graefes Arch Clin Exp Ophthalmol. 2000;238(9):760–4. doi: 10.1007/s004170000186. [DOI] [PubMed] [Google Scholar]
- 2.Sivaprasad S, et al. Clinical course and treatment outcomes of Sorsby fundus dystrophy. Am J Ophthalmol. 2008;146(2):228–234. doi: 10.1016/j.ajo.2008.03.024. [DOI] [PubMed] [Google Scholar]
- 3.Robinson D, Tiedeman J. Choroideremia associated with a subretinal neovascular membrane. Case report. Retina. 1987;7(2):70–4. doi: 10.1097/00006982-198700720-00002. [DOI] [PubMed] [Google Scholar]
- 4.Michaelides M, et al. Maculopathy due to the R345W substitution in fibulin-3: distinct clinical features, disease variability, and extent of retinal dysfunction. Invest Ophthalmol Vis Sci. 2006;47(7):3085–97. doi: 10.1167/iovs.05-1600. [DOI] [PubMed] [Google Scholar]
- 5.Grossniklaus HE, et al. Clinicopathologic features of surgically excised choroidal neovascular membranes. Ophthalmology. 1994;101(6):1099–111. doi: 10.1016/s0161-6420(13)31216-0. [DOI] [PubMed] [Google Scholar]
- 6.Cideciyan AV, et al. In vivo dynamics of retinal injury and repair in the rhodopsin mutant dog model of human retinitis pigmentosa. Proc Natl Acad Sci U S A. 2005;102(14):5233–8. doi: 10.1073/pnas.0408892102. [DOI] [PMC free article] [PubMed] [Google Scholar]
- 7.Radu RA, et al. Light exposure stimulates formation of A2E oxiranes in a mouse model of Stargardt’s macular degeneration. Proc Natl Acad Sci U S A. 2004;101(16):5928–33. doi: 10.1073/pnas.0308302101. [DOI] [PMC free article] [PubMed] [Google Scholar]
- 8.Jia Y, et al. Split-spectrum amplitude-decorrelation angiography with optical coherence tomography. Opt Express. 2012;20(4):4710–25. doi: 10.1364/OE.20.004710. [DOI] [PMC free article] [PubMed] [Google Scholar]
- 9.Jia Y, et al. Quantitative optical coherence tomography angiography of vascular abnormalities in the living human eye. Proc Natl Acad Sci U S A. 2015;112(18):E2395–402. doi: 10.1073/pnas.1500185112. [DOI] [PMC free article] [PubMed] [Google Scholar]
- 10.Jia Y, et al. Quantitative optical coherence tomography angiography of choroidal neovascularization in age-related macular degeneration. Ophthalmology. 2014;121(7):1435–44. doi: 10.1016/j.ophtha.2014.01.034. [DOI] [PMC free article] [PubMed] [Google Scholar]
- 11.Huang D, et al. Optical coherence tomography angiography of time course of choroidal neovascularization in response to anti-angiogenic treatment. Retina. 2015;35(11):2260–4. doi: 10.1097/IAE.0000000000000846. [DOI] [PMC free article] [PubMed] [Google Scholar]
- 12.Kuehlewein L, Sadda SR, Sarraf D. OCT angiography and sequential quantitative analysis of type 2 neovascularization after ranibizumab therapy. Eye (Lond) 2015;29(7):932–5. doi: 10.1038/eye.2015.80. [DOI] [PMC free article] [PubMed] [Google Scholar]
- 13.McClintic SM, et al. Optical coherence tomographic angiography of choroidal neovascularization associated with central serous chorioretinopathy. JAMA Ophthalmol. 2015;133(10):1212–4. doi: 10.1001/jamaophthalmol.2015.2126. [DOI] [PMC free article] [PubMed] [Google Scholar]
- 14.Gao SS, et al. Optimization of the split-spectrum amplitude-decorrelation angiography algorithm on a spectral optical coherence tomography system. Opt Lett. 2015;40(10):2305–8. doi: 10.1364/OL.40.002305. [DOI] [PMC free article] [PubMed] [Google Scholar]
- 15.Kraus MF, et al. Quantitative 3D-OCT motion correction with tilt and illumination correction, robust similarity measure and regularization. Biomed Opt Express. 2014;5(8):2591–613. doi: 10.1364/BOE.5.002591. [DOI] [PMC free article] [PubMed] [Google Scholar]
- 16.Zhang M, et al. Advanced image processing for optical coherence tomographic angiography of macular diseases. Biomed Opt Express. 2015;6(12):4661–75. doi: 10.1364/BOE.6.004661. [DOI] [PMC free article] [PubMed] [Google Scholar]
- 17.Liu L, et al. Automated choroidal neovascularization detection algorithm for optical coherence tomography angiography. Biomed Opt Express. 2015;6(9):3564–76. doi: 10.1364/BOE.6.003564. [DOI] [PMC free article] [PubMed] [Google Scholar]
- 18.North V, Gelman R, Tsang SH. Juvenile-onset macular degeneration and allied disorders. Dev Ophthalmol. 2014;53:44–52. doi: 10.1159/000357293. [DOI] [PMC free article] [PubMed] [Google Scholar]
- 19.Miller DG, Singerman LJ. Vision loss in younger patients: a review of choroidal neovascularization. Optom Vis Sci. 2006;83(5):316–25. doi: 10.1097/01.opx.0000216019.88256.eb. [DOI] [PubMed] [Google Scholar]
- 20.Spaide RF. Optical coherence tomography angiography signs of vascular abnormalization with antiangiogenic therapy for choroidal neovascularization. Am J Ophthalmol. 2015;160(1):6–16. doi: 10.1016/j.ajo.2015.04.012. [DOI] [PubMed] [Google Scholar]
- 21.Bhutto I, Lutty G. Understanding age-related macular degeneration (AMD): Relationships between the photoreceptor/retinal pigment epithelium/Bruch’s membrane/choriocapillaris complex. Mol Aspects Med. 2012;33:295–317. doi: 10.1016/j.mam.2012.04.005. [DOI] [PMC free article] [PubMed] [Google Scholar]
- 22.Adamis AP, et al. Synthesis and secretion of vascular permeability factor/vascular endothelial growth factor by human retinal pigment epithelial cells. Biochem Biophys Res Commun. 1993;193(2):631–8. doi: 10.1006/bbrc.1993.1671. [DOI] [PubMed] [Google Scholar]
- 23.Ishibashi T, et al. Expression of vascular endothelial growth factor in experimental choroidal neovascularization. Graefes Arch Clin Exp Ophthalmol. 1997;235(3):159–67. doi: 10.1007/BF00941723. [DOI] [PubMed] [Google Scholar]
- 24.Kvanta A, et al. Subfoveal fibrovascular membranes in age-related macular degeneration express vascular endothelial growth factor. Invest Ophthalmol Vis Sci. 1996;37(9):1929–34. [PubMed] [Google Scholar]
- 25.Palejwala N, Lauer A, Weleber R. Choroideremia associated with choroidal neovascularization treated with intravitreal bevacizumab. Clin Ophthalmol. 2014;8:1675–9. doi: 10.2147/OPTH.S68243. [DOI] [PMC free article] [PubMed] [Google Scholar]
- 26.Sohn EH, et al. Responsiveness of choroidal neovascular membranes in patients with R345W mutation in fibulin 3 (Doyne honeycomb retinal dystrophy) to anti-vascular endothelial growth factor therapy. Arch Ophthalmol. 2011;129(12):1626–8. doi: 10.1001/archophthalmol.2011.338. [DOI] [PubMed] [Google Scholar]
- 27.Mimoun G, et al. Ranibizumab for choroidal neovascularization associated with adult-onset foveomacular vitelliform dystrophy: one-year results. Retina. 2013;33(3):513–21. doi: 10.1097/IAE.0b013e3182753adb. [DOI] [PubMed] [Google Scholar]


