Abstract
Background
The use of non-contrast computed tomography (nCT) measurements to predict heart failure (HF) has not been studied. In the present study we evaluated the prognostic value of left ventricular area adjusted for the body surface area (LVA-BSA) measured by nCT to predict incident HF and cardiovascular disease (CVD) events.
Methods
We studied 6781 participants (mean age: was 62 ± 10 years, 53% females; 62% non-white) free from prior HF in the MESA study who underwent nCT to evaluate left ventricular dimensions and coronary artery calcium score (CAC) at baseline and were followed up for a median of 10.2 years. The LVA-BSA was measured in nCT as previously validated.
Results
During follow up, 237 (3.5%) incident HF and 475 (7.0%) CVD events occurred. After adjustment for clinical variables and CAC, the LVA-BSA was significantly associated with incident HF (hazard ratio [HR]: 1.10 per 100 mm2/m2, p<0.001) and CVD events (HR: 1.07 per 100 mm2/m2, p<0.001). The area under the ROC curve for the prediction of incident HF improved from 0.787 on a model including only risk factors to 0.798 when CAC was added (p=0.02), and to 0.816 with the additional inclusion of LVA-BSA (p=0.007). Similar improvement in the prediction of CVD events was noted.
Conclusion
In an ethnically diverse population of asymptomatic individuals free from baseline CVD or HF, the left ventricular area measured by nCT is a strong predictor of incident HF events beyond traditional risk factors and CAC score.
Keywords: non-contrast cardiac computed tomography, left ventricle size, heart failure, and prognosis
Introduction
Heart failure is a major public health problem, accounting for one in every eight deaths in the U. S.1 Current guidelines suggest that early initiation of therapy in asymptomatic at risk individuals is desirable,2 though evidence to support the use of any screening tests for heart failure is scarce3.
Different techniques have been used to evaluate the left ventricle as a predictor of events. Early studies using electrocardiography have shown that left ventricular (LV) hypertrophy is associated with CHD,4 LV mass measured by echocardiography was independently associated with CHD and CVD events,5 while cardiac magnetic resonance imaging measures of the LV cavity were independently associated with both CHD and CVD.6 However, due to the significant cost associated with additional screening tests, none of these measures is currently recommended to evaluate asymptomatic individuals. Our group has previously demonstrated that the same non-contrast cardiac computed tomography scan (nCT) used to measure the coronary artery calcium (CAC) score can also be used to estimate the LV size. The nCT derived measurement of the LV has been validated against the gold standard of cardiac magnetic resonance imaging in the same Multi-Ethnic Study of Atherosclerosis (MESA) study cohort, with a correlation of 0.73 with LV volume, 0.74 with LV mass, and 0.79 with LV end-diastolic total volume.7 However, whether measures of the LV size in nCT can improve risk prediction is not known. Thus, in this study we have investigated whether nCT evaluation of LV size can be used to predict incident heart failure and CVD events beyond currently used clinical tools and the coronary artery calcium score.
Methods
The Multi-Ethnic-Study of Atherosclerosis (MESA) is a study designed to evaluate prospectively the development and progression of atherosclerotic disease in a multiethnic population. The full study design has been previously published8. In brief, the current study included 6814 participants of the MESA study recruited between July 2000 and August 2002. The population studied was between 45 and 84 years old, of both genders, free from any clinically apparent CVD, including HF, and self-reported as one of the four following ethnicities: White, African-American, Hispanic, or Chinese. Participants were recruited in six US communities: Baltimore City and Baltimore County, Maryland; Chicago, Illinois; Forsyth County, North Carolina; Los Angeles County, California; Northern Manhattan and the Bronx, New York; and St. Paul, Minnesota. The institutional review boards at all participating centers approved the study, and all participants gave informed consent.
Clinical profile and risk factor measures
All participants completed an extensive standardized questionnaire to collect information about diabetes, medications used to treat blood pressure and cholesterol, and smoking status. Additionally, participants underwent a clinical and laboratory evaluation as detailed in previously published material.9 The body surface area (BSA) was calculated by the formula: BSA (m2) = 0.20247 × ht (m)0.725 × wt (kg)0.425; where ht is height and wt is weight.
Non-contrast computed tomography protocol
MESA participants underwent nCT for coronary calcium score evaluation as previously described10. Approximately half of the scans were performed with a four row detector CT scanner, while electron beam tomography (EBT) was used for the others. The scan field of view was 35 cm for all scanners, and at least 10.5 cm of data in the z direction was acquired. The default settings for each scanner were: (1) GE Light Speed: 500-ms rotation time, 120 kVp, 320 mA, 4 × 2.5 mm collimation, sequential axial scans, segmented reconstruction, standard filter; (2) Siemens Volume Zoom: 140 kVp, 50 mAs, (139 mA, 0.361-s scan), 4 × 2.5 mm collimation, sequential axial scans with prospective cardiac gating, standard filter reconstruction; (3) Imatron EBT scanners: 130 kVp, 630 mA, scan time 100 ms, 3 mm collimation, sharp reconstruction filter. For EBT scans, prospective electrocardiographic gating was used with scanner triggering at 80% of the R-R interval, while 50% of the cardiac cycle for the multi detectors CT scanners.
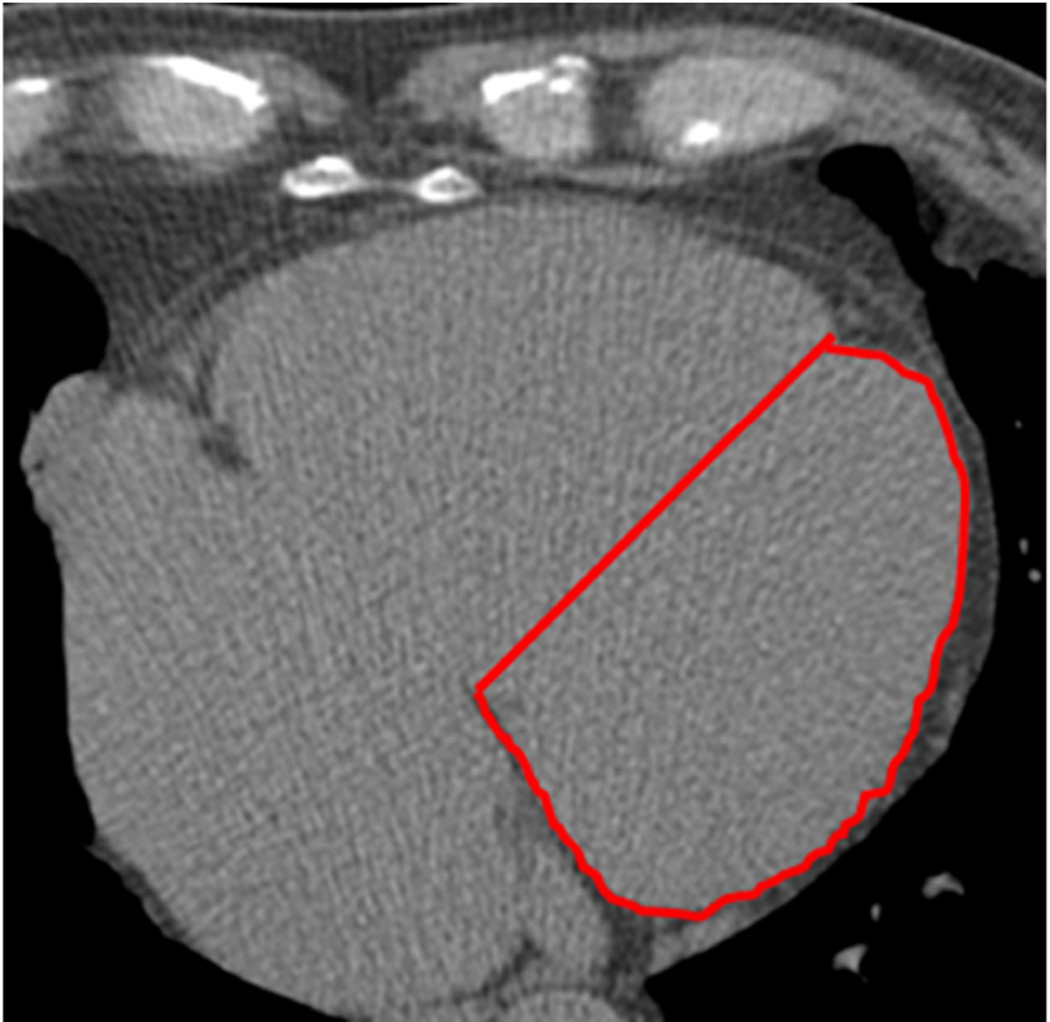
CT studies were acquired with a minimum of 40 images of 2.5 to 3 mm slice thickness starting above the left main and extending to the bottom of both ventricles. The determination of the LV area was performed as previously published7. Briefly, a single midventricular slice was selected according to the natural cardiac markers that include pericardial fat, epicardial fat in the atrioventricular groove, and the interventricular groove. The midventricular slice was defined as the level containing the coronary sinus slice or the first level below the left atrium. Second, a straight line connecting the anteroposterior juncture of both ventricles was drawn to divide the left and right ventricles, and the area of the left ventricle was then traced. The anteroposterior juncture origin is the interventricular groove, identified by natural markers such as the abrupt dip, which represents fat tissue or a high-density circular image, which represent the transverse section image of the left anterior descending coronary artery (figure 1). The LVA was then adjusted to body surface area (LVA-BSA).
Figure 1. Example of the LVA measurement.
The antero-posterior juncture origin is the interventricular groove, identified by the natural markers, such as the abrupt dip that represents fat tissue. The lateral border is easily identified by the abrupt change in contrast density from the cardiac silhouette to the pericardial fat. The posterior reference is the atrioventricular groove. A straight line connecting the antero-posterior juncture of both ventricles is drawn to complete the tracing (red line).
Adjudication of events
Participants were followed for a median of 10.2 (first quartile: 9.7 – third quartile: 10.7) years for incident HF, CHD and CVD events from their baseline examinations. Follow up consisted of three follow-up visits conducted by each participating center. In addition, participants were contacted by telephone every 9 to 12 months and questioned on hospital admissions, CVD events, deaths and outpatient diagnosis. To adjudicate those events, copies of all medical records for all hospitalizations and outpatient contacts that resulted in new cardiovascular diagnosis as well as death certificates were obtained.
Two independent physicians from the MESA events committee adjudicated every event after review of all medical records. Endpoints were then classified and an incident date was defined. The classification followed strictly pre-defined criteria. In case of discordant review, differences were adjudicated. If differences persisted, the full events committee made a final decision.
Incident HF included both definite and probable HF. Definite and probable HF required clinical symptoms (e.g., shortness of breath) or signs (e.g., edema), because asymptomatic disease was not an endpoint. Probable HF further required a physician diagnosis of HF and medical treatment for HF. Definite HF also required: 1) pulmonary edema/congestion by chest radiograph; and/or 2) dilated ventricle or poor LV function by echocardiography or ventriculography, or evidence of LV diastolic dysfunction. Thus, all HF cases including both cases of HF with preserved as well as reduced ejection fraction were included in the analysis.
CHD events included both myocardial infarction and new episodes of angina. Myocardial infarction was defined as definite, probable or absent based on symptoms, ECG abnormalities and cardiac biomarkers. Coronary artery disease death was classified as present or absent based on review of hospital records and interview of families. A fatal coronary event was defined as a documented myocardial infarction within 28 days of death, chest pain in the 72 hours prior to death or a history of coronary artery disease and no other known non-atherosclerotic or non-cardiac cause for death.
Angina was graded using pre-specified criteria and defined as definite, probable or absent. Probable angina required clearly documented chest pain or angina equivalent. Definite angina was defined by the same criteria, associated with objective evidence of obstructive coronary artery disease or reversible myocardial ischemia.
Overall CVD events included MI, resuscitated cardiac arrest, angina, heart failure, peripheral vascular disease, stroke, and TIA.
Statistical Analysis
All continuous variables are expressed as means ± standard deviation. Categorical variables are presented as absolute values and percentages. Continuous variables were compared using one-way ANOVA and correlation was evaluated using Spearman test, whereas categorical variables were analyzed using chi-square tests.
The primary outcome of the analysis was incident HF, while additional analysis were also performed for the secondary outcomes of CVD and CHD.
Unadjusted Cox proportional hazard ratios were calculated, with LVA-BSA modeled as a continuous variable (per one standard deviation increase), as well as using LVA-BSA as an ordinal variable stratified by quartiles. Additional models, adjusting first for: (1) risk factors (age, gender, ethnicity, diabetes, smoking status, LDL, HDL, triglycerides, systolic and diastolic blood pressure and use of anti-hypertensive and lipid lowering drugs); (2) for risk factors plus coronary artery calcium score and (3) for risk factors, CAC and LVA-BSA were developed. For the third model, CAC was included in the model as a continuous ln of CAC + 1 to correct for the asymmetrical distribution of CAC valued. To evaluate the possible interaction between calcium score and LVA, an interaction term was added to the model. However, results for interactions were not presented unless significant. Nelson Aalen events curves were constructed for the primary and secondary outcomes using LVA-BSA as an ordinal variable stratified by quartiles. Moreover, we derived gender specific quartiles and constructed gender specific curves presented as supplemental material. Additionally, we have calculated the sensitivity and specificity of various LVA-BSA cut-offs for the prediction of incident HF stratified by gender. To compare different multivariable models, the area under the ROC curves were calculated and compared for each of the primary and secondary outcomes.
All analyses were performed using Stata 13.0 for Windows (StataCorp, College Station, Texas). Two-tailed p-values <0.05 were considered statistically significant and presented for descriptive purposes. Confidence intervals are expressed as 95% confidence intervals (CI).
Results
Baseline Characteristics
Among 6814 MESA participants, 6781 had complete clinical and follow up information for all outcomes and were included in the present analysis. The mean LVA was 4018±734 mm2, and the LVA-BSA had a mean of 2158±310 mm2 per m2. The first quartile of LVA-BSA had a range from 1200 to 1946 mm2 per m2, the second quartile from 1947 to 2138, the third quartile from 2139 to 2342 mm2 per m2 and the 4th quartile from 2343 to 2724 mm2 per m2.
Among the baseline characteristics, male gender, non-white race, no prior smoking history, diabetes, hypertension, elevated systolic and diastolic blood pressure and use of anti-hypertensive therapy were significantly associated with LVA-BSA. Family history of coronary heart disease, BMI, HDL and use of lipid lowering medication were all inversely associated with LVA-BSA. (Table 1).
Table 1.
Baseline characteristics and number of events per LVA-BSA quartiles of the MESA population 2000–2002.
| Variable | LVA-BSA 1st quartile |
LVA-BSA 2nd quartile |
LVA-BSA 3rd quartile |
LVA-BSA 4th quartile |
p |
|---|---|---|---|---|---|
| Population size | 1697 | 1693 | 1697 | 1694 | |
| Age (years) | 62.3±10.1 | 62.2±10.1 | 61.5±10.3 | 62.5±10.4 | 0.03 |
| Men (%) | 629 (37%) | 732 (43%) | 821 (49%) | 1009 (60%) | <0.001 |
| Race (%) | <0.001 | ||||
| White | 878 (52%) | 700 (42%) | 583 (35%) | 441 (26%) | |
| Hispanic | 268 (16%) | 326 (19%) | 411 (24%) | 489 (29%) | |
| African-American | 415 (24%) | 463 (27%) | 479 (28%) | 507 (30%) | |
| Chinese | 130 (8%) | 200 (12%) | 214 (13%) | 257 (15%) | |
| Smoking (%) | <0.001 | ||||
| Never | 791 (47%) | 852 (50%) | 866 (51%) | 893 (53%) | |
| Former | 661 (39%) | 641 (38%) | 620 (37%) | 555 (33%) | |
| Current | 239 (14%) | 196 (12%) | 201 (12%) | 246 (14%) | |
| Family history of CHD (%) |
735 (46%) | 677 (43%) | 682 (43%) | 617 (39%) | 0.001 |
| Diabetes (%) | 132 (8%) | 145 (9%) | 172 (10%) | 209 (12%) | <0.001 |
| Hypertension (%) | 615 (36%) | 708 (42%) | 779 (46%) | 929 (55%) | <0.001 |
| Systolic BP (mmHg) | 122±19 | 125±21 | 126±21 | 132±28 | <0.001 |
| Diastolic BP (mmHg) |
70±10 | 71±10 | 72±10 | 74±10 | <0.001 |
| BMI (kg/m2) | 28.8±6.2 | 28.6±5.6 | 28.2±5.1 | 27.7±4.7 | <0.001 |
| LDL (mg/dL) | 117±32 | 118±32 | 117±31 | 116±31 | 0.5 |
| HDL (mg/dL) | 52±15 | 51±15 | 51±15 | 50±14 | <0.001 |
| Triglycerides (mg/dL) |
131±78 | 133±79 | 134±108 | 129±87 | 0.51 |
| Anti-hypertensive therapy (%) |
547 (32%) | 584 (35%) | 645 (38%0 | 735 (43%) | <0.001 |
| Lipid lowering therapy (%) |
315 (19%) | 279 (17%) | 265 (16%) | 234 (14%) | 0.002 |
| Coronary Artery Calcium Score |
124±333 | 130±240 | 138±435 | 191±527 <0.001 | <0.001 |
| Events | |||||
| Heart Failure | 37 (2.2%) | 40 (2.4%) | 54 (3.2%) | 106 (6.2%) | |
| CHD events | 95 (5.6%) | 100 (5.9%) | 102 (6.0%) | 152 (8.9%) | |
| Cardiovascular events |
131 (7.7%) | 143 (8.4%) | 148 (8.7%) | 217 (12.8% |
Values are mean ± SD, median (interquartile range), or n (%).
BMI= body mass index, BP= blood pressure, CHD: coronary heart disease, HDL= high-density lipoprotein, LDL= low-density lipoprotein.
Incident Events
During follow-up, there were 639 (9.4%) CVD events, including 449 (6.6%) incident CHD events and 237 (3.5%) incident HF cases. The number of events according to the LVA-BSA quartiles are presented in table 1.
Univariable Predictors of Heart Failure Events
Incident HF was associated with increase age, male gender, prior history of smoking, elevated systolic and diastolic BP, BMI and use of anti-hypertensive medications, while Chinese race was associated with a lower HF incidence when compared to white (table 2).
Table 2.
Univariate Cox proportional Hazard ratios for the prediction of heart failure.
| Variable | Heart Failure | ||
|---|---|---|---|
| HR | 95% CI | p-value | |
| Age (per 10 years) | 2.08 | 1.81 – 2.38 | <0.001 |
| Men (%) | 1.63 | 1.26 – 2.12 | <0.001 |
| Race (%) | |||
| White | Ref | Ref | Ref |
| Hispanic | 0.98 | 0.69 – 1.38 | 0.89 |
| African-American | 1.22 | 0.91 – 1.65 | 0.19 |
| Chinese | 0.49 | 0.28 – 0.86 | 0.01 |
| Smoking (%) | |||
| Never | Ref | Ref | Ref |
| Former | 1.41 | 1.08 – 1.87 | 0.01 |
| Current | 1.42 | 0.97 – 2.09 | 0.07 |
| Family history of CHD (%) | 1.24 | 0.95 – 1.62 | 0.11 |
| Diabetes (%) | 3.76 | 2.82 – 50.2 | <0.001 |
| Hypertension (%) | 3.57 | 2.66 – 4.72 | <0.001 |
| Systolic BP (per 10 mmHg) | 1.27 | 1.21 – 1.34 | <0.001 |
| Diastolic BP (per 10mmHg) | 1.17 | 1.04 – 1.32 | 0.01 |
| BMI (per 10 kg/m2) | 1.60 | 1.30 – 1.96 | <0.001 |
| LDL (per 10 mg/dL) | 0.96 | 0.92 – 1.00 | 0.06 |
| HDL (per 10 mg/dL) | 0.88 | 0.80 – 0.97 | 0.009 |
| Triglycerides (per 10 mg/dL) | 1.01 | 0.99 – 1.02 | 0.06 |
| Anti-hypertensive therapy (%) | 2.82 | 2.18 – 3.67 | <0.001 |
| Lipid lowering therapy (%) | 1.33 | 0.97 – 1.83 | 0.08 |
| Coronary Artery Calcium Score | |||
| 0 | Ref | Ref | Ref |
| 1 – 100 | 1.54 | 1.06 – 2.23 | 0.02 |
| >100 | 4.72 | 3.49 – 6.40 | <0.001 |
| LVA-BSA (per 100 mm2/m2) | 1.17 | 1.14 – 1.20 | <0.001 |
BMI= body mass index, BP= blood pressure, CHD: coronary heart disease, HDL= high density lipoprotein, LDL= low density lipoprotein, LVA-BSA.
Higher CAC scores and higher LVA-BSA (p<0.001) were also significantly associated with incident HF in the univariable analysis (table 2).
LVA-BSA as a predictor of events
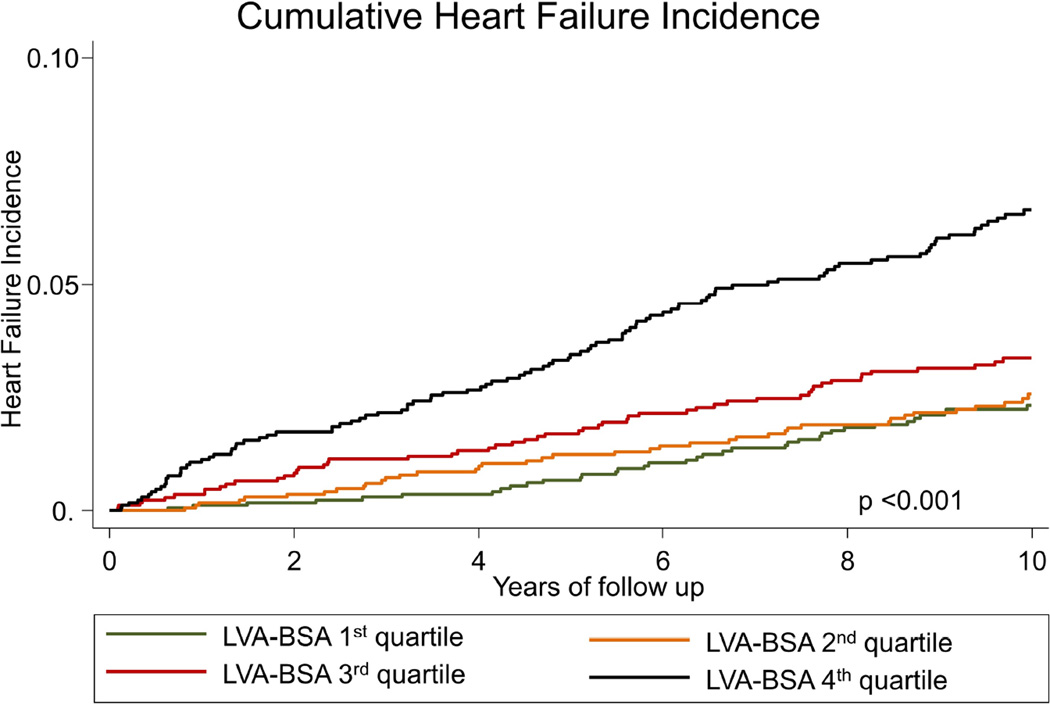
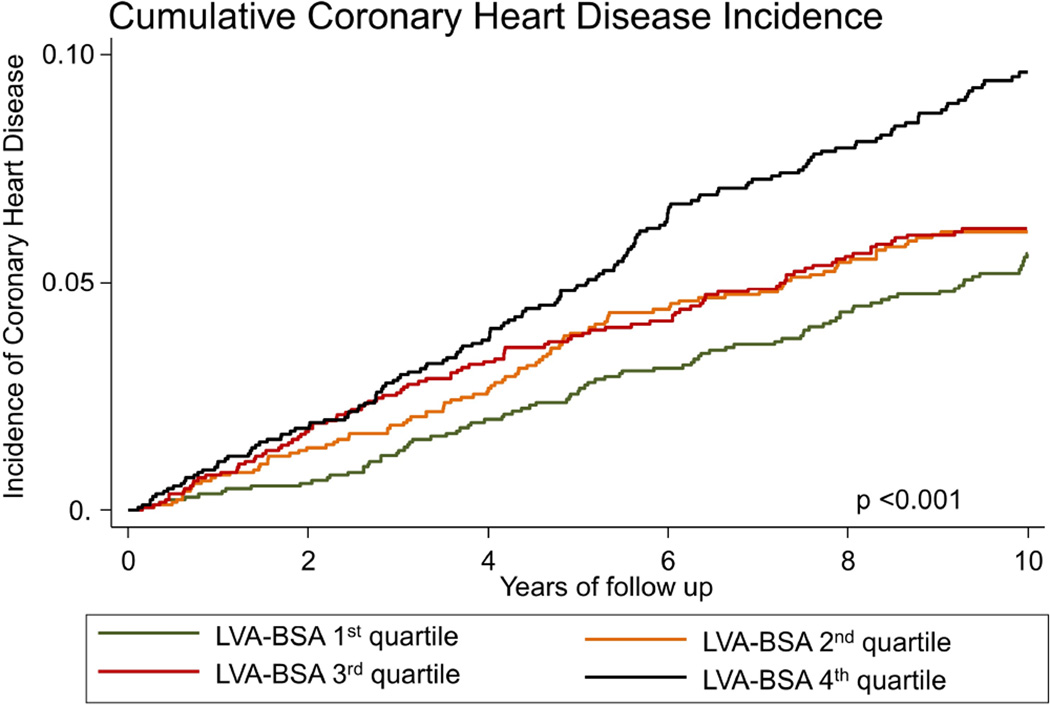
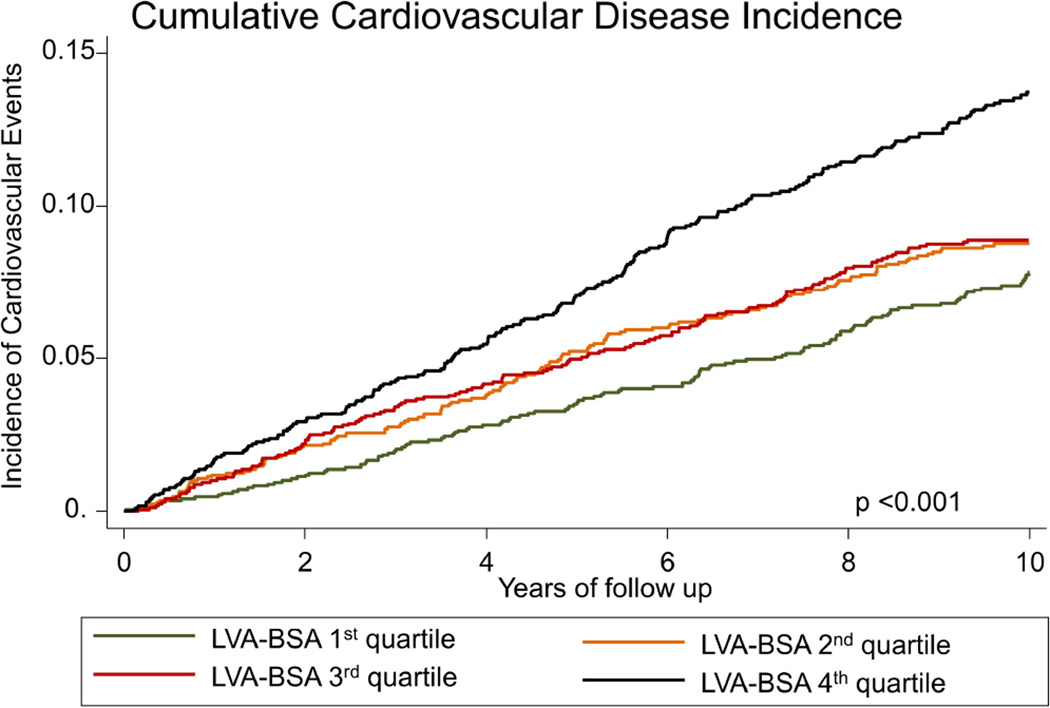
The incidence of HF in the first LVA-BSA quartile was 2.26 (95%CI: 1.63 – 3.12) events per 1000 person years, for the second, third and fourth quartiles the rates were 2.50 (95%CI: 1.84 – 3.41), 3.38 (95%CI: 2.59 – 4.42) and 6.94 (95%CI: 5.74 – 8.39), respectively (p<0.001, figure 2A). LVA-BSA was also a significant predictor for the secondary outcomes of CVD and CHD (p <0.001 for both, figures 2B and 2C). A similar pattern was noted when the data was stratified by gender, and gender specific quartile were used, however, the incidence of events was lower in women (supplemental figures 1–3). Additionally, we have calculated the sensitivity and specificity of a range of LVA-BSA values for the prediction of incident HF stratified by gender (supplemental table 1).
Figure 2. Nelson-Aalen curves stratified by LVA-BSA quartiles.
A: Cumulative incidence curves for incident HF. B: Cumulative incidence curves for incident coronary heart disease (CHD). C: Cumulative incidence curves for incident cardiovascular disease (CVD) events.
LVA-BSA and CAC as predictors of events
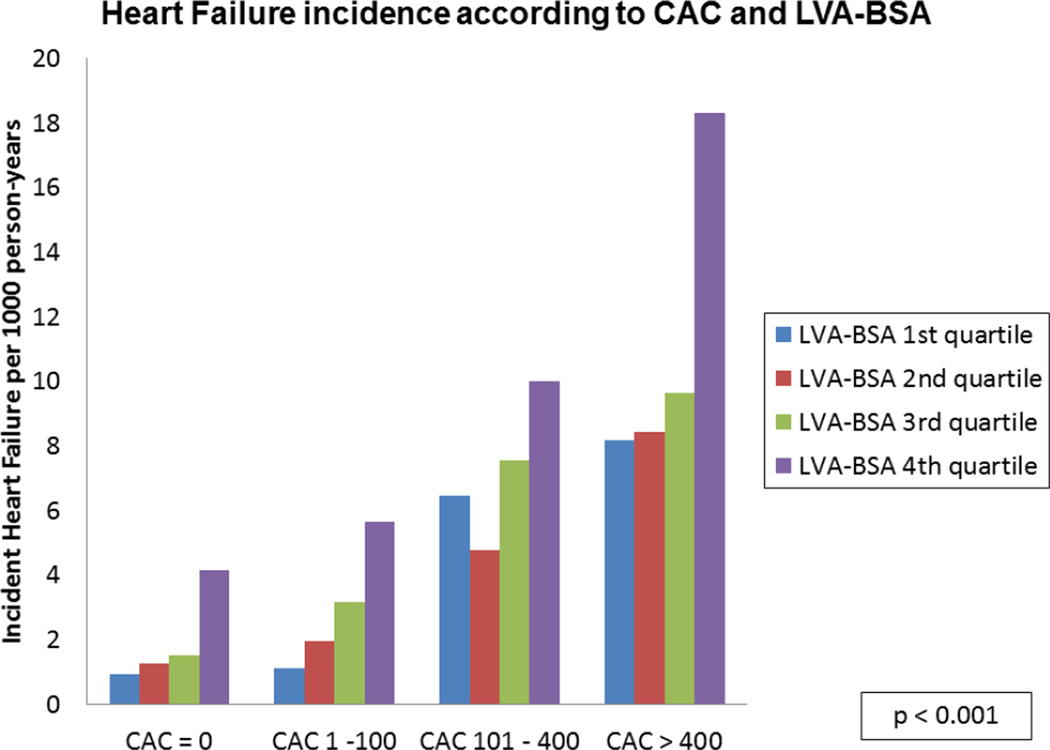
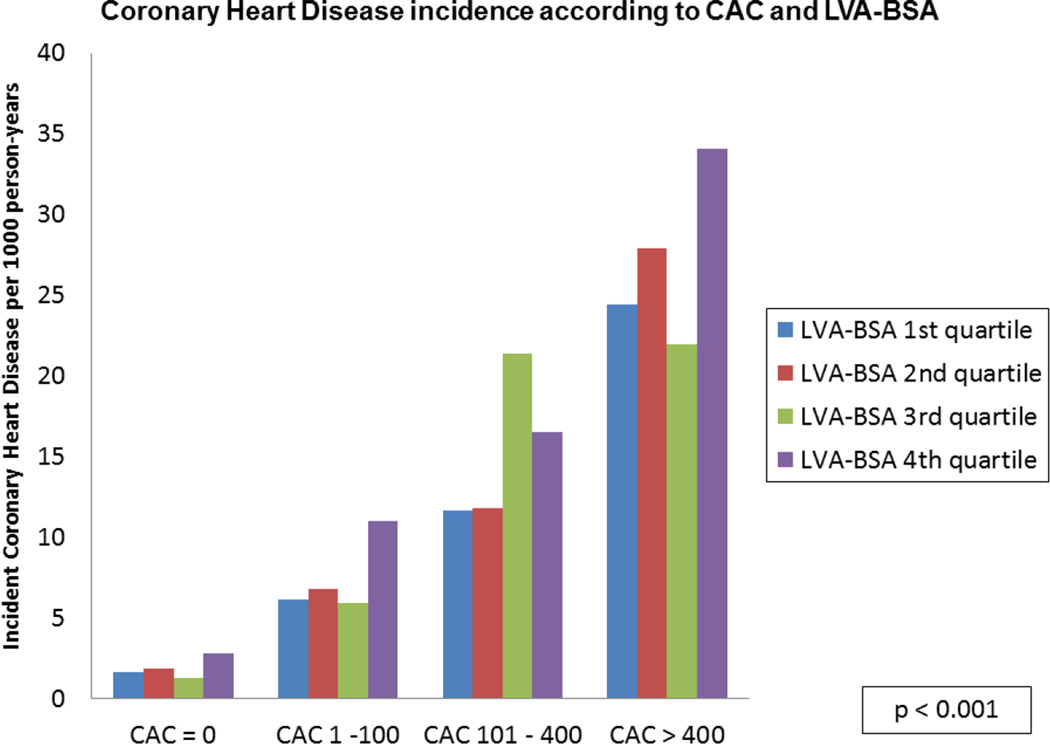
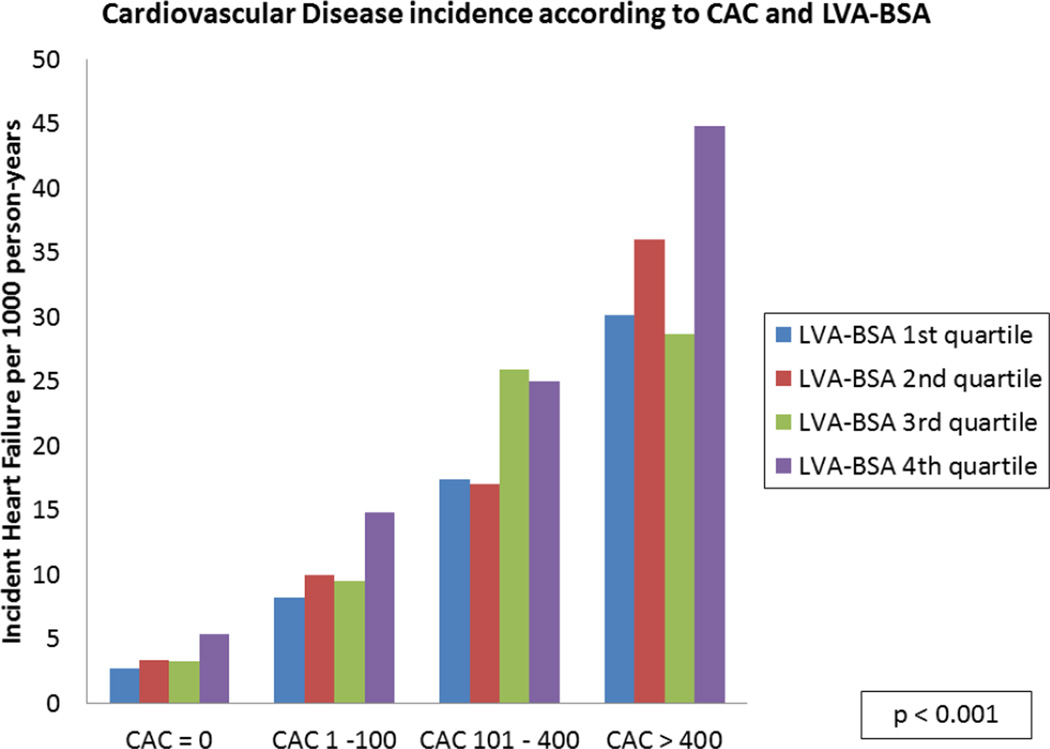
A stepwise increase in the incidence of HF for each CAC level was noted across the spectrum of LVA-BSA (p <0.001), though no significant interaction between the two was noted (figure 3A). A similar pattern was noted for the secondary outcomes of CHD and CVD (p <0.001, figures 3B and 3C).
Figure 3. HF, CHD and CVD event rates according to CAC categories and LVA-BSA quartiles.
A: Incidence rate of HF per 1000 person years. B: Incidence rate of CHD per 1000 person years. C: Incidence rate of CVD per 1000 person years.
Multivariable models for the prediction of events
Even after adjustment for all risk factors and ln (CAC+1), the LVA-BSA remained a significant predictor of incident heart failure with a hazard ratio (HR) of 1.15 (95%CI: 1.11 – 1.20, p<0.001) per 100 mm2/m2 increase. Similarly, LVA-BSA remained a significant predictor of future CHD events with a HR of 1.07 (95%CI: 1.03 – 1.10, p<0.001) per one standard deviation increase, of future hard CHD events with a HR of 1.29 (95%CI: 1.15 – 1.46), and of future CVD events, with a hazard ratio of 1.07 per 100 mm2/m2 increase. (95%CI: 1.04 – 1.10, p<0.001).
Improvement in prediction models
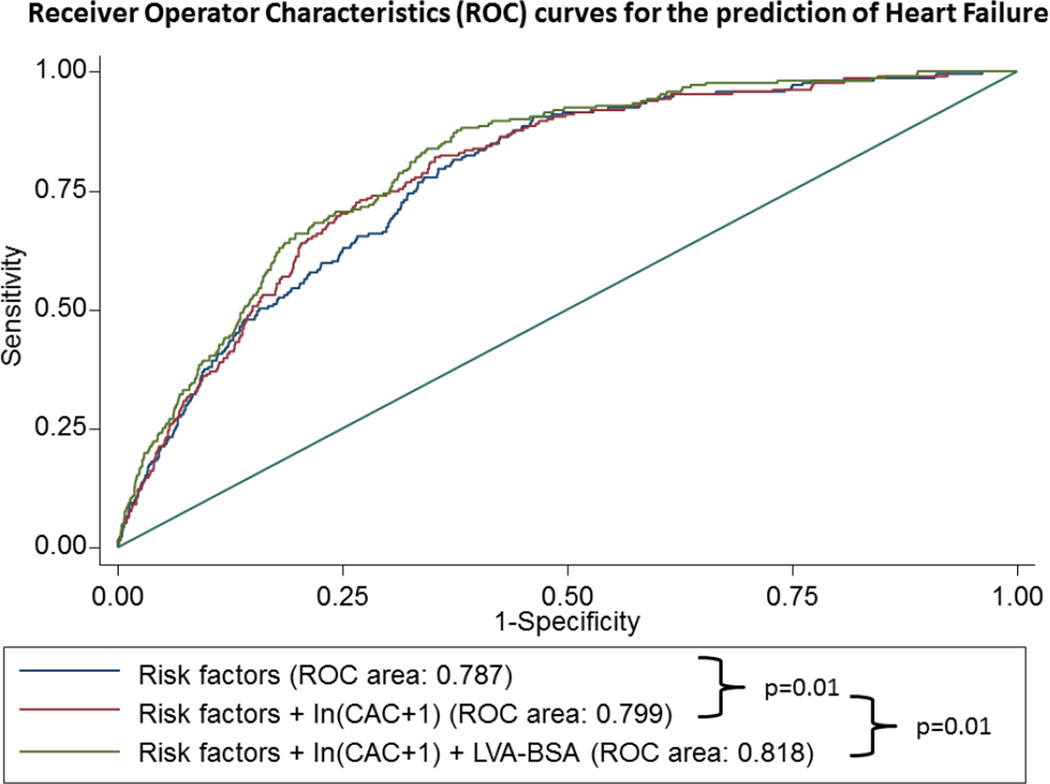
For the primary outcome of HF, the inclusion of the ln(CAC+1) to a model containing all clinical risk factors (model 1) resulted in a significant improvement in the area under the ROC curve from 0.787 to 0.799, p=0.01. Additionally, the inclusion of LVA-BSA resulted in an even further improvement in discrimination beyond the model including all risk factor plus CAC score, from 0.799 to 0.816, p=0.01 (figure 4A)
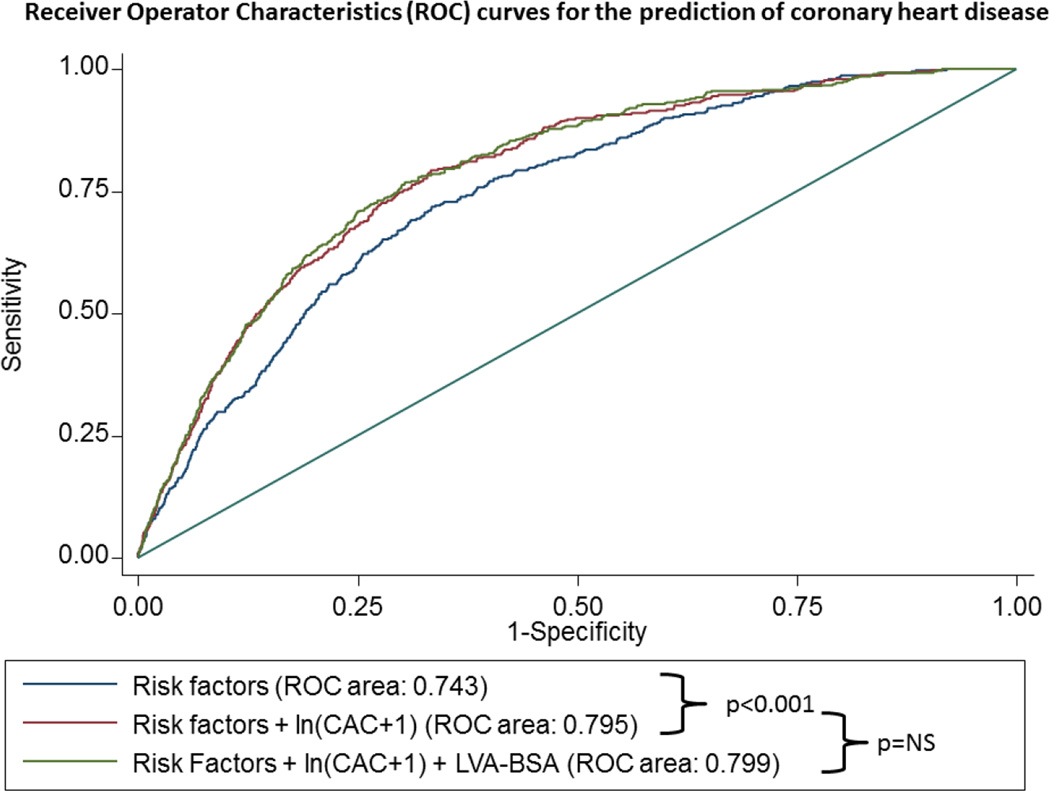
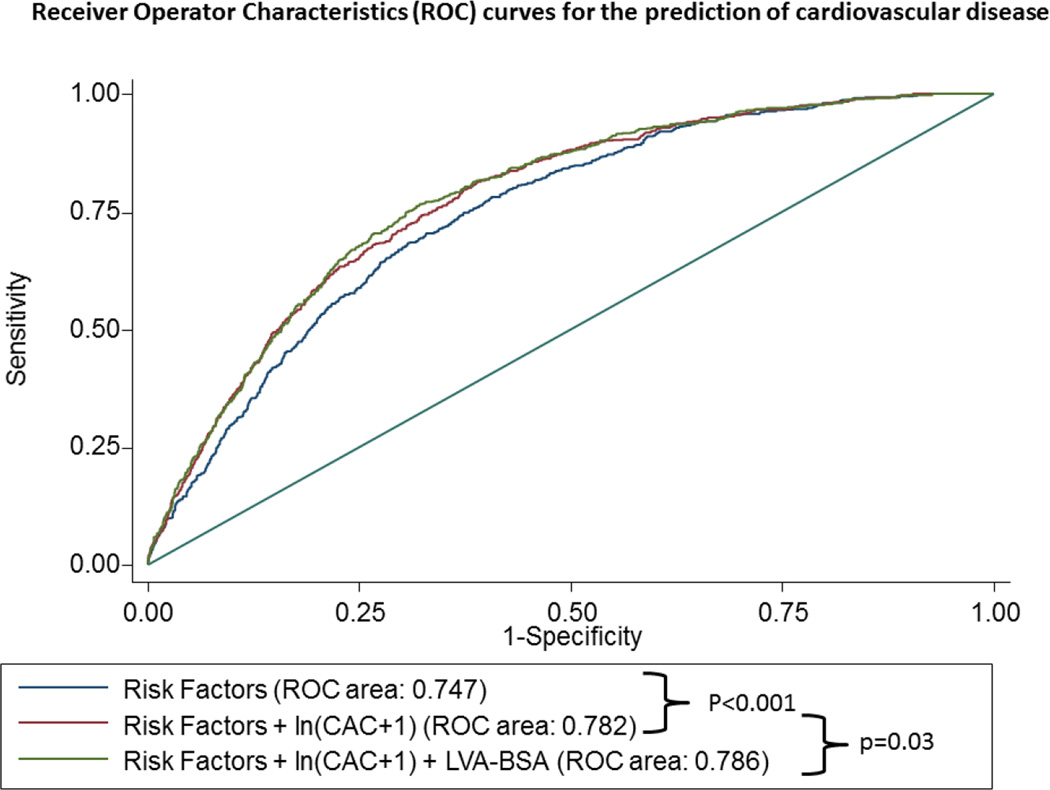
Figure 4. ROC curves of to predict HF (panel A), CHD (panel B) and CVD (panel C).
The blue line represents a model based on clinical variables only. The red line includes the clinical model plus the calcium score, whereas the green line also includes the LVA-BSA. The clinical model includes age, gender, race, and smoking status, family history of coronary heart disease, history of diabetes, history of hypertension, systolic and diastolic blood pressure, LDL, HDL, BMI, use of anti-hypertensive medication and use of lipid lowering medication.
For the secondary outcome of CHD, the inclusion of CAC score to the baseline model resulted in a significant increase in the area under the ROC curve from 0.743 to 0.795, p<0.001). The inclusion of LVA-BSA in a model containing risk factors and CAC score resulted in a small change in the area under the ROC curve which did not reach statistical significance (0.795 to 0.799, p-value not significant) (figure 4B).
For the secondary outcome of CVD, the inclusion of CAC score to the baseline model also resulted in a significant increase in the area under the ROC curve from 0.747 to 0.782, p<0.001. The inclusion of LVA-BSA in a model containing risk factors and CAC score resulted in a small but significant increase in the area under the ROC curve from 0.782 to 0.786, p-value not significant (figure 4C).
Discussion
Our study has demonstrated that a nCT performed to measure the CAC score also allows for measurement of the left ventricular size. This measurement is an independent predictor of incident heart failure and cardiovascular disease events as a whole. The inclusion of this measure in a model containing risk factors and CAC results in improved discrimination for heart failure. Our results demonstrate that this simple measure of LV size (which takes ~1 minute to measure and does not require any changes to current acquisition protocols) adds prognostic value even when a well-validated and powerful predictor of coronary events (i.e. CAC) is already included in the model.
Other studies have previously evaluated other measures of LV size as predictors of CHD, CVD and HF in asymptomatic individuals. Initial data from the Framingham study demonstrated that LV hypertrophy evaluated by ECG was associated with a 2 to 3-fold in the incidence of CHD.4 While more recent data with more appropriate adjustment for confounding has also suggested a relative risk of 2.3 for the presence of LV hypertrophy on the ECG,11 though a study by Mazza et al has shown that LVH detected on ECG has only a relative risk of 1.4 for the prediction of HF mortality.12 Others, however, have suggested that the clinical implications of ECG might be limited due to an extremely low sensitivity when compared to echocardiography.13
The prognostic importance of LV size has also been evaluated in prior imaging studies using echocardiography and magnetic resonance imaging. A classical echocardiography study has demonstrated that LV mass is directly associated with increased CVD and mortality,5 while more recent data has demonstrated that LV mass, lower ejection fraction and diastolic dysfunction are associated with combined CVD events including HF.
A prior analysis from the MESA cohort has shown that LV mass and volume measured by magnetic resonance are both independently associated with CHD, CVD and HF6. In these studies, extreme values of LV mass above the 95th percentile were the best predictors of HF, with an adjusted HR of 8.6. Interestingly, none of the other LV measures, such as LV mass to LV volume, were significantly associated with HF. Based on this, the authors proposed that the events were primary driven by the increase in LV mass. Our data, however, found that LV size was a significant predictor for all events. Even if the LV mass is the primary driver for events, as previously proposed, our data supports the use of LV size measured by nCT is an adequate surrogate marker of more precise LV measurements in the risk stratification of asymptomatic individuals. In fact, although nCT images are static and the lack of contrast does not allow for measurement of LV wall thickness, the measurement of the LV size measured by nCT is accurate and reproducible.7 Although the LV size measure on nCT has not been broadly studied, one recent publication has analyzed the predictive value of this measurement on CVD, and their results are comparable to the present data. However, their study was limited to CV events, and no data on heart failure was available.14
Since this information adds no additional cost or risk, it could easily be incorporated on clinical reports of CAC scans performed for routine clinical indications. Although no studies are currently indicated as screening methods for HF, current guidelines recommend interventions to prevent overt symptomatic HF in individuals of increase risk, even though at present such individuals would only be identified based on clinical characteristics.15
A secondary finding of our study was that CAC is an independent predictor of HF. Although there is evidence suggesting that CAC is associated with prevalent HF16 and with NT-pro-BNP17, no previous evidence that CAC can adequately predict incident HF was available. This finding is not unexpected, as about half of all incident cases of HF are caused by CHD.18 Nevertheless, no prior evidence that CAC was an independent predictor of incident heart failure exists. Lastly, the association of CAC and LVA-BSA provided complementary information for the prediction of both CHD and HF.
Although there is no data on strategies using LV size or CAC to identify and potentially treat individuals at risk for HF, our results suggest that the measurement of the LVA-BSA and CAC provides incremental value to predict HF. If an nCT is performed for other clinical indications, such as the evaluation of CAC for primary prevention, the measurement of LV size may help identify individuals at risk for the development of HF. Those asymptomatic individuals, who would otherwise not be investigated, could then be refereed for a more refined assessment of LV structure and function with echocardiography. However, future studies should evaluate whether this measurement can be used effectively to identify sub-groups of patients who may benefit from interventions aimed at reducing the risk of incident HF. Even if such strategies are proven to be clinically relevant, its cost-effectiveness implications would need to be evaluated prior to routine use.
Our study has several limitations. First, the traced area of the LV comprises both the cavity and the myocardial wall. Therefore, differentiating dilated from hypertrophic cardiomyopathies is not possible. Consequently, our method cannot be recommended as a tool to estimate the left ventricular function or wall thickness. However, it may work well as a screening tool for pre-clinical LV abnormalities. While we do not suggest that nCT should be used for routine screening of asymptomatic individuals for HF as this is not currently recommended for the general population, the additional information of LV size estimation by nCT might be of clinical interest in individuals who undergo a nCT for other reasons such as the CVD risk stratification with a CAC. Second, the appearance of the LV on an axial non-contrast study has variability and thus the size estimation may lack precision in patients who have a distorted LV geometry. Another potential source for variability is that tracing of the interventricular septum can be challenging. Third, if only regional changes in LV geometry are present without adverse remodeling, the overall LV size may be preserved. However, such scenarios are far more common in the presence of prior MI or CHD, which is likely to be clinically known. Despite the aforementioned technical challenges, the LVA-BSA measures are consistent predictors of events in our study. Fourth, the definition of HF in epidemiological studies rely on the data and tests at the time of diagnosis. Thus, limitations on the performance of diagnostic tests, such as echocardiograms or other measurement of left ventricular function may have influence the definition of events. However, this approach is the standard in most cohort studies due to the limitation of collecting data after the event has already occurred. Additionally, our study included both electron beam and multidetector nCT, which were performed under different protocols. Those differences in protocols may have resulted in variability in the LVA measurements. Thus, the actual values reported here may not be valid under different CT protocols. Finally, individuals with right heart dysfunction or heart failure with preserved ejection fraction may develop clinical symptoms of HF in the absence of any changes to LV dimensions. However, the inability to identify such cases by our methods of estimating LV size would only weaken its association with incident HF.
The results of our study show that LVA-BSA is a strong predictor of incident HF among asymptomatic individuals, which is incremental to traditional risk factors and to CAC. Therefore, we propose that this simple measure should be included as part of the nCT exam for all individuals who undergo CAC testing to further assess their HF and cardiovascular risk. Although no specific intervention to prevent or delay the presentation of HF in this population has been tested yet, individuals on the fourth quartile in our study may be referred to a clinical evaluation to review and treat any modifiable risk factor for HF. Selected individuals might also benefit from additional evaluation with echocardiography or cardiac MRI. Such an approach may allow for earlier identification of individuals at risk for heart failure, allowing early initiation of appropriate therapies, which may halt the progression of the disease.2 Importantly, among individuals referred for CAC testing, the screening approach proposed above would only require 1 additional minute of analysis (and likely far less once this measurement can be automated using currently used image interpretation software) at no additional cost or radiation. However, it is noteworthy, that nCT is not recommended solely for evaluating the LV size.
Conclusions
In an ethnically diverse population of asymptomatic individuals free from any baseline CVD or HF, the LV area measured by nCT is associated with incident HF events. This association is independent from and complementary to clinical risk factors and CAC score.
Supplementary Material
Acknowledgments
This research was supported by contracts N01-HC-95159, N01-HC-95160, N01-HC-95161, N01-HC-95162, N01-HC-95163, N01-HC-95164, N01-HC-95165, N01-HC-95166, N01-HC-95167, N01-HC-95168 and N01-HC-95169 from the National Heart, Lung, and Blood Institute and by grants UL1-TR-000040 and UL1-TR-001079 from NCRR. The authors thank the other investigators, the staff, and the participants of the MESA study for their valuable contributions. A full list of participating MESA investigators and institutions can be found at http://www.mesa-nhlbi.org.
Footnotes
Publisher's Disclaimer: This is a PDF file of an unedited manuscript that has been accepted for publication. As a service to our customers we are providing this early version of the manuscript. The manuscript will undergo copyediting, typesetting, and review of the resulting proof before it is published in its final citable form. Please note that during the production process errors may be discovered which could affect the content, and all legal disclaimers that apply to the journal pertain.
Conflict of interest: The authors report no conflicts of interest.
References
- 1.Members WG, Lloyd-Jones D, Adams R, et al. Heart Disease and Stroke Statistics—2009 Update. Circulation. 2009;119:e21–e181. doi: 10.1161/CIRCULATIONAHA.108.191261. [DOI] [PubMed] [Google Scholar]
- 2.Members WC, Hunt SA, Abraham WT, et al. ACC/AHA 2005 Guideline Update for the Diagnosis and Management of Chronic Heart Failure in the Adult. Circulation. 2005;112:e154–e235. doi: 10.1161/CIRCULATIONAHA.105.167586. [DOI] [PubMed] [Google Scholar]
- 3.Wang TJ, Levy D, Benjamin EJ, Vasan RS. The Epidemiology of “Asymptomatic” Left Ventricular Systolic Dysfunction: Implications for Screening. Annals of Internal Medicine. 2003;138:907–916. doi: 10.7326/0003-4819-138-11-200306030-00012. [DOI] [PubMed] [Google Scholar]
- 4.Kannel WB, Gordon T, Castelli WP, Margolis JR. Electrocardiographic left ventricular hypertrophy and risk of coronary heart disease. The Framingham study. Ann Intern Med. 1970;72:813–822. doi: 10.7326/0003-4819-72-6-813. [DOI] [PubMed] [Google Scholar]
- 5.Levy D, Garrison RJ, Savage DD, Kannel WB, Castelli WP. Prognostic implications of echocardiographically determined left ventricular mass in the Framingham Heart Study. The New England journal of medicine. 1990;322:1561–1566. doi: 10.1056/NEJM199005313222203. [DOI] [PubMed] [Google Scholar]
- 6.Bluemke DA, Kronmal RA, Lima JA, et al. The relationship of left ventricular mass and geometry to incident cardiovascular events: the MESA (Multi-Ethnic Study of Atherosclerosis) study. Journal of the American College of Cardiology. 2008;52:2148–2155. doi: 10.1016/j.jacc.2008.09.014. [DOI] [PMC free article] [PubMed] [Google Scholar]
- 7.Nasir K, Katz R, Mao S, et al. Comparison of left ventricular size by computed tomography with magnetic resonance imaging measures of left ventricle mass and volumes: The multi-ethnic study of atherosclerosis. Journal of cardiovascular computed tomography. 2008;2:141–148. doi: 10.1016/j.jcct.2008.01.003. [DOI] [PubMed] [Google Scholar]
- 8.Bild DE, Bluemke DA, Burke GL, et al. Multi-Ethnic Study of Atherosclerosis: Objectives and Design. American Journal of Epidemiology. 2002;156:871–881. doi: 10.1093/aje/kwf113. [DOI] [PubMed] [Google Scholar]
- 9.Bild DE, Bluemke DA, Burke GL, et al. Multi-ethnic study of atherosclerosis: objectives and design. American journal of epidemiology. 2002;156:871–881. doi: 10.1093/aje/kwf113. [DOI] [PubMed] [Google Scholar]
- 10.Carr JJ, Jennifer Clark N, Nathan DW, et al. Calcified coronary artery plaque measurement with cardiac CT in population-based studies: standardized protocol of Multi-Ethnic Study of Atherosclerosis (MESA) and Coronary Artery Risk Development in Young Adults (CARDIA) study. Radiology. 2005;234:35–43. doi: 10.1148/radiol.2341040439. [DOI] [PubMed] [Google Scholar]
- 11.Gottdiener JS, Arnold AM, Aurigemma GP, et al. Predictors of congestive heart failure in the elderly: the Cardiovascular Health Study. Journal of the American College of Cardiology. 2000;35:1628–1637. doi: 10.1016/s0735-1097(00)00582-9. [DOI] [PubMed] [Google Scholar]
- 12.Mazza A, Tikhonoff V, Casiglia E, Pessina AC. Predictors of congestive heart failure mortality in elderly people from the general population. Int Heart J. 2005;46:419–431. doi: 10.1536/ihj.46.419. [DOI] [PubMed] [Google Scholar]
- 13.Levy D, Labib SB, Anderson KM, Christiansen JC, Kannel WB, Castelli WP. Determinants of sensitivity and specificity of electrocardiographic criteria for left ventricular hypertrophy. Circulation. 1990;81:815–820. doi: 10.1161/01.cir.81.3.815. [DOI] [PubMed] [Google Scholar]
- 14.Dykun I, Geisel MH, Kalsch H, et al. Association of computed tomography-derived left ventricular size with major cardiovascular events in the general population: the Heinz Nixdorf recall study. Atherosclerosis. 2015;240:46–52. doi: 10.1016/j.atherosclerosis.2015.02.050. [DOI] [PubMed] [Google Scholar]
- 15.Hunt SA, Abraham WT, Chin MH, et al. ACC/AHA 2005 Guideline Update for the Diagnosis and Management of Chronic Heart Failure in the Adult: a report of the American College of Cardiology/American Heart Association Task Force on Practice Guidelines (Writing Committee to Update the 2001 Guidelines for the Evaluation and Management of Heart Failure): developed in collaboration with the American College of Chest Physicians and the International Society for Heart and Lung Transplantation: endorsed by the Heart Rhythm Society. Circulation. 2005;112:e154–e235. doi: 10.1161/CIRCULATIONAHA.105.167586. [DOI] [PubMed] [Google Scholar]
- 16.Kalsch H, Lehmann N, Mohlenkamp S, et al. Association of coronary artery calcium and congestive heart failure in the general population: Results of the Heinz Nixdorf Recall study. Clin Res Cardiol. 2010;99:175–182. doi: 10.1007/s00392-009-0104-3. [DOI] [PubMed] [Google Scholar]
- 17.Abdullah SM, Khera A, Das SR, et al. Relation of coronary atherosclerosis determined by electron beam computed tomography and plasma levels of n-terminal pro-brain natriuretic peptide in a multiethnic population-based sample (the Dallas Heart Study) The American journal of cardiology. 2005;96:1284–1289. doi: 10.1016/j.amjcard.2005.06.073. [DOI] [PubMed] [Google Scholar]
- 18.Fox KF, Cowie MR, Wood DA, et al. Coronary artery disease as the cause of incident heart failure in the population. European heart journal. 2001;22:228–236. doi: 10.1053/euhj.2000.2289. [DOI] [PubMed] [Google Scholar]
Associated Data
This section collects any data citations, data availability statements, or supplementary materials included in this article.


