

Summary
The ability of cells to count and remember their divisions could underlie many alterations that occur during development, aging, and disease. We tracked the cumulative divisional history of slow-cycling hematopoietic stem cells (HSCs) throughout adult life. This revealed a fraction of rarely dividing HSCs that contained all the long-term HSC (LT-HSC) activity within the aging HSC compartment. During adult life, this population asynchronously completes four traceable symmetric self-renewal divisions to expand its size before entering a state of dormancy. We show that the mechanism of expansion involves progressively lengthening periods between cell divisions, with long-term regenerative potential lost upon a fifth division. Our data also show that age-related phenotypic changes within the HSC compartment are divisional history dependent. These results suggest that HSCs accumulate discrete memory stages over their divisional history and provide evidence for the role of cellular memory in HSC aging.
Graphical Abstract
HSCs count and remember the number of times they have divided to limit the number of cell divisions, a mechanism that may underlie HSC aging.
Introduction
HSCs are bone marrow (BM) resident stem cells responsible for maintaining the hematopoietic system throughout life, and largely reside in a quiescent state (Nakamura-Ishizu et al., 2014). Studies on HSC cycling kinetics show the presence of a rare population of dormant HSCs that divide minimally over time and retain all the serially transplantable hematopoietic regenerative potential in the BM (Foudi et al., 2009; Qiu et al., 2014; Wilson et al., 2008). These dormant HSCs are identified by their ability to retain a pulsed histone 2B-green fluorescent protein (H2BGFP) label, and are referred to as label-retaining HSCs (LR-HSCs). LR-HSCs are believed to act as a reserve stem cell population, which can resist chemotherapeutic agents, but readily activate in response to stress (Essers et al., 2009; Wilson et al., 2008). LR-HSCs are known to retain labels for close to a year (van der Wath et al., 2009; Wilson et al., 2008), yet their role, or presence, throughout the entirety of adult life remains unknown.
Upon aging HSC regenerative potential declines. Aged HSCs show reduced self-renewal (Dykstra et al., 2011), impaired homing and engraftment upon transplantation (Dykstra et al., 2011; Morrison et al., 1996), and myeloid-biased differentiation (Beerman et al., 2010; Benz et al., 2012; Cho et al., 2008; Muller-Sieburg et al., 2004; Rossi et al., 2005; Sudo et al., 2000). Paradoxically, HSCs are reported to increase in number with age, both in mice and humans (Beerman et al., 2010; Cho et al., 2008; Dykstra et al., 2011; Morrison et al., 1996; Pang et al., 2011; Sudo et al., 2000). Current models of HSC aging suggest that the increase in HSC numbers compensate for defects that naturally occur with age, but evidence for this hypothesis is lacking (Geiger et al., 2013).
Our previous work showed that as HSCs progressively divide, they gradually lose regenerative capacity (Qiu et al., 2014). Many characteristics of aged hematopoiesis can be replicated by enforcing HSC proliferation (Beerman et al., 2013; Walter et al., 2015). Thus, we hypothesized that HSC aging may be a direct result of extensive proliferative history accrued throughout life. This requires a better understanding of how HSCs naturally cycle over long periods of time.
Here we report a population of HSCs capable of retaining H2BGFP for at least 22 months in vivo. This population of stable label-retaining HSCs (sLR-HSCs, cells capable of retaining a pulsed H2BGFP label for greater than 10 months) contains all cells capable of robust multi-lineage engraftment in primary and secondary transplantation (hereafter referred to as long-term (LT−) HSCs) in aging BM when assayed at the clonal level. We find that LR-HSCs decline in frequency within the stem cell compartment but accumulate in absolute number in the BM with age. This accumulation process follows a model in which LR-HSCs undergo symmetric self-renewal events with progressively lengthening periods between cell divisions until LR-HSCs reach a state of complete dormancy after four traceable self-renewal events. Our results show a direct link between cell division events and HSC behavior, and suggest that HSCs can count and retain a memory of their cell divisions during adult life.
Results
A small population of LR-HSCs exists throughout adult life
To assess the cumulative divisional history of HSCs throughout adult life, we used a tet-off hematopoietic stem and progenitor cell (HSPC) specific H2BGFP label-retaining system (Qiu et al., 2014). This system allows HSPCs to be continuously labeled with H2BGFP throughout development and ontogeny, ensuring thorough and robust labeling of the HSC compartment (cells defined as Lineage−Sca-1+cKit+CD48−Flk2−CD150+) at the onset of doxycycline (dox) chase (Figure 1B). At the onset of adulthood, a fully labeled HSC compartment can dilute GFP 7–8 times before reaching background levels (Figure S1A). However, after the onset of adulthood, active regulation of the hCD34 promoter to drive H2BGFP expression is specific to only a subset of the HSC compartment (Figure S1B–S1F).
Figure 1. LR-HSCs Persist in BM Throughout Life and Contain All LT-HSC Activity in Aging BM.

(A) Schematic of long-term dox treatments. 2–4 month old 34/H2BGFP mice were placed on dox for periods ranging from 3–22 months. At the end of dox chase BM was analyzed for the presence of LR-HSCs. (B) Histogram of LSKCD48−Flk2−CD150+ HSC compartment before and after 12 month dox chase. LR-HSCs were determined by gating above the background GFP levels of single transgenic TetO-H2BGFP HSCs. (C) Time course of label dilution after initiation of dox chase; n=2–15 mice per time point. (D) Percent of HSCs that are label-retaining after 10–22 months of dox chase (sLR-HSCs). n=42 mice from 12 independent experiments. (E–L) HSC populations were sorted from 19 month-old mice chased with dox for 15 months into Total, GFPHi, and GFPLo HSC populations. 200 cells from each population were competitively transplanted per mouse. (E) Gating strategy for Total, GFPHi, and GFPLo HSC fractions. (F–G) Blood chimerism of granulocytes (F), and total white blood cells (G) during primary and secondary transplants. (H–J) Analysis of donor-derived stem and progenitor cell compartments in recipient BM. Gating strategy (H) and quantification of donor-derived HSPCs in primary (I) and secondary (J) transplantations after 22 and 24 weeks respectively. (K–L) Lineage distribution of donor-derived peripheral blood in primary (K) and secondary (L) hosts at 22 and 24 weeks respectively. Transplant data are represented as mean ± SEM of 8–14 mice per group from two independent experiments. *P<0.05, **P<0.01, ***P<0.001 by Welch’s t test. See also Figure S1 and Figure S2.
We placed young adult mice on dox chases ranging from 3–22 months (Figure 1A). The percentage of H2BGFP+ cells rapidly declines initially but plateaus after 10 months and remains relatively constant for chases lasting nearly 2 years (Figure 1C). After 10–22 months on dox, sLR-HSCs represent 3.24 ± 1.26% (mean ± SD) of the HSC compartment (Figure 1D). To eliminate the possibility that sLR-HSCs are an artifact of leaky H2BGFP expression, we analyzed the HSC compartment of mice exposed to dox from conception until adulthood (Figure S2A). These mice did not express H2BGFP above background levels at adulthood (Figure S2B) or after exposure to dox for up to one year (Figure S2C–S2E). Together these results show that a small population of cells within the HSC compartment divides minimally throughout the majority of adult life.
sLR-HSCs contain all LT-HSC activity within aging BM
To test the function of sLR-HSCs, we performed competitive transplants with aging GFPLo, GFPHi (sLR-HSCs), and Total HSC populations sorted from 19 month-old mice chased with dox for 15 months (Figure 1E). In primary recipients, all three populations stably engrafted, but the GFPHi population showed significantly higher levels of blood chimerism compared to the GFPLo and Total populations (Figure 1F and 1G). The Total HSC population showed intermediate levels of chimerism in primary recipients. In secondary hosts, only the Total and GFPHi populations sustained secondary engraftment, while GFPLo HSCs progressively declined until exhaustion by the end of 24 weeks (Figure 1F and 1G, and Table S1). At sacrifice we analyzed regeneration of primitive HSPC compartments in the BM (Figure 1H). We found that after both transplants, GFPHi cells generated higher HSPC chimerism compared to GFPLo cells (Figure 1I and 1J). However, when compared to the Total population, GFPHi cells showed greater regeneration only in the HSC population after primary transplant, with no difference after secondary transplant. Taken together the data show that the small proportion of GFPHi sLR-HSCs—identifiable only by their minimal divisional history—contain all of the LT-HSC potential within the aging HSC compartment.
Increased divisional history marks increased myeloid potential
Aged HSCs show increased myeloid cell output upon transplantation (Beerman et al., 2010; Benz et al., 2012; Cho et al., 2008; Dykstra et al., 2011; Gekas and Graf, 2013; Sudo et al., 2000). To understand how proliferative history correlates with lineage reconstitution we measured lineage output in the blood of primary and secondary transplant recipients. While all three aging HSC populations show increased myeloid output in primary transplant, similar to the blood of unmanipulated aging mice (Figure 1K), only GFPHi cells maintained this myeloid output in secondary recipients (Figure 1L). As GFPLo grafts exhausted by the end of secondary transplantation (Figure 1F and Table S1), we hypothesized that this fraction may be enriched for myeloid progenitors found within the HSC compartment lacking self-renewal capacity.
While highly enriched for HSCs, the HSC compartment is heterogeneous. CD41 has been reported to mark myeloid and megakaryocyte progenitors within the HSC compartment (Haas et al., 2015; Yamamoto et al., 2013), and it’s expression increases with age (Gekas and Graf, 2013). Given that myeloid-restricted repopulating cells accumulate in aged mice (Dykstra et al., 2011; Sudo et al., 2000), we hypothesized that by examining CD41 expression we would better understand both the heterogeneity and the myeloid potential within aging HSC compartments.
We first compared the primitive stem and progenitor compartments of young and aging mice. Consistent with other reports (Beerman et al., 2010; Dykstra et al., 2011), CD150+ cells marking the HSC compartment increase with age (Figure 2A, B, S3A, and S3B). However, the vast majority of this expanded compartment is CD41+ (Figure 2C, 2D, S3C, and S3D). Within the HSC compartment CD41+ cells accumulate with age (Figure 2E, 2F, S3E and S3F). Dissecting the HSC compartment further using label-retention, we find the Total and GFPLo populations show similar increases in CD41 expression with age, but young and aging GFPHi populations are depleted of CD41+ cells (Figure 2E and 2G). Cell cycle analyses show CD41+ cells have a lower percentage of cells in G0 than CD41− cells (Figure S3I and S3J), and retain lower levels of H2BGFP over time (Figure S3K and S3L). These data show that CD41 expression on HSCs correlates with diminished quiescence and a higher rate of cycling in vivo. Examining megakaryocyte potential, we found that the Total, GFPLo, and GFPHi HSC populations from young and aging animals all generated colonies in vitro that contained large cells with megakaryocyte morphology (Figure S4E and S4G), but only the Total and GFPLo populations generated colonies exclusively containing large megakaryocytes (Figure S4D and S4G).
Figure 2. CD41 Expression on Young, Aging, and LR-HSCs.

FACS analysis and quantification of the primitive HSPC compartment from young and aging mice. (A) CD150+ cells marking the HSC compartment in young and aging BM. (B) Quantification of (A). (C) The same populations in (A) displayed as a function of CD150 and CD41 expression. (D) Quantification of (C). (E) CD41 expression on Total, GFPLo, and GFPHi HSCs. (F) Quantification of CD41 expression on Total HSCs. (G) Ratio of CD41− to CD41+ HSCs found in Total, GFPLo, and GFPHi HSCs. Data are represented as mean ± SEM of 9–11 mice per group from 3 independent experiments. **P<0.01, ***P<0.001 by Welch’s t test. See also Figure S3 and Figure S4.
Clonal analysis of aging HSC populations based on label-retention and CD41 expression
Lineage reconstitution, cell-surface marker, and cell cycle analyses suggest that the expanded aging HSC compartment may be dominated by myeloid progenitors rather than HSCs. To test this, we performed limiting cell number serial transplants of aging HSC populations based on label-retention and CD41 expression. We sorted the HSC compartment from 19-month old mice chased with dox for 17 months into four populations: GFPHiCD41−, GFPHiCD41+, GFPLoCD41−, and GFPLoCD41+ (as in Figure 2E). 15 cells from each population were then competitively transplanted and the donor-derived myeloid, B, and T cell contributions to peripheral blood were followed in both primary and secondary hosts. Because we were looking for any form of repopulating activity and not just stem cell activity, we considered a mouse repopulated if at any point during primary transplantation we found any donor-derived lineage to contribute to >0.1% of total circulating leukocytes (Figure 3A; (Yamamoto et al., 2013)). Based on this definition of repopulation, we performed limiting dilution analysis to determine the clonality of our transplanted populations, revealing that most of the mice were repopulated at or very near clonal levels (Table S2).
Figure 3. Clonal Analysis of the Aging HSC Compartment Based on CD41 Expression and Label-Retention.

The HSC compartment was sorted from 19-month old mice chased with dox for 17 months into four populations based on CD41 expression and label retention, and transplanted at a dose of 15 cells per mouse. (A) Reconstitution curves of donor-derived (CD45.2+) total white blood cells, myeloid, B cells, and T cells for each transplanted mouse through 24 weeks in primary and secondary recipients. The transition from primary to secondary transplantation is marked by the x-axis break. The horizontal line marks the threshold of successful reconstitution. (B) Examples of the five reconstitution patterns observed. Definition of repopulation patterns: myeloid-restricted only repopulated myeloid cells; bipotent progenitors gave rise to myeloid and B cells; ST-HSCs showed transient repopulation of all three lineages, with donor chimerism of at least one lineage dropping below threshold by 24 weeks after primary transplantation; IT-HSCs repopulated all three lineages, but had at least one lineage drop below threshold by 24 weeks after secondary transplantation; and LT-HSCs maintained repopulation in all three lineages above threshold throughout both primary and secondary transplantation (C) Distribution of repopulating cell types found within each aging HSC compartment. The zoomed region represents 10% of the Total HSC compartment. (D) Heat maps displaying the regeneration of primitive BM populations by clonally transplanted aging HSCs after primary transplant. Transplanted cell populations are listed above each column—initially sorted cell (left panel) and retrospectively categorized repopulating cell (right panel). Regenerated HSPC types are listed to the right. The darker the chamber, the greater the proportion of reconstituted mice regenerated the given cell type. Numbers within each chamber represent the percentage in decimal format of reconstituted mice with each cell type. See also Figure S5.
As a further measure to validate clonality, we transplanted BM from a single primary host into two secondary hosts. Daughter HSCs generated from the same initial parent HSC in vivo show synchronous repopulation kinetics when transplanted into separate hosts (Muller-Sieburg et al., 2002). Thus, in secondary transplants we followed the kinetics of total donor-type (CD45.2+) repopulation in paired secondary hosts and measured the degree of synchronicity between them using Hamming distance clustering (Sieburg and Muller-Sieburg, 2004). 37 of the 46 mice initially transplanted survived through 6 months in primary hosts. 24 of those showed repopulation above threshold in primary recipients and were used for paired secondary transplantation. 23 of the 24 secondary transplant pairs were used for Hamming distance analysis, as one of the mice in the 24th pair died before the first blood analysis. From the 23 pairs analyzed, 18 showed synchronous kinetics of donor-type repopulation in secondary hosts, indicative of clonal repopulation (Figure S5).
For analysis of repopulating patterns, all 24 repopulated mice were considered. From the 24 repopulated mice, we observed 5 distinct repopulation patterns: myeloid-restricted, bipotent progenitor, short-term HSC (ST-HSC), intermediate-term HSC (IT-HSC), and LT-HSC patterns (Figure 3B). We quantified the heterogeneity of repopulation patterns within each sorted population and found LT-HSC repopulation was exclusively confined to the GFPHi fractions (Figure 3C). GFPHi cells showed only IT- and LT-HSC repopulation patterns, which were similarly represented regardless of CD41 expression (Figure 3C). In contrast, the GFPLo cells showed limited self-renewal potential and greater heterogeneity of repopulating patterns. We found CD41 expression enriched for myeloid-restricted repopulating cells within the GFPLo compartment (Figure 3C). Finally, we used the proportion of repopulating cell types found within each sorted HSC fraction to extrapolate the representation of repopulating cell types found within the total aging HSC compartment. Remarkably, LT-HSCs only represent roughly 1% of the repopulating cells of the total aging HSC compartment (Figure 3C). Instead, we found that cells with limited self-renewal represent ~80% of repopulating cells of the aging HSC compartment, with 38% myeloid progenitors (Figure 3C).
After primary transplant, we analyzed recipient BM for donor-derived regeneration of various stem and progenitor cell compartments (Figure 3D). When comparing regeneration based on sorted cell phenotype, GFPHi cells repopulated each compartment with higher efficiency than GFPLo cells. Notably, both GFPHiCD41+ and GFPHiCD41− cells generated CD41− and CD41+ HSCs with similar efficiencies. Within the GFPLo fractions, GFPLoCD41− cells more efficiently at regenerated the more primitive compartments than the GFPLoCD41+ cells, which primarily made myeloid progenitors (Figure 3D). When comparing regeneration based on retrospectively assigned repopulating cell type, as expected the most primitive cell types show the most robust regeneration efficiencies, while the more developmentally restricted cell types showed reduced regeneration capacities. Interestingly, both LT- and IT-HSC patterns showed impaired regeneration of common lymphoid progenitors (CLPs), consistent with aging HSC phenotypes (Rossi et al., 2005).
Together, these data support the conclusion that LT-HSCs residing in aging BM are exclusively found in the rare population of sLR-HSCs (~3%), and that the vast majority of the HSC compartment (~97%) consists of repopulating cells with limited self-renewal and restricted differentiation potential. This ability allows us to see that the dramatic expansion of the phenotypic HSC compartment with age is primarily due to the expansion of proliferative progenitors with limited regenerative potential.
Tracking GFP label dilution reveals that LR-HSCs symmetrically self-renew throughout adult life
Next, we wanted to address how functional HSC numbers expand with age. While the HSC compartment expands dramatically with age (Beerman et al., 2010; Dykstra et al., 2011; Rossi et al., 2005; Sudo et al., 2000), functional LT-HSC numbers within aging BM expand but to a lesser extent (Cho et al., 2008; Morrison et al., 1996; Sudo et al., 2000). Our previous studies showed, and this study confirms at the clonal level, that independent of cell surface marker expression all LT-HSCs are LR-HSCs (Figure 3; (Qiu et al., 2014)). Thus we investigated the phenomena of functional HSC expansion further by utilizing information from our total LR-HSC populations, regardless of CD41 expression.
First we examined H2BGFP label dilution in young mice. In the GFPHi HSC fraction, we find 5 distinct subpopulations of cells associated with GFP peaks (Figure 4A). These peaks are identifiable using the proliferation index utility in Flowjo software (Treestar), indicating that they are associated with successive cell divisions where divisional history increases as cells progress from peak 0 to peak 4. To test if the observed peaks represent actual cell division events we extracted GFP intensity data from GFPHi HSCs of young mice and analyzed the relative positions of each of the observed GFP peaks. We found that the positions of these peaks are very well described by a simple model in which GFP dilutes by a factor of 2 through each cell division (Figure 4C). This suggests that these peaks are indeed marking cell division events, and that we can use the GFP peaks found within the GFPHi cells to quantify cell divisions over time in vivo.
Figure 4. HSCs Count Symmetric Self-Renewal Divisions Throughout Adult Life and Progress Towards Dormancy.

(A–C) Analysis of H2BGFP subpopulations within the GFPHi LR-HSC compartment. (A) Histogram displaying the H2BGFP peaks 0–4 visible within the LR-HSC compartment of young (3–4 months on dox) and aging mice (14–22 months on dox). (B) Quantification of (A). n=21 and 13 mice from 6 independent experiments for young and aging mice, respectively. (C) Least squares fitting of single cell GFP intensity data collected from LR-HSCs found within each GFP peak of young mice. Observed experimental data are plotted as open circles, while predictions of a theoretical model in which H2BGFP concentration is reduced by a factor of 2 with each cell division is given by the dashed blue line. Experimental data were collected from 1568 single LR-HSCs from 6 independent experiments. (D) Percentage of LR-HSCs within the HSC compartment. (E) Absolute number of LR-HSCs per long bone in young and aging mice. Predicted LR-HSC numbers were generated by extrapolating the expansion of each young LR-HSC data point based on the distribution of cells found in peaks 0–4 for each mouse using the model in panel (F), then corrected based on the average distribution of cells found in aging mice in panel (B). Data are mean ± SEM of 17 and 10 mice from 5 and 3 independent experiments for young and aging mice respectively. (F) Symmetric self-renewal expansion model of LR-HSCs. As LR-HSCs slowly divide throughout adult life they transition from peak 0 to peak 4, symmetrically self-renewing to double their numbers with each cell division. Arrows in the histogram depict the expansion capacity of cells as they progressively divide to reach peak 4. Numbers displayed are the average numbers of LR-HSCs in each peak per long bone from 17 young mice in 5 independent experiments. Boxed in red is the summation of LR-HSCs predicted to accumulate in peak 4 with aging. (G) Mathematical modeling of cell cycle progression as a function of divisional history within the LR-HSC compartment. Five models were considered (see Methods for details). Displayed are representations of cell cycle time progressions for each model (red dashed lines), as well as the experimentally determined (open circles) and model predicted sLR-HSC numbers (dashed blue curves) found in each GFP peak of aging mice. Cell cycle times for the step function and super-exponential models are actual times predicted by the model. As the constant, linear, and exponential models do not fit the data well, their corresponding cell cycle times are only visual representations. (H–I) Distribution of LR-HSCs across each GFP peak (H), and quantification of LR-HSC absolute numbers after various lengths of dox chase (I). Legends refer to the length of dox chase. Data are representations of 2–6 independent experiments per group. (J) Cell cycle analysis of GFP Peak cells in young (5 months old, 3 month dox chase, n=3) and aging (11 months old, 9 month dox chase, n=2) mice. Each mouse represents an independent experiment. See also Figure S6.
Next we compared the GFP peaks from young and aging LR-HSC populations. Although LR-HSCs from young mice display 5 distinct GFP peaks, 97.4% of sLR-HSCs from aging mice are found within peak 4 (Figure 4A and 4B). This suggests that the vast majority of sLR-HSCs have completed 4 traceable cell divisions. We then quantified the absolute number of LR-HSCs in the leg bones of young and aging mice. Even though LR-HSC representation decreases between young and aging mice (Figure 4D), we find that the absolute number of LR-HSCs within the BM increases two-fold with age (Figure 4E).
To summarize, transplantation experiments indicate that all LT-HSC activity is contained within the LR-HSC fraction in both young and aging mice (Figures 1 and 3). Thus, our findings show that 1) LT-HSCs are exclusively LR-HSCs regardless of age, 2) the absolute number of LR-HSCs increases over time, 3) the majority of sLR-HSCs have completed 4 divisions during the span of dox chase, and 4) H2BGFP is not re-expressed in the presence of dox. Taken together these data suggest that expansion of LR-HSC numbers is due to symmetric self-renewal events of LR-HSCs during the lifespan of the mouse.
To test this, we used a simple model to estimate the expansion capacity of LR-HSCs from young mice (Figure 4F). First we quantified the absolute numbers of LR-HSCs found in each peak in young mice. As >95% of sLR-HSCs in aging mice are found in peak 4, we modeled LR-HSC expansion with age as population doublings of each GFP peak as the cells divide to dilute their H2BGFP level from their starting peak in young mice to peak 4. This generated a prediction of sLR-HSC numbers once every young LR-HSC had divided enough to match the GFP intensity found in peak 4. We found that the predicted values closely matched the experimentally acquired data from aging mice (Figure 4E). Of note, this model assumes no loss of LR-HSC number due to cell death, differentiation, or cell division events resulting in GFP dilution to levels below peak 4. The correlation between predicted and experimental data suggests LR-HSCs cycle symmetrically, generating two daughter LR-HSCs with each division, which we can visualize a maximum of 4 times, and that LR-HSCs found in peak 4 in young mice remain deeply dormant throughout adult life.
LR-HSC cell cycle times extend with divisional history until dormancy is reached after 4 traceable divisions
To investigate this age-related LR-HSC number expansion, we used LR-HSC numbers from young mice as initial conditions for a series of mathematical models to determine whether divisional history impacts LR-HSC cell cycle progression (see Materials and Methods). The first model assumes that cells divide at a constant rate regardless of divisional history (Figure 4G; Constant). Because GFP will ultimately dilute away in all cells under this model, it cannot explain LR-HSC accumulation with age and suggests that divisional history impacts LR-HSC cell cycle progression time. To account for this accumulation, we considered a revised model in which individual cells cycle at a constant rate until they have divided 4 times, at which point they stop dividing. This modified model explains the data well (Figure 4G, Step Function), but makes the strong assumption that cells cycle normally until they have divided 4 times and then suddenly stop dividing. We reasoned that this was not likely, but rather that successive cell divisions become progressively less likely to occur the more a cell has divided previously. This prompted us to further adjust our model to understand how cell cycle entry alters with divisional history. Both linear and exponential extensions of cell cycle entry times with divisional history did not accurately predict cell numbers in aging mice. However, a super-exponential extension was found to fit the experimental data well (Figure 4G). This model, predicts cell cycle times for cells in peak 0, 1, and 2 are short, but as cells undergo further divisions, the time to cell cycle srapidly increase until the expected time to cell cycle in peak 4 is 1256 days, or roughly 3.5 years. Importantly, this model predicts rather than assumes that cells enter a dormant state once they reach peak 4, and therefore explains why cells found in peak 4 in young mice are still present in aged mice.
To test these predictions, we examined the change in GFP peak distribution and LR-HSC absolute numbers after various lengths of dox chase. Consistent with the super-exponential model of cell cycle extension, we find cells in peaks 0, 1, and 2 are almost completely lost after a 3–4 month chase, and the vast majority of LR-HSCs are found in peak 4 as soon as 9 months after the start of dox (Figure 4H). Additionally, LR-HSC doubling is seen as early as 12 months after dox treatment and is maintained until at least 22 months on dox, corresponding to 25 months of age (Figure 4I). If peak 4 cells were to continue to proliferate during these long chases, LR-HSC numbers should decrease over time. Rather we find that LR-HSCs numbers are stable, suggesting that indeed once cells reach peak 4 they are dormant. We found one exception, where a 24 month-old mouse had significantly lower numbers of sLR-HSCs than what would be predicted (Figure 4I, red asterisk). Upon dissection, this mouse had an enlarged liver with multiple tumors (data not shown), indicative of a severe systemic stress, which may have led to the activation and depletion of sLR-HSCs in this mouse. Cell cycle profiles of young and aging peak 4 cells showed greater than 90% of cells in G0, suggesting that the cell cycle of these cells do not change with time (Figure 4J and S6). Taken together, these analyses suggest that LR-HSCs double their cell numbers with time by entering a dormant state after 4 traceable symmetric self-renewal divisions, indicating that LR-HSCs count their cell divisions throughout life.
CD41+ sLR-HSCs are generated from CD41− LR-HSCs throughout adult life
In order to see if a cell division counting mechanism could underlie other changes seen in the HSC compartment with age, we re-examined the hierarchical relationship between CD41− and CD41+ LR-HSCs. CD41+ cells do not function as LT-HSCs at the clonal level in young adult mice (Yamamoto et al., 2013), but in the aging HSC compartment CD41+ HSCs have been shown to reside at the top of the hematopoietic hierarchy (Gekas and Graf, 2013). In order to understand how CD41+ cells develop LT-HSC potential with aging, we compared the H2BGFP label dilution of CD41− and CD41+ cells within the GFPHi LR-HSC fractions of young and aging mice. We observe that young CD41− LR-HSCs are distributed throughout all five GFP peaks, while the vast majority of young CD41+ cells are primarily found in peak 4, similar to the distribution of the aging compartment (Figure 5A). CD41+ LR-HSCs increase considerably in number and frequency with age (Figure 5D, S3G, and S3H), but given that the majority of CD41+ LR-HSCs can no longer divide and retain LT-HSC potency, it would not be possible for young CD41+ LR-HSC to generate the expanded population of CD41+ sLR-HSCs found in aging mice. Thus, we wondered whether CD41− LR-HSCs from young mice are responsible for generating the expanded population of CD41+ sLR-HSCs found in aging mice.
Figure 5. Young CD41− LR-HSCs Generate CD41+ sLR-HSCs in Aging Mice.

(A) Distributions of CD41− (left) and CD41+ (right) LR-HSCs in young and aging mice across GFP peaks 0–4. (B) Representative histograms directly comparing GFP levels in CD41− and CD41+ LR-HSCs from young (left) and aging (right) mice. (C) GFP mean fluorescence intensity (MFI) of CD41− and CD41+ LR-HSCs in young and aging mice. n=9–11 mice per group from 3 independent experiments. (D) Quantification of CD41− and CD41+ LR-HSCs in young and aging mice. Predicted expansion capacity of young HSCs as predicted by the model in Figure 4F. n=6–7 mice from 2 independent experiments. (E) Mathematical modeling of CD41− LR-HSC contribution to the CD41+ LR-HSC compartment. Predictions of a model in which the cell cycle time extends super-exponentially with the number of cell divisions (see Figure 4G) and in which CD41− LR-HSCs gain CD41 expression with probability 1 − α each time they divide are given in blue (full model details in Methods). This model most accurately fits the data when α = 0.88, suggesting that approximately 1 in every 10 CD41− LR-HSC divisions gives rise to a CD41+ daughter cell. Data are displayed as mean ± SEM *P<0.05, **P<0.01, ***P<0.001 by Welch’s t test or paired t test.
Direct comparison of CD41− and CD41+ LR-HSCs from young mice showed that CD41− LR-HSCs have a greater proportion of cells with a minimal divisional history in GFP peaks 0–3 than CD41+ LR-HSC (Figure 5B). However, with aging both CD41− and CD41+ sLR-HSCs have similar GFP distributions where most cells reside in peak 4 (Figure 5B). To quantify this we measured GFP fluorescence intensities of each population and observed brighter GFP in young CD41− over CD41+ LR-HSCs, but find indistinguishable intensities in aging mice (Figure 5C). Importantly, CD41− cell GFP intensity drops with age, but the GFP intensity of the CD41+ population does not change. As CD41+ cells more rapidly proliferate than CD41− cells (Figure S3J) and the CD41+ LR-HSC population expands with time (Figure 5D), either CD41− LR-HSCs found in GFP peaks 0–3 directly generate CD41+ LR-HSCs, or CD41 expression becomes dynamic with age and CD41− LR-HSCs turn on CD41 expression in a manner that does not alter their regenerative potential (Figure 3C and 3D).
To test this we compared the change in absolute numbers of CD41− and CD41+ LR-HSCs with age to their predicted expansion capacity from young mice (as in Figure 4F). We found that while CD41− cells expand minimally from young to aging mice, young CD41− LR-HSCs have the capacity to expand nearly 3 fold and still retain the GFP label (Figure 5D). In contrast, CD41+ LR-HSCs show a 3 fold expansion from young to aging mice, but contain no endogenous expansion capacity (Figure 5D). Thus in order for CD41+ LR-HSC numbers to expand, CD41− LR-HSCs must generate CD41+ LR-HSCs as they divide. To precisely gauge CD41− contribution to the CD41+ LR-HSC pool over time, we modified our super exponential model of cell cycle extension to allow CD41− LR-HSCs to gain CD41 expression with a fixed probability each time they divide. This model accurately fits the data for both CD41− and CD41+ LR-HSC expansion in aging mice, and estimates that in order for the CD41+ LR-HSC pool to expand, approximately 1 in 10 division events within the CD41− LR-HSC pool must give rise to a CD41+ LR-HSC (Figure 5E). This shows that in the context of homeostatic hematopoiesis, CD41− LR-HSCs reside at the apex of the hematopoietic hierarchy, generating the expanded CD41+ LR-HSC population found with age.
Discussion
Cells take in and store information about previous events that influence their subsequent behavior. In Drosophila and Aplysia, activated synapses of neurons convert CPEB to a self-propagating state allowing specific synapses to “remember” their previous activation to facilitate long-term memory storage (Majumdar et al., 2012; Si et al., 2003a; Si et al., 2003b). B cells undergo permanent somatic hypermutation after stimulation by foreign antigens to produce antibodies with increased affinity to antigen (MacLennan and Gray, 1986). The differentiation of cells during development from a pluripotent to a committed state is generally considered an irreversible process that is epigenetically recorded to prevent aberrant expression of alternative cell type-specific genes (Ang et al., 2011; Efroni et al., 2008). Cell division “counting” might also be an important manifestation of cellular memory. Such a mechanism has been proposed to account for the loss of function and senescence of cells with age, where cells “count” cell divisions via telomere length (Harley et al., 1990). While cells may be storing information about their cumulative divisional history, technical challenges associated with accurately documenting large numbers of cell divisions in vivo have largely precluded observations of these phenomena. Here we used H2BGFP label dilution to track HSC cell divisions accrued through the process of aging, and investigate their impact on regenerative potential.
Divisional history and heterogeneity of the aging HSC compartment
Previous work using H2BGFP label-retention suggests that the fewer times HSCs cycle over time, the greater their transplantable regenerative potential (Foudi et al., 2009; Qiu et al., 2014; Wilson et al., 2008). We showed that label-retaining cells within the functionally heterogeneous LSK population could long term repopulate a mouse at a frequency of 1 in 2.9 cells (Qiu et al., 2014). Here, we used label-retention to dissect the heterogeneity of the aging HSC compartment. We find that clonal sLR-HSCs function exclusively with IT- or LT-HSC potential. On the other hand, the proliferative non-LR-HSCs contain a diverse class of progenitors with reduced self-renewal and differentiation potential. This non-LR-HSC population, being the product of accumulated divisional history, may be the source of myeloid-repopulating cells described in clonal transplantation experiments (Dykstra et al., 2011; Sudo et al., 2000; Yamamoto et al., 2013). The degree of functional heterogeneity we find within the aging non-LR-HSC population is consistent with evidence from young animals that cell surface marker combinations alone cannot select for functionally homogeneous populations when analyzed at the single-cell level (Paul et al., 2015; Perie et al., 2015; Yamamoto et al., 2013). Additionally, the reduced regenerative capacity of the proliferative non-LR-HSC population is also supported by studies indicating that increasing cell cycle often reduces HSC function (Bowie et al., 2006; Pietras et al., 2011). Taken together, the accumulation of divisional history and its inferred link to myeloid potential in the aging non-LR-HSC population may contribute to the development of mutations that lead to myelofibrosis in aging populations.
Of note, our sLR-HSCs do not repopulate with absolute efficiency. This could be explained by a number of defects that characterize aging HSC populations, including defects in cell cycle entry, replication stress, and repair of DNA damage accumulated from long-term quiescence (Beerman et al., 2014; Flach et al., 2014; Mohrin et al., 2010; Rossi et al., 2007). However, all repopulating sLR-HSCs repopulate with LT- or IT-HSC functional potential. Thus, we propose that label-retention is a powerful tool for discriminating cells with HSC potential from populations of functionally heterogeneous progenitors, especially in the context of an aged system. This could prove beneficial when studying defects of aging HSCs by eliminating confounding results that describe defects among the diverse HSPCs invariably contained within the HSC compartment.
Tracking HSC divisional history throughout adult life reveals HSCs document their cell divisions
The use of our label-retaining system enabled us to track and quantify single cell divisions over the lifespan of a mouse. We find that LT-HSCs are capable of executing four traceable divisions prior to the loss of LT-HSC potential. This can be visualized by the dilution of H2BGFP intensity over time. This experimentally supports the mathematical models of previous work on LR-HSCs predicting that LR-HSCs divide five times during the lifespan of a mouse (Wilson et al., 2008). In light of our data, this fifth cell division would result in a complete loss of LT-HSC potential and most likely the initiation of an irreversible decline of the hematopoietic system.
Our approach enabled us to make inferences about LR-HSC expansion and cell division patterns. We conclude that age-associated expansion can be reached only if 1) LR-HSCs exclusively undergo symmetric self-renewal divisions throughout life, and 2) they reach dormancy after completing the fourth traceable division. LR-HSCs divide asynchronously, but regardless of when a cell completes it’s fourth traceable division we can assume it enters a dormant state, since each cell found in young mice can be accounted for mathematically in aging mice. If dormancy were not achieved after this fourth division, LR-HSCs could not accumulate to the extent they do with age, indicating that HSCs count and maintain a record of their divisions. Our data also allowed us to conclude that the LR-HSC population, which contains all LT-HSC activity, cannot be contributing to homeostatic hematopoiesis. This suggests that the populations maintaining a continuous supply of blood at steady state and the populations that act as stem cells during transplantation are distinct. These findings are in agreement with recent work on homeostatic hematopoiesis (Busch et al., 2015; Sun et al., 2014), as well as on crypt cells in the gut (Buczacki et al., 2013). Our data suggest that single cell divisions of LR-HSCs impact cell cycle entry and in the case of the fifth traceable division a complete loss of LT-HSC activity results. Thus, not only are HSCs counting their divisions, but also single cell divisions can impact HSC behavior and regenerative potential.
A mechanism of cell division counting may underlie age-related changes to the HSC compartment
We used our system to infer information about the hierarchical relationship of CD41+ and CD41− HSCs, both in the context of regeneration and homeostasis. We initially thought that the expanded CD41+ HSC compartment in aging mice exclusively contained cells with myeloid-restricted regenerative potential. We found, in agreement with published data (Gekas and Graf, 2013), that some CD41+ cells exhibit LT-HSC regenerative potential at the clonal level. These CD41+ LT-HSCs were found exclusively within the sLR-HSC compartment. Analysis of BM regenerated from retrospectively identified LT-HSCs after transplantation revealed that on the clonal level, both CD41− and CD41+ HSCs had similar propensities to regenerate each other, suggesting that in the context of transplantation CD41 may not be an indicator of HSC hierarchical primitiveness. However, CD41 expression within the non-LR-HSC population did enrich for cells with myeloid-restricted regenerative potential, suggesting that CD41, and perhaps other cell surface markers, are greater predictors of cellular function once cells have left the label-retaining population. Interestingly, our label retention system also allowed us to make inferences about the hierarchical relationship of CD41 expressing cells within the LR-HSC. As GFP fluorescence intensity can only be lost over time in a cell division dependent manner, this enabled us to use the H2BGFP label-retaining system as a means to track the origin of expanding cell populations. Doing so showed that CD41− LR-HSCs must give rise to the expanded CD41+ sLR-HSC population in aging mice.
It is important to state that while much of our evidence on homeostatic hematopoiesis is supportive of recent studies (Busch et al., 2015; Sun et al., 2014), and is supported by our mathematical models, further experiments need to be performed to fully validate these conclusions, possibly using a dual label-retaining and lineage-tracing genetic system that identifies progeny of label-retaining populations over time (Buczacki et al., 2013). We cannot exclude the possibility that a small number of LR-HSCs undetectable by our experimental strategy divide beyond peak 4 to leave the LR-HSC compartment and eventually contribute to active hematopoiesis. However, if this were the case it must be a comparatively rare event. Nevertheless, viewed overall our findings permit us to suggest a model for the aging of the HSC compartment (Figure 6) in which the dormant label-retaining compartment that contains all LT-HSC activity decreases in frequency within the HSC compartment but actually expands over time. This partially explains the observation that aging HSCs show impaired function upon transplantation due to the diminished frequency of LR-HSCs within the stem cell compartment, while also revealing how LT-HSCs increase with aging via increased absolute number of LR-HSCs within the whole BM. This compartment symmetrically self-renews over time precluding contribution to homeostatic hematopoiesis. The non-LR-HSC compartment also expands over time, but to a greater extent, and contains cells with limited self-renewal and differentiation capacity upon transplantation. These cells are likely to support homeostatic hematopoiesis. With aging, the non-LR-HSC compartment becomes dominated by CD41 expressing cells enriched for myeloid-restricted repopulation potential, and partially accounts for the increased propensity of the compartment as a whole to produce greater myeloid cell output with age.
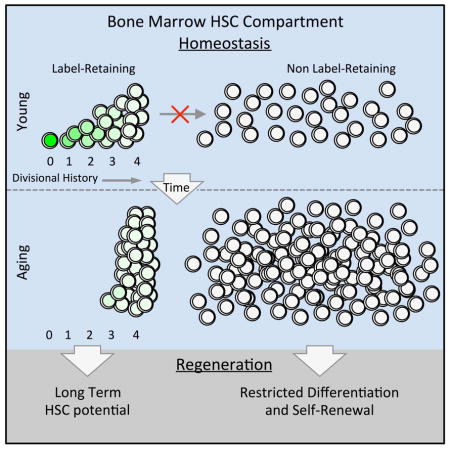
Figure 6. Self-Renewal Counting Model of Hematopoietic Stem Cell Aging.

The HSC pool can be segregated into two populations based on label-retention. The LR-HSC pool contains all of the transplantable LT-HSC activity, while the non-LR-HSC pool is comprised of cells with minimal self-renewal and restricted regenerative capacity. With aging, both the LR- and non-LR-HSC pools expand. The LR-HSC pool asynchronously undergoes four traceable symmetric self-renewal events, increasing the functional stem cell pool size over time while simultaneously diluting the GFP label with each cell division. After a fourth traceable self-renewal event, LR-HSCs enter a state of dormancy—as a fifth cell division would result in complete loss of LT-HSC potential—indicating that the LR-HSC population counts their cell divisions throughout life. The fact that the LR-HSC pool exclusively undergoes symmetric cell divisions before entering a stably dormant state means that they contribute minimally, if at all, to homeostatic hematopoiesis, unless activated to divide again by stress. The non-LR-HSC pool represents the vast majority of the stem cell pool in aging mice. Within the non-LR-HSC pool CD41+ cells enriched for myeloid progenitor activity accumulate with time and dominate the aging HSC compartment. It is most likely that the non-LR-HSC pool maintains active hematopoiesis during steady state conditions. In the context of regeneration, we identified 5 types of stem and progenitor cells with regenerative potential after transplantation within the total HSC compartment. When analyzed as a total HSC population, the predominance of myeloid progenitors and cells with limited self-renewal potential contributes to increased myeloid representation in regenerated peripheral blood and reduced long-term engraftment.
It remains uncertain whether the non-LR-HSC compartment is directly derived from the LR-HSC compartment as a function of continuously accumulated proliferative history. As the aging non-LR-HSC compartment shows attenuated repopulation potential and increased myeloid cell output, it would be consistent with recent studies indicating that increased divisional history recapitulates these hallmarks of aged HSCs (Beerman et al., 2013; Walter et al., 2015). However, it is not yet clear if the aging LR- and non-LR-HSC compartments differ in other described phenotypes of aged HSCs including the surrogate DNA damage marker γH2AX foci or cdc42 localization.
It will be interesting to investigate the underlying molecular mechanisms responsible for this cellular memory. Several studies have tracked cell division numbers in Bacillus subtillis sporulation, Drosophila spermatogenesis, and oligodendrocyte precursor differentiation. These studies reveal that after several rounds of division a genetic factor accumulates, reaching a threshold to initiate a cell fate change (Dugas et al., 2007; Insco et al., 2009; Levine et al., 2012). Alternatively, one could imagine dilution of a factor wherein progressive loss of this factor extends cell cycle progression leading to dormancy during homeostatic aging. Further studies are necessary to reveal this mechanism. Within it may lay the key to understanding the maintenance of self-renewal so long lacking in the field.
STAR Methods
Contact for Reagent and Resource Sharing
Information and requests for reagents may be directed to the lead contact Kateri Moore (kateri.moore@mssm.edu).
Experimental Model and Subject Details
Tg(tetO-HIST1H2BJ/GFP)47Efu/J (TetO-H2BGFP), hCD34-tTA (CD34), C57BL/6 (B6), and the congenic B6.SJL-Ptprca Pepcb/BoyJ (SJL) mice were acquired and maintained as previously described (Qiu et al., 2014). Double transgenic mice 34/H2BGFP mice were derived from crossbreeding the single transgenic TetO-H2BGFP and CD34 mice. F1 mice from this cross were used for all experiments, with the exception of cell cycle analysis in Figure S2I and S2J, which was performed on B6 BM. The F1 progeny of crosses from TetO-H2BGFP and B6 mice were used for background GFP gating controls in all label-dilution experiments. Dox was administered through the drinking water at 1 mg/ml to mice beginning between 2–4 months of age and changed twice weekly. Both male and female mice were used in all experiments. Sample sizes for experiments were determined without formal power calculations. Animal experiments were approved by the Institutional Animal Care and Use Committee and conducted in accordance with the Animal Welfare Act.
Method Details
Sample Preparation and Flow Cytometry
BM cells were harvested from tibias, femurs, and pelvic bones by crushing with a mortar and pestle in a PBS buffer supplemented with 5% new born calf serum (NCS, GIBCO). Cells were triturated to obtain a single cell suspension, and bone debris was removed by filtering through a 70μm cell strainer (BD). Red cells were lysed with an ammonium chloride lysis buffer. For staining, cells were first incubated with biotin-conjugated lineage markers anti-CD3ε, anti-B220, anti-Gr-1, anti-CD11b, and anti-Ter119, and on occasion also with biotin-conjugated anti-CD48 and anti-Flk2, followed by anti-biotin superparamagnetic beads (Dynabeads® Biotin Binder, Life technologies), and lineage marker expressing cells were depleted via magnetic separation. The fraction enriched for Lineage−/low cells was further incubated with antibodies against CD150, CD48, c-Kit, Sca1, CD41, Flk2, IL-7Rα, CD34, FcγRIII, and fluorophore-conjugated streptavidin. Dead cells were excluded by staining with 4’, 6-diamidino-2-phenylindole (DAPI, Sigma), or propidium iodide (PI, Sigma). Cells were analyzed on an LSRII (Becton Dickenson) flow cytometer and sorted on an Influx (Becton Dickenson). The various stem and progenitor populations were defined as follows: HSCs (Lin−Sca-1+c-Kit+CD48−Flk2−CD150+ or Lin−Sca-1+c-Kit+CD48−CD150+), MPPs (Lin−Sca-1+c-Kit+CD48−CD150−), HPC-1 (Lin−Sca-1+c-Kit+CD48+CD150−), HPC-2 (Lin−Sca-1+c-Kit+CD48+CD150+), MkPs (Lin−Sca-1−c-Kit+CD150+CD41+), CMPs (Lin−Sca-1−c-Kit+CD34+FcγRIII−), GMPs (Lin−Sca-1−c-Kit+CD34+FcγRIII+) , MEPs (Lin−Sca-1−c-Kit+CD34−FcγRIII−), CLPs (Lin−Sca-1midc-KitmidFlk2+IL7Rα+). Label retention was defined by gating above the background GFP levels found in heterozygous single transgenic TetO-H2BGFP HSCs. Antibodies are listed in Table S3.
Transplantation Assays
HSCs were sorted from 34/H2B mice (CD45.2) that were 19 months of age, and had been chased with dox for 15 or 17 months into various populations based on label retention. Sorted cells from each population were injected retro-orbitally into lethally irradiated SJL (CD45.1) mice (2 rounds of 550 rads, three hours apart) at a dosage of 200 sorted cells plus 1.3x10⁵ cells of Lin/CD48/Flk2-depleted competitor BM (CD45.1) per mouse. Mice were bled at timed intervals post transplantations from the retro-orbital venous plexus, red blood cells were lysed, and the contribution of donor derived CD45.2+ cells were assessed for contribution to the B cell (B220+), T cell (CD4/CD8+), and Myeloid (CD11b/Gr1+) lineages. Granulocytes were identified as SSCHiCD11b/Gr1+ cells. Secondary transplants were performed at 24 weeks post primary transplant and 5x10⁶ cells of pooled whole BM from each group were transplanted into secondary hosts.
Limiting dilution transplantations were performed by transplanting 15 sorted HSCs from 19-month old mice chased with dox for 17 months along with 2x10⁵ cells of congenic un-manipulated competitor bone (CD45.1) into lethally irradiated young SJL mice. Secondary transplants were performed 24 weeks post primary transplantation by transplanting 5x10⁶ cells of whole BM from a single primary recipient mouse into two new hosts (CD45.1).
Limiting Dilution Analysis
Limiting dilution analysis was performed with peripheral blood reconstitution data at 24 weeks after primary transplant using the freely available ELDA software (http://bioinf.wehi.edu.au/software/elda/).
Cell Cycle Analysis
Cells were stained and prepared as above, then fixed in 2% methanol-free paraformaldehyde diluted in PBS. Cells were then washed three times with PBS containing 5% NCS, permeabilized in 0.2% Triton-X 100, then stained with anti-Ki-67 (PE, eBioscience), and DAPI prior to analysis. For cell cycle analysis of GFP peak cells, LSKCD48−Flk2−CD150+ cells were first enrichment sorted prior to fixation, subsequent staining, and cell cycle analysis.
In vitro Analysis of Megakaryocyte Potential
Single LSKCD48−Flk2−CD150+ cells were sorted into U-shaped 96-well plates in 200ml StemSpan SFEM (StemCell Technologies) supplemented with 10% FBS (HyClone), 1% β-mercaptoethanol (0.1 mM, Sigma-Aldrich), 1% penicillin/streptomycin (Gibco) and cytokines mIL-3 (20 ng/ml, R&D Systems), mSCF (50 ng/ml, R&D Systems) and hTpo (50 ng/ml, R&D Systems). Colony morphology and size were evaluated on day 13. Colonies were collected for cytospin preparation and hematoxylin and eosin staining to determine the presence of megakaryocytes and other myeloid cells.
Hamming Distance Analysis
The Hamming distance was measured for pairs of leukocyte repopulation kinetics from secondary recipient mice as described (Müller-Sieburg et al., 2002). Thereby, the numerical kinetics of total peripheral blood white blood cell chimerism from paired secondary recipients were first transformed into symbolic dynamics based on the slopes of consecutive pairs of donor-type cell values over time as described. Symbolic dynamics are defined as sequences of symbols from the sign of the slope (“+” = positive slope, “−” = negative slope, “~” = close to zero slope). Next, the Hamming distances of all pairs of symbolic dynamics were determined. Pairs of secondary transplant kinetics were defined as synchronous if their Hamming distance was below an empirically set threshold (the smallest possible Hamming distance = 0 indicated that the two kinetics were identical based on this clustering measure). All pairs of kinetics with Hamming distances above the threshold were considered asynchronous.
Mathematical Modeling
Assuming that GFP dilutes by a factor of 2 with each cell division, the relative positions of the GFP peaks in the LR-HSC population are described by the following model:
where yn is the mean fluorescence intensity at the nth peak and c is a constant that accounts for background fluorescence. The MFI of GFP levels in HSCs of single transgenic TetO-H2BGFP mice was used to estimate c.
Expansion of LR-HSC numbers during aging was described by the following model:
where xn(t) is the expected number of cells per long bone that have divided n (=0, 1, 2, 3, 4) times since dox chase, and ln(2)/kn is the expected length of time to the next division for a cell that has previously divided n times. The above system is linear and may therefore be directly integrated and easily compared with experimental data. To determine how divisional history affects cell cycle time we fit the following functional forms for kn to experimental data using least squares fitting.
Let kn = k for all n. In this model, cells cycle on average at the same rate regardless of how many times they have divided previously. In this case there is one free parameter = ln(2)/τ, where τ is the expected cell cycle time.
Let kn = k for all n < 4 and k4 = 0. In the first model xn → 0 as t → ∞ for all n (i.e. GFP ultimately dilutes away in all cells). However, in this modification xn → 0 as t → ∞ for n < 4 and x4 → 16x0(0) + 8x1(0) + 4x2(0) + 2x3(0) + x4(0), where xn(0) is the initial number of cells in state n. This model assumes the cells proliferate normally until they have undergone four divisions, at which point they adopt a permanently quiescent state.
Let kn = k0 + nβ for all n. In this model the cell cycle time grows linearly with divisional history: each cell cycle is, on average, β hours longer than the last.
Let kn = kβn, with β < 1 for all n. In this model the expected cell cycle time grows exponentially with divisional history: each cell cycle is, on average, 1/β times longer than the last.
Let k0 = k and kn = kβ2n, with β < 1 for all n > 0. In this model the expected cell cycle time grows super-exponentially as the cells divide: the (n + 1)th cell cycle is, on average, 1/β2n times longer than the nth.
To account for the gain of CD41 expression in the LR-HSC fraction during aging, we assume that CD41 negative LR-HSCs gain CD41 expression with probability 1 − α each time they divide. The dynamics of CD41 expression within the label-retaining fraction are then described by the following model:
where xn(t) and yn(t) are the expected number of CD41− and CD41+ LR-HSCs cells per long bone that have divided n ( = 0, 1, 2, 3, 4) times since dox chase. To minimize the number of free parameters we assumed that CD41 status does not alter cell cycle progression and use model 5, above, to account for the onset of cellular quiescence. In this case the full model has three free parameters (k, β, and α)
Quantification and Statistical Analyses
Data is presented as mean ± SEM. The sample size for each experiment and the replicate number of experiments are included in the figure legends. Statistical significance was determined by Welch’s t test, Paired t test, or One-Way ANOVA followed by test for linear trend using GraphPad Prism 6 (GraphPad Software, La Jolla, CA). P-values <0.05 were considered significant. P values for each experiment are included in associated figure legends.
KEY RESOURCES TABLE
| REAGENT or RESOURCE | SOURCE | IDENTIFIER |
|---|---|---|
| Antibodies | ||
| Anti-Human/Mouse B220 biotin (clone RA3-6B2) | eBioscience | Cat# 13-0452 |
| Anti-Mouse c-Kit PE (clone 2B8) | eBioscience | Cat# 12-1178 |
| Anti-Mouse CD11b biotin (clone M1/70) | eBioscience | Cat# 13-0112 |
| Anti-Mouse CD34 Alexafluor700 (clone RAM34) | eBioscience | Cat# 56-0341 |
| Anti-Mouse CD3ε biotin (clone 17A2) | eBioscience | Cat# 13-0031 |
| Anti-Mouse CD4 PE/Cy5 (clone GK1.5) | eBioscience | Cat# 15-0041 |
| Anti-Mouse CD41 APC (clone eBioMWReg31) | eBioscience | Cat# 17-0411 |
| Anti-Mouse CD8a PE/Cy5 (clone 53-6.7) | eBioscience | Cat# 17-0081 |
| Anti-Mouse FcγRIII PE/Cy7 (clone 93) | eBioscience | Cat# 25-0161 |
| Anti-Mouse Flk2 biotin (clone A2F10) | eBioscience | Cat# 13-1351 |
| Anti-Mouse Flk2 PE (clone A2F10) | eBioscience | Cat# 12-1351 |
| Anti-Mouse Gr1 biotin (clone RB6-8C5) | eBioscience | Cat# 13-5931 |
| Anti-Mouse IL-7Rα PE/Cy7 (clone A7R34) | eBioscience | Cat# 25-1271 |
| Anti-Mouse Ter-119 biotin (clone TER-119) | eBioscience | Cat# 13-5921 |
| Anti-Mouse/Rat Ki67 PE (clone SolA15) | eBioscience | Cat# 12-5698 |
| Streptavidin eFluor450 | eBioscience | Cat# 48-4317 |
| Streptavidin PE/Cy5 | eBioscience | Cat# 15-4317 |
| Anti-Mouse/Human B220 PE/Cy7 (clone RA3-6B2) | Biolegend | Cat# 103221 |
| Anti-Mouse c-Kit APC (clone 2B8) | Biolegend | Cat# 10-5812 |
| Anti-Mouse c-Kit FITC (clone 2B8) | Biolegend | Cat# 10-5806 |
| Anti-Mouse c-Kit PerCP/Cy5.5 (clone 2B8) | Biolegend | Cat# 10-5823 |
| Anti-Mouse CD11b APC/Cy7 (clone M1/70) | Biolegend | Cat# 101226 |
| Anti-Mouse CD150 PE/Cy7 (clone TC15-12F12.2) | Biolegend | Cat# 115914 |
| Anti-Mouse CD45.2 Alexafluor700 (clone 104) | Biolegend | Cat# 109821 |
| Anti-Mouse CD45.2 PE (clone 104) | Biolegend | Cat# 109808 |
| Anti-Mouse CD48 biotin (clone HM48-1) | Biolegend | Cat# 103410 |
| Anti-Mouse CD48 PerCP/Cy5.5 (clone HM48-1) | Biolegend | Cat# 103422 |
| Anti-Mouse Gr1 APC/Cy7 (clone RB6-8C5) | Biolegend | Cat# 108423 |
| Anti-Mouse Sca-1 APC/Cy7 (clone D7) | Biolegend | Cat# 108126 |
| Anti-Mouse Sca-1 PacificBlue (clone D7) | Biolegend | Cat# 108120 |
| Streptavidin APC/Cy7 | Biolegend | Cat# 405208 |
| Chemicals, Peptides, and Recombinant Proteins | ||
| 4',6-Diamidino-2-Phenylindole, Dihydrochloride (DAPI) | Sigma | Cat# D9542 |
| Propidium Iodide (PI) | Sigma | Cat# P4170 |
| Doxycycline hycalate (Dox) | Sigma | Cat# D9891 |
| 16% Formaldehyde Soultion (w/v), Methanol-free | Thermo Scientific | Cat# 28906 |
| Dynabeads Biotin Binder | Life Technologies | Cat# 11047 |
| Recombinant Human TPO | R&D Systems | Cat# 288-TP |
| Recombinant Mouse SCF | R&D Systems | Cat# 455-MC |
| Recombinant Mouse IL-3 | R&D Systems | Cat# 403-ML |
| StemSpan SFEM | Stemcell Technologies | Cat# 09650 |
| Fetal Bovine Serum | HyClone | Cat# SH30070 |
| Newborn Calf Serum | Gibco | Cat# 16010519 |
| Experimental Models: Organisms/Strains | ||
| Mouse: C57BL/6J | The Jackson Laboratory | Stock No: 000664 |
| Mouse: B6.SJL-Ptprca Pepcb/BoyJ | The Jackson Laboratory | Stock No: 002014 |
| Mouse: Tg(tetO-HIST1H2BJ/GFP)47Efu/J | The Jackson Laboratory | Stock No: 005104 |
| Mouse: HuCD34-tTA | Radomska, H.S., Gonzalez, D.A., Okuno, Y., Iwasaki, H., Nagy, A., Akashi, K., Tenen, D.G., and Huettner, C.S. (2002). Transgenic targeting with regulatory elements of the human CD34 gene. Blood 100, 4410–4419. | N/A |
| Software and Algorithms | ||
| ELDA: Extreme Limiting Dilution Analysis | Hu, Y, and Smyth, GK(2009). ELDA: Extreme limiting dilution analysis for comparing depleted and enriched populations in stem cell and other assays. Journal of Immunological Methods 347, 70–78. | http://bioinf.wehi.edu.au/software/elda/ |
Supplementary Material
(A) Dynamic range of the H2BGFP reporter system in the absence of dox chase. Vertical lines indicate one-half dilutions in fluorescence intensity of the H2BGFP label, indicating a range of 7–8 H2BGFP dilutions prior to reaching background level. (B) Schematic for examining H2BGFP loss over time in 34/H2B animals without dox treatment. (C) Histograms depicting H2BGFP level in the LSKCD48−CD150+ BM HSC compartment from mice of various ages that have never been exposed to dox. The upper and lower range of GFPHi HSC frequency is displayed for each age group. (D) Quantification of GFPHi HSC frequency from mice of various age groups never exposed to dox (n=3–12 mice per group). Data are represented as mean ± SEM. Statistical significance was assessed by one-way ANOVA followed by test for linear trend; **p<0.01. (E) Schematic for testing active H2BGFP labeling of the HSC compartment after dox release. Single transgenic hCD34 and H2BGFP mice were mated together to produce double transgenic 34/H2B mice that were born on dox. Progeny were raised on dox until 8 weeks (56 days) of age, at which point dox was removed. BM was then collected at various time points after dox removal, and LSKCD48−CD150+ cells were analyzed for the presence of H2BGFP above background levels. (F) Time course kinetics of H2BGFP labeling after dox release. Data are represented as mean ± SEM (n=3–5 mice per group from two independent experiments)
(A) Experimental setup. Single transgenic hCD34-tTA and TetO-H2BGFP mice were mated while exposed to dox through the drinking water. Pups born from these matings were maintained on dox until adulthood, at which point BM was analyzed for the presence of H2BGFP expression above background levels. (B) Histogram showing GFP levels of LSKCD48−CD150+ cells from BM of 34/H2BGFP mice born on dox. (C) Modified experimental timeline. Mice born on dox were analyzed after a year of continuous dox treatment. (D) Histograms of GFP levels from three 34/H2BGFP mice born and maintained on dox for 1 year, and three single transgenic H2B mice (background). (E) Quantification of the brightest GFP intensity from each mouse displayed in (D).
(A–B) Frequency (A) and absolute number (B) of HSCs in young and aging bone marrow. n=10–17 mice per group. (C–D) Frequencies (C) and absolute numbers (D) of various HSPC populations (I–III) in young and aging bone marrow. n=6–7 mice per group. (E–F) Frequency (E) and absolute number (F) of CD41+ HSCs in young and aging bone marrow. n=6–10 mice per group. (G–H) Frequencies (G) and absolute number (H) of HSC populations characterized based on CD41 expression and label retention in young and aging bone marrow. n=6–10 mice per group from 2–3 independent experiments. (I–J) Representative images (I) and quantification (J) of CD41− and CD41+ HSC snapshot cell cycle profiles. n=6 mice per group from two independent experiments. (K) Histograms displaying the H2BGFP label retention over time of CD41− and CD41+ HSCs. Histograms are representations of young mice chased with dox for 12 weeks. (L) Quantification of H2BGFP label retention in (K). n=9–11 mice per group from three independent experiments. Data are represented as mean ± SEM. *P<0.05, **P<0.01, ***P<0.001 by Welch’s t test (quantifications), or paired Student t test (cell cycle).
Single cells from the GFPHi, GFPLo, and Total HSC populations were sorted from young (5 months old, dox treated 3 months) and aging (11 months old, dox treated 9 months) mice into wells of a 96 well plate and were cultured in the presence of SCF, IL-3, and Tpo. (A–D) Images of representative colonies after 13 days in culture. Mixed cell colonies containing both small and large cells (A and B), small cell only colonies (C), and large cell only colonies (D). Yellow arrows mark large megakaryocyte-like cells. (E–F) Representative images of cytospun mixed (E) and small cell only colonies (F) stained with H&E. Only mixed colonies showed megakaryocytes with large multi-lobed nuclei (black arrows). Large cell only colonies generated too few cells to be mounted on slides for staining. (G) Quantification of colony types found from each sorted HSC population. (H) Quantification of colony size at day 13 generated from each sorted HSC population. Data are represented as mean ± SEM of 64–130 single cells per group from 4 independent experiments.
Bone marrow from each mouse repopulated with 15 cells from aging HSC populations was transplanted into paired secondary hosts. Repopulation kinetics were followed in both secondary recipients over 24 weeks to determine the degree of synchronicity of total white blood cell repopulation (%CD45.2+) in independent hosts. We quantitatively defined the degree of synchronicity as the Hamming distance between pairs of time series. (A) Repopulation curves grouped into 2 clusters based on the degree of synchronicity. The cluster boxed in grey contains curves with kinetics determined to be synchronous, while the cluster boxed in red contains asynchronous kinetics for paired secondary hosts. The letter on the right side of each repopulation kinetic indicates the retrospectively identified repopulating cell type. L, LT-HSC; I, IT-HSC; S, ST-HSC, B, Bipotent Progenitor, M, Myeloid Progenitor. (B) Scaled paired secondary repopulation curves used to determine symbolic dynamics data from each secondary repopulation curve. The orange and blue curves represent individual secondary recipients. Shaded plots indicate asynchronous repopulation behavior. (C) Hamming distance measurements. Any two kinetics were defined to be asynchronous (red dots), if their Hamming distance was >2. One exception occurred where secondary repopulation was considered asynchronous with a Hamming distance of 2 due to a shorter symbolic dynamic sequence.
(A) Gating strategy for each HSC population. Cells were enrichment sorted on LSKCD48−Flk2−CD150+ cells, then fixed, stained for Ki67 and DAPI, then analyzed by flow cytometry for cell cycle state. Displayed are cells sorted from a young mouse. (B–C) Static cell cycle profile of Total, GFPHi, and Peak 0–4 cells from Young (5 months old, 3 months on dox; B) and Aging (11 months old, 9 months on dox; C) mice. Between 5000–15000 events in the Total HSC gate were acquired for each sample. n=3 and 2 for Young and Aging mice respectively.
Table S1 Related to Figure 1: Peripheral Blood Reconstitution by Aging HSCs.
Table S2 Related to Figure 4: Limiting Dilution Analysis.
Table S3 Related to Experimental Procedures: Antibody Panel.
Highlights.
A rare population of dormant LR-HSCs persists throughout adult life.
Only 1% of repopulating cells within the aging HSC compartment are LT-HSCs.
LR-HSCs divide symmetrically 4 times throughout adult life to accumulate with age.
HSCs count and retain a memory of their cell division events in vivo.
Acknowledgments
The authors wish to thank members of the Moore and Lemischka laboratories for advice and criticisms, I. Lemischka, R. Brosh, S. Ghaffari, C. Schaniel, and R. Krauss for critical reading of the manuscript, and B. Dykstra for thoughtful discussions of the work. We thank J. Qiu for placing mice on dox and maintaining them until JMB took over the experiments. We also thank J. Gregory for her artistic contributions, and the flow cytometry and animal facility shared resources at the ISMMS. K.M. was supported by NIH 2R01HL58739 and J.M.B was supported by T32HD075735. The authors wish to dedicate this manuscript to the memory of Dr. Christa Müller-Sieburg a dear friend, mentor and colleague.
Footnotes
Author Contributions:
J.M.B. conceived and performed experiments, acquired and analyzed data, and wrote the manuscript. B.M. and H.S. developed the models, analyzed data, and edited the manuscript. H.S.K performed experiments. K.A. conceived and performed experiments, edited the manuscript, and managed the project.
Publisher's Disclaimer: This is a PDF file of an unedited manuscript that has been accepted for publication. As a service to our customers we are providing this early version of the manuscript. The manuscript will undergo copyediting, typesetting, and review of the resulting proof before it is published in its final citable form. Please note that during the production process errors may be discovered which could affect the content, and all legal disclaimers that apply to the journal pertain.
References
- Ang YS, Gaspar-Maia A, Lemischka IR, Bernstein E. Stem cells and reprogramming: breaking the epigenetic barrier? Trends in pharmacological sciences. 2011;32:394–401. doi: 10.1016/j.tips.2011.03.002. [DOI] [PMC free article] [PubMed] [Google Scholar]
- Beerman I, Bhattacharya D, Zandi S, Sigvardsson M, Weissman IL, Bryder D, Rossi DJ. Functionally distinct hematopoietic stem cells modulate hematopoietic lineage potential during aging by a mechanism of clonal expansion. Proceedings of the National Academy of Sciences of the United States of America. 2010;107:5465–5470. doi: 10.1073/pnas.1000834107. [DOI] [PMC free article] [PubMed] [Google Scholar]
- Beerman I, Bock C, Garrison BS, Smith ZD, Gu H, Meissner A, Rossi DJ. Proliferation-dependent alterations of the DNA methylation landscape underlie hematopoietic stem cell aging. Cell stem cell. 2013;12:413–425. doi: 10.1016/j.stem.2013.01.017. [DOI] [PMC free article] [PubMed] [Google Scholar]
- Beerman I, Seita J, Inlay MA, Weissman IL, Rossi DJ. Quiescent hematopoietic stem cells accumulate DNA damage during aging that is repaired upon entry into cell cycle. Cell stem cell. 2014;15:37–50. doi: 10.1016/j.stem.2014.04.016. [DOI] [PMC free article] [PubMed] [Google Scholar]
- Benz C, Copley MR, Kent DG, Wohrer S, Cortes A, Aghaeepour N, Ma E, Mader H, Rowe K, Day C, et al. Hematopoietic stem cell subtypes expand differentially during development and display distinct lymphopoietic programs. Cell stem cell. 2012;10:273–283. doi: 10.1016/j.stem.2012.02.007. [DOI] [PubMed] [Google Scholar]
- Bowie MB, McKnight KD, Kent DG, McCaffrey L, Hoodless PA, Eaves CJ. Hematopoietic stem cells proliferate until after birth and show a reversible phase-specific engraftment defect. The Journal of clinical investigation. 2006;116:2808–2816. doi: 10.1172/JCI28310. [DOI] [PMC free article] [PubMed] [Google Scholar]
- Buczacki SJ, Zecchini HI, Nicholson AM, Russell R, Vermeulen L, Kemp R, Winton DJ. Intestinal label-retaining cells are secretory precursors expressing Lgr5. Nature. 2013;495:65–69. doi: 10.1038/nature11965. [DOI] [PubMed] [Google Scholar]
- Busch K, Klapproth K, Barile M, Flossdorf M, Holland-Letz T, Schlenner SM, Reth M, Hofer T, Rodewald HR. Fundamental properties of unperturbed haematopoiesis from stem cells in vivo. Nature. 2015;518:542–546. doi: 10.1038/nature14242. [DOI] [PubMed] [Google Scholar]
- Cho RH, Sieburg HB, Muller-Sieburg CE. A new mechanism for the aging of hematopoietic stem cells: aging changes the clonal composition of the stem cell compartment but not individual stem cells. Blood. 2008;111:5553–5561. doi: 10.1182/blood-2007-11-123547. [DOI] [PMC free article] [PubMed] [Google Scholar]
- Dugas JC, Ibrahim A, Barres BA. A crucial role for p57(Kip2) in the intracellular timer that controls oligodendrocyte differentiation. The Journal of neuroscience : the official journal of the Society for Neuroscience. 2007;27:6185–6196. doi: 10.1523/JNEUROSCI.0628-07.2007. [DOI] [PMC free article] [PubMed] [Google Scholar]
- Dykstra B, Olthof S, Schreuder J, Ritsema M, de Haan G. Clonal analysis reveals multiple functional defects of aged murine hematopoietic stem cells. The Journal of experimental medicine. 2011;208:2691–2703. doi: 10.1084/jem.20111490. [DOI] [PMC free article] [PubMed] [Google Scholar]
- Efroni S, Duttagupta R, Cheng J, Dehghani H, Hoeppner DJ, Dash C, Bazett-Jones DP, Le Grice S, McKay RD, Buetow KH, et al. Global transcription in pluripotent embryonic stem cells. Cell stem cell. 2008;2:437–447. doi: 10.1016/j.stem.2008.03.021. [DOI] [PMC free article] [PubMed] [Google Scholar]
- Essers MA, Offner S, Blanco-Bose WE, Waibler Z, Kalinke U, Duchosal MA, Trumpp A. IFNalpha activates dormant haematopoietic stem cells in vivo. Nature. 2009;458:904–908. doi: 10.1038/nature07815. [DOI] [PubMed] [Google Scholar]
- Flach J, Bakker ST, Mohrin M, Conroy PC, Pietras EM, Reynaud D, Alvarez S, Diolaiti ME, Ugarte F, Forsberg EC, et al. Replication stress is a potent driver of functional decline in ageing haematopoietic stem cells. Nature. 2014;512:198–202. doi: 10.1038/nature13619. [DOI] [PMC free article] [PubMed] [Google Scholar]
- Foudi A, Hochedlinger K, Van Buren D, Schindler JW, Jaenisch R, Carey V, Hock H. Analysis of histone 2B-GFP retention reveals slowly cycling hematopoietic stem cells. Nature biotechnology. 2009;27:84–90. doi: 10.1038/nbt.1517. [DOI] [PMC free article] [PubMed] [Google Scholar]
- Geiger H, de Haan G, Florian MC. The ageing haematopoietic stem cell compartment. Nature reviews Immunology. 2013;13:376–389. doi: 10.1038/nri3433. [DOI] [PubMed] [Google Scholar]
- Gekas C, Graf T. CD41 expression marks myeloid-biased adult hematopoietic stem cells and increases with age. Blood. 2013;121:4463–4472. doi: 10.1182/blood-2012-09-457929. [DOI] [PubMed] [Google Scholar]
- Haas S, Hansson J, Klimmeck D, Loeffler D, Velten L, Uckelmann H, Wurzer S, Prendergast AM, Schnell A, Hexel K, et al. Inflammation-Induced Emergency Megakaryopoiesis Driven by Hematopoietic Stem Cell-like Megakaryocyte Progenitors. Cell stem cell. 2015;17:422–434. doi: 10.1016/j.stem.2015.07.007. [DOI] [PubMed] [Google Scholar]
- Harley CB, Futcher AB, Greider CW. Telomeres shorten during ageing of human fibroblasts. Nature. 1990;345:458–460. doi: 10.1038/345458a0. [DOI] [PubMed] [Google Scholar]
- Insco ML, Leon A, Tam CH, McKearin DM, Fuller MT. Accumulation of a differentiation regulator specifies transit amplifying division number in an adult stem cell lineage. Proceedings of the National Academy of Sciences of the United States of America. 2009;106:22311–22316. doi: 10.1073/pnas.0912454106. [DOI] [PMC free article] [PubMed] [Google Scholar]
- Levine JH, Fontes ME, Dworkin J, Elowitz MB. Pulsed feedback defers cellular differentiation. PLoS biology. 2012;10:e1001252. doi: 10.1371/journal.pbio.1001252. [DOI] [PMC free article] [PubMed] [Google Scholar]
- MacLennan IC, Gray D. Antigen-driven selection of virgin and memory B cells. Immunological reviews. 1986;91:61–85. doi: 10.1111/j.1600-065x.1986.tb01484.x. [DOI] [PubMed] [Google Scholar]
- Majumdar A, Cesario WC, White-Grindley E, Jiang H, Ren F, Khan MR, Li L, Choi EM, Kannan K, Guo F, et al. Critical role of amyloid-like oligomers of Drosophila Orb2 in the persistence of memory. Cell. 2012;148:515–529. doi: 10.1016/j.cell.2012.01.004. [DOI] [PubMed] [Google Scholar]
- Mohrin M, Bourke E, Alexander D, Warr MR, Barry-Holson K, Le Beau MM, Morrison CG, Passegue E. Hematopoietic stem cell quiescence promotes error-prone DNA repair and mutagenesis. Cell stem cell. 2010;7:174–185. doi: 10.1016/j.stem.2010.06.014. [DOI] [PMC free article] [PubMed] [Google Scholar]
- Morrison SJ, Wandycz AM, Akashi K, Globerson A, Weissman IL. The aging of hematopoietic stem cells. Nature medicine. 1996;2:1011–1016. doi: 10.1038/nm0996-1011. [DOI] [PubMed] [Google Scholar]
- Muller-Sieburg CE, Cho RH, Karlsson L, Huang JF, Sieburg HB. Myeloid-biased hematopoietic stem cells have extensive self-renewal capacity but generate diminished lymphoid progeny with impaired IL-7 responsiveness. Blood. 2004;103:4111–4118. doi: 10.1182/blood-2003-10-3448. [DOI] [PubMed] [Google Scholar]
- Muller-Sieburg CE, Cho RH, Thoman M, Adkins B, Sieburg HB. Deterministic regulation of hematopoietic stem cell self-renewal and differentiation. Blood. 2002;100:1302–1309. [PubMed] [Google Scholar]
- Nakamura-Ishizu A, Takizawa H, Suda T. The analysis, roles and regulation of quiescence in hematopoietic stem cells. Development (Cambridge, England) 2014;141:4656–4666. doi: 10.1242/dev.106575. [DOI] [PubMed] [Google Scholar]
- Pang WW, Price EA, Sahoo D, Beerman I, Maloney WJ, Rossi DJ, Schrier SL, Weissman IL. Human bone marrow hematopoietic stem cells are increased in frequency and myeloid-biased with age. Proceedings of the National Academy of Sciences of the United States of America. 2011;108:20012–20017. doi: 10.1073/pnas.1116110108. [DOI] [PMC free article] [PubMed] [Google Scholar]
- Paul F, Arkin Y, Giladi A, Jaitin DA, Kenigsberg E, Keren-Shaul H, Winter D, Lara-Astiaso D, Gury M, Weiner A, et al. Transcriptional Heterogeneity and Lineage Commitment in Myeloid Progenitors. Cell. 2015;163:1663–1677. doi: 10.1016/j.cell.2015.11.013. [DOI] [PubMed] [Google Scholar]
- Perie L, Duffy KR, Kok L, de Boer RJ, Schumacher TN. The Branching Point in Erythro-Myeloid Differentiation. Cell. 2015;163:1655–1662. doi: 10.1016/j.cell.2015.11.059. [DOI] [PubMed] [Google Scholar]
- Pietras EM, Warr MR, Passegue E. Cell cycle regulation in hematopoietic stem cells. The Journal of cell biology. 2011;195:709–720. doi: 10.1083/jcb.201102131. [DOI] [PMC free article] [PubMed] [Google Scholar]
- Qiu J, Papatsenko D, Niu X, Schaniel C, Moore K. Divisional history and hematopoietic stem cell function during homeostasis. Stem cell reports. 2014;2:473–490. doi: 10.1016/j.stemcr.2014.01.016. [DOI] [PMC free article] [PubMed] [Google Scholar]
- Rossi DJ, Bryder D, Seita J, Nussenzweig A, Hoeijmakers J, Weissman IL. Deficiencies in DNA damage repair limit the function of haematopoietic stem cells with age. Nature. 2007;447:725–729. doi: 10.1038/nature05862. [DOI] [PubMed] [Google Scholar]
- Rossi DJ, Bryder D, Zahn JM, Ahlenius H, Sonu R, Wagers AJ, Weissman IL. Cell intrinsic alterations underlie hematopoietic stem cell aging. Proceedings of the National Academy of Sciences of the United States of America. 2005;102:9194–9199. doi: 10.1073/pnas.0503280102. [DOI] [PMC free article] [PubMed] [Google Scholar]
- Si K, Giustetto M, Etkin A, Hsu R, Janisiewicz AM, Miniaci MC, Kim JH, Zhu H, Kandel ER. A neuronal isoform of CPEB regulates local protein synthesis and stabilizes synapse-specific long-term facilitation in aplysia. Cell. 2003a;115:893–904. doi: 10.1016/s0092-8674(03)01021-3. [DOI] [PubMed] [Google Scholar]
- Si K, Lindquist S, Kandel ER. A neuronal isoform of the aplysia CPEB has prion-like properties. Cell. 2003b;115:879–891. doi: 10.1016/s0092-8674(03)01020-1. [DOI] [PubMed] [Google Scholar]
- Sieburg HB, Muller-Sieburg CE. Classification of short kinetics by shape. In silico biology. 2004;4:209–217. [PubMed] [Google Scholar]
- Sudo K, Ema H, Morita Y, Nakauchi H. Age-associated characteristics of murine hematopoietic stem cells. The Journal of experimental medicine. 2000;192:1273–1280. doi: 10.1084/jem.192.9.1273. [DOI] [PMC free article] [PubMed] [Google Scholar]
- Sun J, Ramos A, Chapman B, Johnnidis JB, Le L, Ho YJ, Klein A, Hofmann O, Camargo FD. Clonal dynamics of native haematopoiesis. Nature. 2014;514:322–327. doi: 10.1038/nature13824. [DOI] [PMC free article] [PubMed] [Google Scholar]
- van der Wath RC, Wilson A, Laurenti E, Trumpp A, Lio P. Estimating dormant and active hematopoietic stem cell kinetics through extensive modeling of bromodeoxyuridine label-retaining cell dynamics. PloS one. 2009;4:e6972. doi: 10.1371/journal.pone.0006972. [DOI] [PMC free article] [PubMed] [Google Scholar]
- Walter D, Lier A, Geiselhart A, Thalheimer FB, Huntscha S, Sobotta MC, Moehrle B, Brocks D, Bayindir I, Kaschutnig P, et al. Exit from dormancy provokes DNA-damage-induced attrition in haematopoietic stem cells. Nature. 2015;520:549–552. doi: 10.1038/nature14131. [DOI] [PubMed] [Google Scholar]
- Wilson A, Laurenti E, Oser G, van der Wath RC, Blanco-Bose W, Jaworski M, Offner S, Dunant CF, Eshkind L, Bockamp E, et al. Hematopoietic stem cells reversibly switch from dormancy to self-renewal during homeostasis and repair. Cell. 2008;135:1118–1129. doi: 10.1016/j.cell.2008.10.048. [DOI] [PubMed] [Google Scholar]
- Yamamoto R, Morita Y, Ooehara J, Hamanaka S, Onodera M, Rudolph KL, Ema H, Nakauchi H. Clonal analysis unveils self-renewing lineage-restricted progenitors generated directly from hematopoietic stem cells. Cell. 2013;154:1112–1126. doi: 10.1016/j.cell.2013.08.007. [DOI] [PubMed] [Google Scholar]
Associated Data
This section collects any data citations, data availability statements, or supplementary materials included in this article.
Supplementary Materials
(A) Dynamic range of the H2BGFP reporter system in the absence of dox chase. Vertical lines indicate one-half dilutions in fluorescence intensity of the H2BGFP label, indicating a range of 7–8 H2BGFP dilutions prior to reaching background level. (B) Schematic for examining H2BGFP loss over time in 34/H2B animals without dox treatment. (C) Histograms depicting H2BGFP level in the LSKCD48−CD150+ BM HSC compartment from mice of various ages that have never been exposed to dox. The upper and lower range of GFPHi HSC frequency is displayed for each age group. (D) Quantification of GFPHi HSC frequency from mice of various age groups never exposed to dox (n=3–12 mice per group). Data are represented as mean ± SEM. Statistical significance was assessed by one-way ANOVA followed by test for linear trend; **p<0.01. (E) Schematic for testing active H2BGFP labeling of the HSC compartment after dox release. Single transgenic hCD34 and H2BGFP mice were mated together to produce double transgenic 34/H2B mice that were born on dox. Progeny were raised on dox until 8 weeks (56 days) of age, at which point dox was removed. BM was then collected at various time points after dox removal, and LSKCD48−CD150+ cells were analyzed for the presence of H2BGFP above background levels. (F) Time course kinetics of H2BGFP labeling after dox release. Data are represented as mean ± SEM (n=3–5 mice per group from two independent experiments)
(A) Experimental setup. Single transgenic hCD34-tTA and TetO-H2BGFP mice were mated while exposed to dox through the drinking water. Pups born from these matings were maintained on dox until adulthood, at which point BM was analyzed for the presence of H2BGFP expression above background levels. (B) Histogram showing GFP levels of LSKCD48−CD150+ cells from BM of 34/H2BGFP mice born on dox. (C) Modified experimental timeline. Mice born on dox were analyzed after a year of continuous dox treatment. (D) Histograms of GFP levels from three 34/H2BGFP mice born and maintained on dox for 1 year, and three single transgenic H2B mice (background). (E) Quantification of the brightest GFP intensity from each mouse displayed in (D).
(A–B) Frequency (A) and absolute number (B) of HSCs in young and aging bone marrow. n=10–17 mice per group. (C–D) Frequencies (C) and absolute numbers (D) of various HSPC populations (I–III) in young and aging bone marrow. n=6–7 mice per group. (E–F) Frequency (E) and absolute number (F) of CD41+ HSCs in young and aging bone marrow. n=6–10 mice per group. (G–H) Frequencies (G) and absolute number (H) of HSC populations characterized based on CD41 expression and label retention in young and aging bone marrow. n=6–10 mice per group from 2–3 independent experiments. (I–J) Representative images (I) and quantification (J) of CD41− and CD41+ HSC snapshot cell cycle profiles. n=6 mice per group from two independent experiments. (K) Histograms displaying the H2BGFP label retention over time of CD41− and CD41+ HSCs. Histograms are representations of young mice chased with dox for 12 weeks. (L) Quantification of H2BGFP label retention in (K). n=9–11 mice per group from three independent experiments. Data are represented as mean ± SEM. *P<0.05, **P<0.01, ***P<0.001 by Welch’s t test (quantifications), or paired Student t test (cell cycle).
Single cells from the GFPHi, GFPLo, and Total HSC populations were sorted from young (5 months old, dox treated 3 months) and aging (11 months old, dox treated 9 months) mice into wells of a 96 well plate and were cultured in the presence of SCF, IL-3, and Tpo. (A–D) Images of representative colonies after 13 days in culture. Mixed cell colonies containing both small and large cells (A and B), small cell only colonies (C), and large cell only colonies (D). Yellow arrows mark large megakaryocyte-like cells. (E–F) Representative images of cytospun mixed (E) and small cell only colonies (F) stained with H&E. Only mixed colonies showed megakaryocytes with large multi-lobed nuclei (black arrows). Large cell only colonies generated too few cells to be mounted on slides for staining. (G) Quantification of colony types found from each sorted HSC population. (H) Quantification of colony size at day 13 generated from each sorted HSC population. Data are represented as mean ± SEM of 64–130 single cells per group from 4 independent experiments.
Bone marrow from each mouse repopulated with 15 cells from aging HSC populations was transplanted into paired secondary hosts. Repopulation kinetics were followed in both secondary recipients over 24 weeks to determine the degree of synchronicity of total white blood cell repopulation (%CD45.2+) in independent hosts. We quantitatively defined the degree of synchronicity as the Hamming distance between pairs of time series. (A) Repopulation curves grouped into 2 clusters based on the degree of synchronicity. The cluster boxed in grey contains curves with kinetics determined to be synchronous, while the cluster boxed in red contains asynchronous kinetics for paired secondary hosts. The letter on the right side of each repopulation kinetic indicates the retrospectively identified repopulating cell type. L, LT-HSC; I, IT-HSC; S, ST-HSC, B, Bipotent Progenitor, M, Myeloid Progenitor. (B) Scaled paired secondary repopulation curves used to determine symbolic dynamics data from each secondary repopulation curve. The orange and blue curves represent individual secondary recipients. Shaded plots indicate asynchronous repopulation behavior. (C) Hamming distance measurements. Any two kinetics were defined to be asynchronous (red dots), if their Hamming distance was >2. One exception occurred where secondary repopulation was considered asynchronous with a Hamming distance of 2 due to a shorter symbolic dynamic sequence.
(A) Gating strategy for each HSC population. Cells were enrichment sorted on LSKCD48−Flk2−CD150+ cells, then fixed, stained for Ki67 and DAPI, then analyzed by flow cytometry for cell cycle state. Displayed are cells sorted from a young mouse. (B–C) Static cell cycle profile of Total, GFPHi, and Peak 0–4 cells from Young (5 months old, 3 months on dox; B) and Aging (11 months old, 9 months on dox; C) mice. Between 5000–15000 events in the Total HSC gate were acquired for each sample. n=3 and 2 for Young and Aging mice respectively.
Table S1 Related to Figure 1: Peripheral Blood Reconstitution by Aging HSCs.
Table S2 Related to Figure 4: Limiting Dilution Analysis.
Table S3 Related to Experimental Procedures: Antibody Panel.