Abstract
Background
The use of quantitative CT analysis in children is limited by lack of normal values of lung parenchymal attenuation. These characteristics are important because normal lung development yields significant parenchymal attenuation changes as children age.
Objective
To perform quantitative characterization of normal pediatric lung parenchymal X-ray CT attenuation under routine clinical conditions in order to establish a baseline comparison to that seen in pathological lung conditions.
Materials and methods
We conducted a retrospective query of normal CT chest examinations in children ages 0–7 years from 2004 to 2014 using standard clinical protocol. During these examinations semi-automated lung parenchymal segmentation was performed to measure lung volume and mean lung attenuation.
Results
We analyzed 42 CT examinations in 39 children, ages 3 days to 83 months (mean ± standard deviation [SD] = 42±27 months). Lung volume ranged 0.10–1.72 liters (L). Mean lung attenuation was much higher in children younger than 12 months, with values as high as −380 Hounsfield units (HU) in neonates (lung volume 0.10 L). Lung volume decreased to approximately −650 HU by age 2 years (lung volume 0.47 L), with subsequently slower exponential decrease toward a relatively constant value of −860 HU as age and lung volume increased.
Conclusion
Normal lung parenchymal X-ray CT attenuation decreases with increasing lung volume and age; lung attenuation decreases rapidly in the first 2 years of age and more slowly thereafter. This change in normal lung attenuation should be taken into account as quantitative CT methods are translated to pediatric pulmonary imaging.
Keywords: Children, Computed tomography, Lung attenuation, Lungs, Normal
Introduction
CT imaging is an important tool in the management of lung disease. While clinical CT image interpretation is routinely performed qualitatively, emerging quantitative techniques have shown great potential in the evaluation of lung pathology and pathophysiology. Quantitative methods offer the advantage of objective, reproducible measurements that have been shown to correlate with pathological and clinical lung disease severity, thereby enabling longitudinal studies of disease pathogenesis and the effect of therapeutic intervention. Quantitative CT analysis methods have been employed in adult lung diseases to include chronic obstructive pulmonary disease (COPD) [1–6], lung cancer screening [7, 8], pulmonary fibrosis [9–14] and asthma [11, 15–18].
There are challenges in applying quantitative techniques used in adults to pediatric populations because children’s lungs continue to grow and expand in volume from infancy through young adulthood. Increases in lung volume occur by the formation of new alveoli and by expansion of the existing alveolar structure, both of which increase the available surface area for gas exchange [19]. The relative rates of these two processes throughout development are unclear; however evidence shows that classic bulk alveolarization slows in early postnatal life [20–23] and that this phase is followed by a phase of continued alveolarization at a slower rate through young adulthood [23–25]. Lung volume and lung tissue mass both increase dramatically throughout somatic growth and have been correlated most closely with body length in children and adults [25–29].
The literature describing the imaging characteristics of normal lung development has demonstrated the ability of CT to estimate lung mass, gas volume, and expansion [25, 30] by measuring lung volume and attenuation. Studies focusing on the description of lung parenchymal attenuation have concluded that lung attenuation declines with age [31–36]. Specifically, data from a study performed by Long et al. [36] imply that lung attenuation declines linearly in the first 2 years of age, and thereafter it approximates adult values, although accurate characterization of lung attenuation after approximately 3 years of age was limited by lack of sufficient data. Prior studies were performed with controlled CT technique; CT acquisitions were obtained at specific lung volumes during both inspiration (total lung capacity) and expiration (functional residual volume) in sedated children during a period of induced apnea [25, 36, 37]. While these prospective experimental studies provide accurate, reproducible measurements of lung attenuation, they are based on controlled CT acquisition techniques and consist of small numbers of children in limited age ranges. There may be difficulty in applying these data to clinical CT studies in which children of variable age and size display varying degrees of lung inspiration and motion artifact; pediatric institutional clinical practice includes various imaging techniques depending on the study indication, patient age and the child’s ability to comply with breath-hold maneuvers. The use of multiple CT scanners and software packages in clinical practice also introduces variation relative to controlled studies.
With improvements in the clinical management of prematurity and inherited lung disease, CT imaging plays an important role in the evaluation of pediatric lung diseases such as bronchopulmonary dysplasia [38], childhood interstitial lung disease, cystic fibrosis [39–44] and asthma [16, 18]. Furthermore the wider clinical accessibility of volumetric CT [6, 8] and newer lower-dose CT methods [45–48] that mitigate the risk of ionizing radiation exposure in pediatric patients [49–52] might allow for more rigorous quantitative studies of pediatric lung disease. However there are limited data quantifying the normal changes of CT lung characteristics in children as they grow [44, 53].
Quantification of normal pediatric lung parenchymal attenuation has not been performed in a cohort of normal children across a wide age range in a clinical setting. The purpose of this study is to perform precise quantitative characterization of normal pediatric lung parenchymal attenuation in children ages 0–7 years and to evaluate how lung attenuation changes with age. This insight is expected to become increasingly important as automated quantitative analysis techniques are translated to clinical imaging of pediatric lung disease [12, 54].
Materials and methods
Subjects
Our institutional review board approved this retrospective cohort study and waived informed consent. The study complies with the Health Insurance Portability and Accountability Act. Our institution’s database (Illuminate InSight; Softek Solutions, Monterrey, Mexico) was queried for non-contrast CT chest examinations using the search term “normal” in the report impression in children younger than 7 years from 2004 to 2014. A total of 190 studies were obtained from the initial search criteria. We included CT studies with normal findings, which were characterized by homogeneous lung hypoattenuation and standard bronchovascular anatomy. Additional inclusion criteria were studies with contiguous image data and lung reconstruction algorithms. Exclusion criteria were CT studies performed in children with a history of pulmonary disease or radiation therapy to lungs, or those CT studies with atelectasis greater than segmental in amount based on standard bronchopulmonary lung segmentation. Our final analysis included 42 CT studies. We also recorded subject gender, age and weight at the time of imaging, and study indication.
Imaging technique
CT studies were performed on one of the following scanners in supine position: Toshiba Aquilion ONE 320 (20 studies) or Toshiba Aquilion 64 (9 studies) (Toshiba Medical Systems, Otawara, Japan); or GE LightSpeed 16 (12 studies) or GE Discovery STE (1 study) (GE Medical Systems, Milwaukee, WI). All CT studies were performed with a helical or volume acquisition, yielding contiguous image data to facilitate volumetric lung measurement. Slice thickness ranged 3–5 mm. Field of view ranged 14–26 cm. Beam current ranged 14–150 mA and tube potential ranged 80–120 kV. CT dose index (CTDI) ranged 0.37–8.4 mGy; dose reports were not available for 10 studies. Lung algorithm kernels were used to reconstruct the CT images.
Breathing technique was chosen according to routine clinical practice based on the child’s age and indication for the study. In general at our institution, young infants are bundled and free breathing, and other children are imaged at suspended inspiration with or without general anesthesia, depending on the child’s ability to cooperate. Non-sedated older children (usually 6 years and older) are given consistent verbal instructions to take a full inspiration at the time of image acquisition; intubated, sedated children are imaged at 25-mm H2O inspiratory pressure. The precise description of CT breathing technique was not documented in the medical record.
Image segmentation
Lung parenchymal segmentation was performed on each CT study using a semi-automated technique with the commercial software package Amira (FEI Visualization Sciences Group, Hillsboro, OR) (Fig. 1). Two distinct parenchymal segmentations were performed: one included any sub-segmental atelectasis in order to determine lung volume, and the second segmentation excluded any sub-segmental atelectasis in order to determine mean parenchymal attenuation. Atelectasis was defined by the characteristic morphology of dependent, linear or wedge-shape parenchymal opacities. Segmental vessels or larger were excluded from both segmentations. An automated threshold segmentation tool was first used to select the lung parenchyma as determined by attenuation; a pediatric radiologist then performed manual modification of the segmentation to include all lung parenchyma and exclude all extra-parenchymal tissue based on anatomical morphology. Automated measurement of lung volume was obtained from the parenchymal segmentation that included atelectasis. Automated measurement of mean lung parenchymal attenuation was obtained from the segmentation that excluded atelectasis.
Fig. 1.
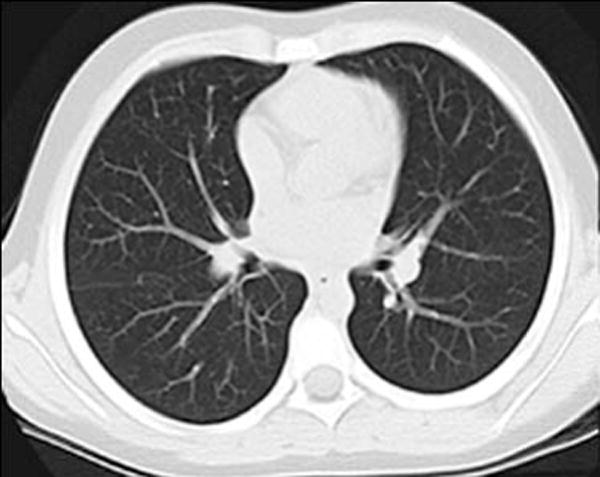
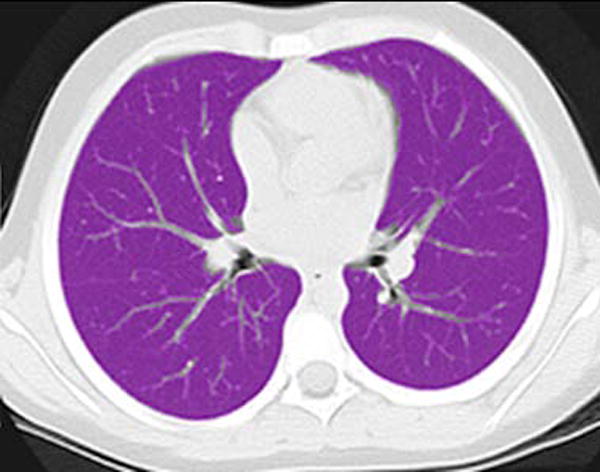
Lung segmentation technique. a Standard gray-scale non-contrast axial CT image through the mid-thorax in a 69-month-old girl. b Corresponding magenta-shaded mask highlights the segmented lung parenchyma
Image analysis
We compared lung volume (as calculated from the image segmentation including atelectasis) to age and fit the data to a linear regression. Mean lung attenuation was compared to lung volume (as opposed to age) in order to provide standardization for variability in patient size and age-based breathing technique during CT acquisition. Mean lung attenuation versus lung volume were fit to an exponential decay.
Lung mass was calculated using the mean lung attenuation and lung volume (including atelectasis) as measured by CT. Mean lung attenuation (HU) was converted to density (g/mL) using the relationship (1,000+HU)/1,000 = g/mL [55]. Multiplying the density (g/mL) by the volume (mL) yields the lung mass (g).
Gravitational dependence of parenchymal attenuation [55, 56] was quantified using the Java image-processing program ImageJ (National Institutes of Health, Bethesda, MD). A linear plot profile analysis was obtained along the anterior-posterior axis of the lung parenchyma; four measurements obtained in two slices per patient (superior at the level of the carina and inferior at the basilar segmental bronchi origins) were averaged to calculate the gravitational change in parenchymal attenuation (Fig. 2).
Fig. 2.
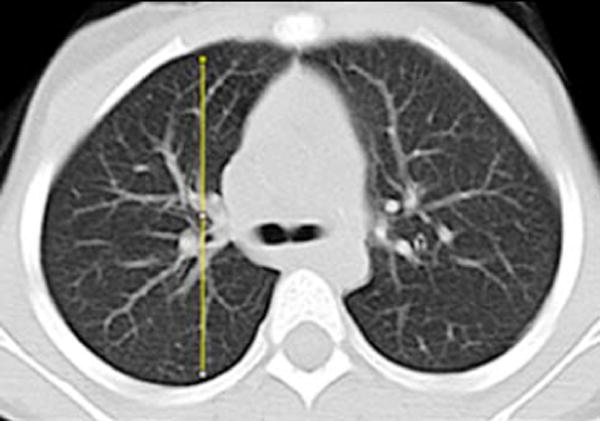
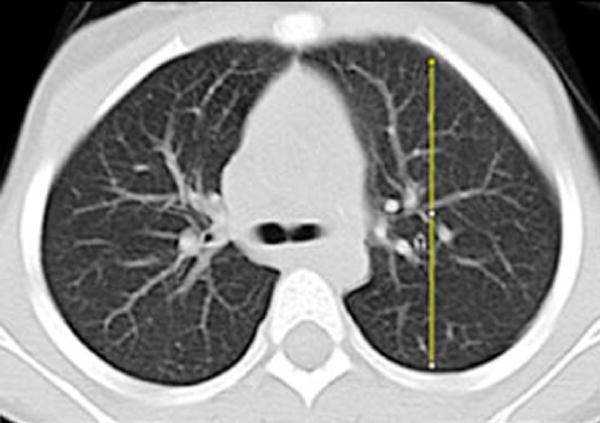
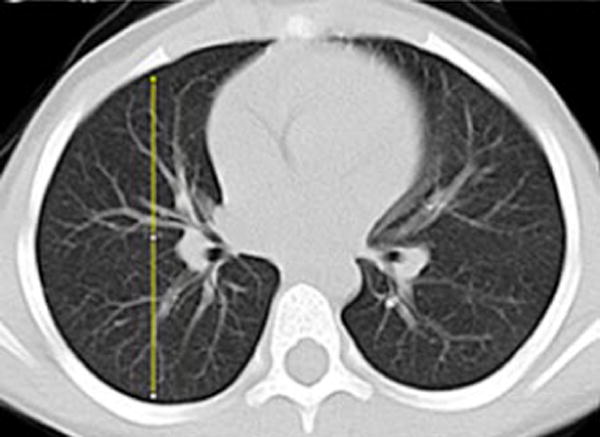
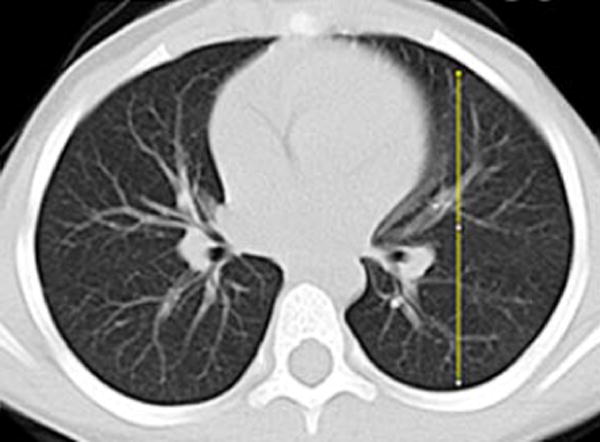
Image analysis of lung attenuation. Non-contrast axial CT images through the thorax in a 46-month-old boy demonstrate the method used to measure gravitational dependence of lung attenuation with ImageJ. Four linear plot profiles were obtained in each child, located in each upper lung at the level of the carina (a, b), and in each lower lung at the approximate level of the basilar segmental bronchi origins (c, d)
Results
Subjects
We studied 42 CT chest examinations in 39 children (23 girls, 16 boys) with mean age 42 months (SD ± 27 months) and age range 3 days to 83 months. Age distribution was as follows: 11 of the 42 (26%) CT examinations were performed in children 0–24 months, 9 (21%) in children 25–48 months, 17 (40%) in children 49–72 months and 5 (12%) in children 73–84 months. The most common (28/42; 67%) clinical indication for the CT examinations was to evaluate for thoracic metastatic disease in children with extrathoracic solid tumors. The remainder of the CT study indications were as follows: 2 studies in children with chronic sinusitis; 2 with a history of pneumonia (1 with right lower lobe opacity that had resolved by imaging 10 months prior, and 1 with left lower lobe opacity persistent on radiograph 1 month prior; both children had clear lungs on the included CT study); 3 with possible aspiration; 1 with acute lymphocytic leukemia and fever; 1 with vocal cord dysfunction; 1 with glottic papillomatosis; 1 with laryngomalacia; 1 with severe combined immunodeficiency for pre-bone marrow transplantation evaluation; 1 with complete tracheal rings, and 1 with a radiographic abnormality that was shown at CT to be a result of normal overlying vasculature. Three of the CT examinations were obtained in children born prior to 36 weeks’ gestational age; however none of these children had clinical or radiologic signs of pulmonary disease. Subject weight at the time of imaging was available in the electronic medical record for 33 of the 42 examinations (79%). Subject demographics and CT study clinical indications are summarized in Table 1.
Table 1.
Subject demographics
| Study | Age (months) | Patient weight (kg) | Gender | Lung volume* (L) | Study indication |
|---|---|---|---|---|---|
| 1 | 0.1 (3 d) | NA | F | 0.13 | Evaluate for metastatic disease |
| 2 | 0.5 (16 d) | NA | F | 0.10 | Pre-bone marrow transplant |
| 3 | 2 | 3.1 | M | 0.17 | Complete tracheal rings |
| 4 | 3 | NA | F | 0.17 | Evaluate for metastatic disease |
| 5 | 4 | 6.3 | F | 0.19 | Evaluate for metastatic disease |
| 6 | 4 | 5.6 | F | 0.18 | Evaluate for metastatic disease |
| 7 | 8 | NA | M | 0.25 | Evaluate for metastatic disease |
| 8 | 9 | 6.9 | M | 0.21 | Evaluate for metastatic disease |
| 9 | 12 | 7.5 | F | 0.41 | Laryngomalacia |
| 10 | 16 | 9.6 | M | 0.61 | Evaluate for metastatic disease |
| 11 | 21 | 12.0 | M | 0.59 | Evaluate for metastatic disease |
| 12 | 24 | 14.4 | M | 0.46 | Prior pulmonary infection |
| 13 | 24 | 11.6 | M | 0.77 | Laryngomalacia |
| 14 | 24 | 12.0 | F | 0.26 | Evaluate for metastatic disease |
| 15 | 25 | 11.9 | F | 0.73 | Resolved URI |
| 16 | 31 | NA | F | 0.38 | Evaluate for metastatic disease |
| 17 | 33 | 12.2 | F | 0.42 | Evaluate for metastatic disease |
| 18 | 34 | NA | F | 0.64 | Resolved pneumonia |
| 19 | 41 | 12.2 | F | 0.63 | Evaluate for metastatic disease |
| 20 | 46 | 17.0 | M | 0.91 | Evaluate for metastatic disease |
| 21 | 49 | 17.7 | F | 0.85 | Evaluate for metastatic disease |
| 22 | 49 | 20.4 | M | 0.75 | Chest radiograph abnormality |
| 23 | 49 | 18.0 | M | 1.01 | Glottic papillomatosis |
| 24 | 50 | 21.0 | M | 0.72 | Evaluate for metastatic disease |
| 25 | 51 | 13.0 | F | 0.53 | Evaluate for metastatic disease |
| 26 | 52 | 20.3 | F | 0.68 | Evaluate for metastatic disease |
| 27 | 58 | 20.8 | M | 1.12 | Resolved URI |
| 28 | 58 | 20.0 | F | 0.95 | Evaluate for metastatic disease |
| 29 | 64 | 16.8 | F | 0.94 | Evaluate for metastatic disease |
| 30 | 66 | 18.4 | M | 0.58 | Resolved URI |
| 31 | 66 | NA | F | 0.86 | Fever |
| 32 | 67 | 17.6 | M | 1.21 | Resolved URI |
| 33 | 67 | 23.1 | F | 0.65 | Evaluate for metastatic disease |
| 34 | 68 | 27.1 | M | 0.79 | Evaluate for metastatic disease |
| 35 | 69 | NA | F | 1.72 | Resolved pneumonia |
| 36 | 70 | 22.8 | F | 1.09 | Evaluate for metastatic disease |
| 37 | 71 | 24.9 | M | 0.85 | Evaluate for metastatic disease |
| 38 | 77 | 20.0 | F | 0.70 | Evaluate for metastatic disease |
| 39 | 78 | 22.6 | M | 1.60 | Evaluate for metastatic disease |
| 40 | 79 | 21.6 | M | 1.63 | Evaluate for metastatic disease |
| 41 | 82 | 21.6 | F | 1.22 | Evaluate for metastatic disease |
| 42 | 83 | 21.6 | M | 1.07 | Evaluate for metastatic disease |
Lung volume includes atelectasis as measured from CT images
d days, f female, m male, NA not available, URI upper respiratory infection
Lung characteristics
Lung volume ranged from 0.10 L (16-day-old) to 1.72 L (69-month-old subject). Lung volume increased with increasing age; the data were fit to a linear regression equation y = (1.27 × 10⁻²) x + 0.167 where y is the lung volume in liters (L) and x is the subject age in months (R2=0.69) (Fig. 3).
Fig. 3.
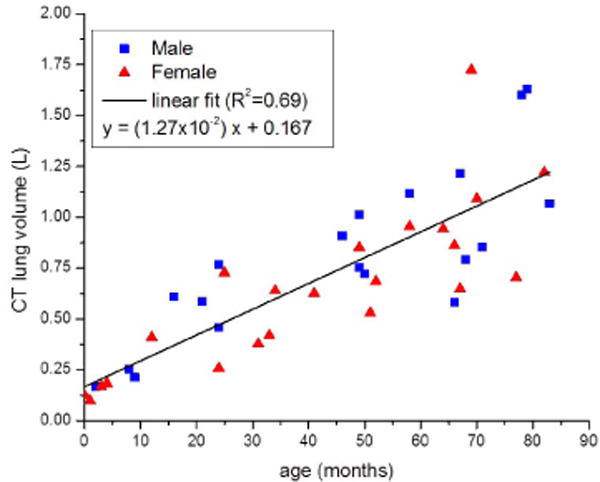
Lung volume (liters [L]) as measured by CT versus patient age (months) with linear regression line. Square data points are male and triangle data points are female. Lung volume increases linearly with patient age
Mean lung attenuation decreased with increasing lung volume; data were fit to a decaying exponential equation y = 433.9 × (e−1.47x) − 872.8, where y is the mean parenchymal attenuation in Hounsfield units (HU) and x is the lung volume in liters (L) (R2=0.69) (Fig. 2). Lung attenuation was highest in children younger than 12 months, with measurements as high as −380 HU in a neonate with a lung volume of 0.10 L. Lung attenuation rapidly decreased to ~−650 HU by age 2 years, after which there was a slow continuous decrease in attenuation approaching a constant value of ~−860 HU, similar to the approximate value of the adult mean lung attenuation reported at full inspiration [57–59].
The graph of mean lung attenuation versus lung volume (Fig. 4) demonstrates the large variation in attenuation between the smallest 0.10-L lungs that have a predicted attenuation of −500 HU, and lungs measuring 1 L and larger, which have a predicted attenuation less than −800 HU based on the decaying exponential equation. There was approximately 12–14% variation among children of the same age or lung volume. Lung mass ranged from 61.1 g to 318.5 g. Lung mass increased linearly with increasing age (Fig. 5).
Fig. 4.
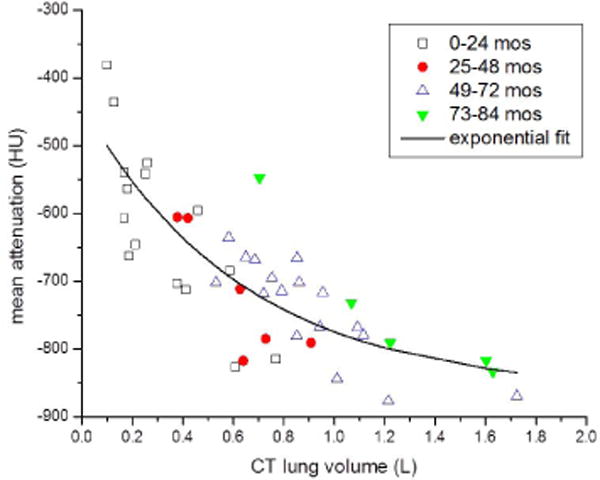
Mean lung attenuation (Hounsfield units [HU]) versus lung volume (liters [L]) with decaying exponential regression line. Automated measurements of mean lung attenuation and lung volume were obtained from CT lung segmentations. Individual data points indicate the patient age range. Mean lung attenuation decreases rapidly in infants and young children with lower lung volumes (<0.8 liters). The decaying exponential regression line shows that as age and lung volume increase, mean lung attenuation approaches a relatively constant adult value of −860 HU. mos months
Fig. 5.
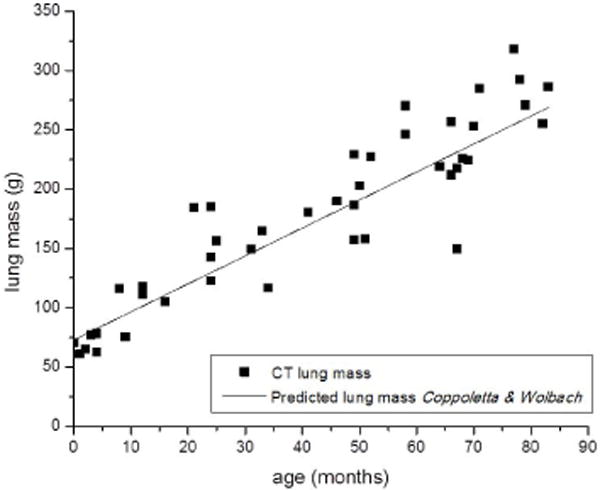
Lung mass (grams [g]) as calculated from CT measured mean lung attenuation (Hounsfield units) and lung volume (liters) versus patient age (months). The solid line indicates the predicted lung mass based on patient age from pediatric postmortem reference organ mass values, adapted from [28]
Gravitational dependence of lung parenchymal attenuation was shown in all children. The attenuation increase in dependent posterior lung was greater than 50% relative to the anterior lung in all four of the children younger than 4 months. The average attenuation increase was 14±10% in children older than 4 months.
Discussion
This study of 42 normal CT examinations provides the largest quantitative analysis of normal pediatric lung parenchymal attenuation to date. It is important to note that our analysis of CT chest examinations performed in routine clinical practice yielded useful results demonstrating the rapid decrease in lung attenuation in young children younger than 2 years, without need for the precise lung volume and technique control of prior studies. The observations of our clinical study are consistent with what has been shown in smaller, controlled prospective studies of lung CT attenuation and gravitational dependence [34–36]. This consistency supports the potential utility of quantitative CT methods in clinical settings, in that sufficient data can be obtained without the restriction imposed by precisely controlled imaging parameters.
Mean lung attenuation decreased with increasing lung volume and likewise, age. Compared to prior studies, this relatively larger set of data in young children across a wide age range and distribution up to 7 years old provides a more detailed pattern of lung attenuation decline as the lungs develop. Specifically, the rate of decline in lung attenuation was the most rapid in children younger than 1 year, with lung volumes between 0.10 L and 0.25 L, slightly less rapid in children 1–2 years old with lung volumes between 0.26 L and 0.77 L, and then more gradual in children older than 2 years with lung volumes ranging 0.38–1.72 L.
The CT-measured lung volumes fall between the predicted total lung capacity and functional residual capacity for patient weight (Fig. 6) based on measurements of pulmonary function reported by Castile et al. [60] for infants up to 14.5 kg. CT-determined lung mass follows the linear regression of predicted pediatric post-mortem reference values from Coppoletta and Wolbach [28] (Fig. 5), which further strengthens confidence in the predictive curve of lung attenuation relationship to lung volume.
Fig. 6.
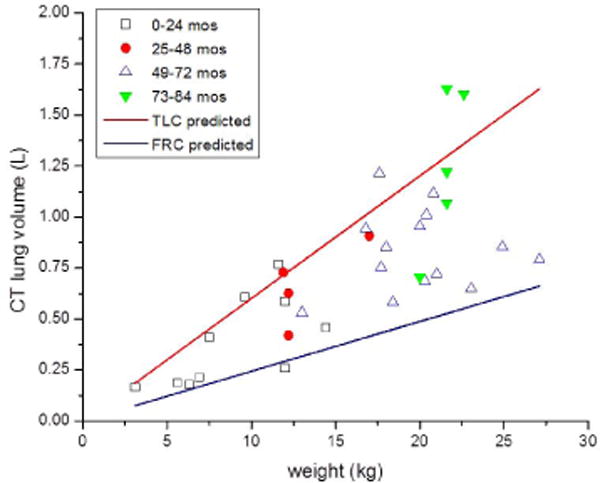
Lung volume (liters [L]) versus patient weight (kilograms [kg]) for children in whom weight values were available. Individual data points indicate the patient age range. Data points fall between the predicted total lung capacity (TLC) and functional residual capacity (FRC) for patient weight. Predicted values are based on equations from [59]. mos months
Gravitational dependence of lung attenuation was observed with significant variability among children. The relative increase in dependent lung attenuation was most pronounced in the youngest children, attributed in part to the lower degree of inspiration in free-breathing infants.
Lung attenuation is a measure of tissue density, which is dependent on the relative amount of gas volume and tissue volume within a given voxel. The variable degree of inspiration and thus lung expansion has a dominant influence on lung attenuation, offering the advantage of examining the clinical implications of CT breathing technique in that lung expansion in children depends on voluntary inspiratory effort or anesthesia-controlled inspiratory pressure, while free-breathing infants are imaged at tidal volume. The observed lung volumes for the youngest children are indeed closer to the predicted functional residual capacity relative to patient weight. It is important to understand and account for these differences in inspiration in the clinical evaluation of pediatric lung disease.
Quantitative CT methods have the potential to alter the clinical evaluation of pediatric lung pathologies in terms of both the imaging technique and interpretation. The ability to distinguish normal from abnormal lung parenchyma based on attenuation characteristics might reduce the need for multiple CT acquisitions now routinely obtained during inspiration and expiration in high-resolution protocols; lung diseases in which expiratory images are required for diagnosis, such as bronchiolitis obliterans, might be evident on images from a single inspiratory acquisition if the normal attenuation range is known, thereby preventing the need for an additional expiratory acquisition that is often difficult to obtain. The evaluation of diffuse lung diseases characterized by altered lung attenuation such as alveolar growth abnormalities and alveolar proteinosis might be improved with quantitative measures and comparison to normal attenuation ranges. The ability to quantify the amount of pathological lung parenchyma in children with bronchopulmonary dysplasia or cystic fibrosis might improve disease classification and yield more tailored treatment strategies. Further studies are needed to elucidate the role and value of quantitative CT methods in the evaluation of pediatric lung disease, and these CT characteristics of normal pediatric lungs provide a foundation of reference values for comparison.
Our study has several limitations. The incomplete record of patient weight and the lack of patient height precluded analyses of body size in relation to lung attenuation. Rather, lung volume was used as a correlate of lung size. In addition, although the aim of the study population is to represent normal pediatric lung parenchyma, CT studies were performed in children for clinical indications that might have introduced some variance from true normal. Although the study population of 42 CT examinations is relatively small, the results provide data for the initial application of CT lung quantitative analysis in children and could be used as a basis for further research in larger trials. Finally, our studies were obtained in a clinical setting subject to the limitations experienced by variability in the precise phase of respiration resulting from patient cooperation, sedation and other technical factors. Although this might be viewed as a limitation compared to a finely controlled prospective trial, it might also be considered a more realistic representation of clinical practice for which this information can be used.
This study provides a foundation of data describing lung parenchymal CT attenuation in a wide age range of children with normal imaging findings. It is important to note that these retrospective data originate from clinical CT studies in which the degree of inspiration and specific CT parameters were not precisely controlled, thereby reflecting common clinical practice.
Conclusion
This study of normal pediatric lung parenchymal CT characteristics is the largest to date and demonstrates the exponential decline in lung attenuation with increasing lung volume. The findings obtained in this analysis of clinical CT examinations are consistent with data from prior highly controlled experimental studies of pediatric lungs. This study is an important addition to the literature in that it provides baseline clinical quantitative data of normal pediatric lung attenuation and its evolution with growth, and can serve as a comparison to quantitative studies of pathological pediatric lung disease.
Acknowledgments
Laura L. Walkup, PhD, is supported by the National Institutes of Health (NIH) grant T32 HL007752.
Footnotes
Conflicts of interest None
References
- 1.Madani A, Keyzer C, Gevenois PA. Quantitative computed tomography assessment of lung structure and function in pulmonary emphysema. Eur Respir J. 2001;18:720–730. doi: 10.1183/09031936.01.00255701. [DOI] [PubMed] [Google Scholar]
- 2.Coxson HO, Rogers RM. Quantitative computed tomography of chronic obstructive pulmonary disease. Acad Radiol. 2005;12:1457–1463. doi: 10.1016/j.acra.2005.08.013. [DOI] [PubMed] [Google Scholar]
- 3.van Beek EJ, Dahmen AM, Stavngaard T, et al. Hyperpolarised 3He MRI versus HRCT in COPD and normal volunteers: PHIL trial. Eur Respir J. 2009;34:1311–1321. doi: 10.1183/09031936.00138508. [DOI] [PubMed] [Google Scholar]
- 4.Gierada DS, Guniganti P, Newman BJ, et al. Quantitative CT assessment of emphysema and airways in relation to lung cancer risk. Radiology. 2011;261:950–959. doi: 10.1148/radiol.11110542. [DOI] [PMC free article] [PubMed] [Google Scholar]
- 5.Barr RG, Berkowitz EA, Bigazzi F, et al. A combined pulmonary-radiology workshop for visual evaluation of COPD: study design, chest CT findings and concordance with quantitative evaluation. COPD. 2012;9:151–159. doi: 10.3109/15412555.2012.654923. [DOI] [PMC free article] [PubMed] [Google Scholar]
- 6.Lynch DA, Al-Qaisi MA. Quantitative computed tomography in chronic obstructive pulmonary disease. J Thorac Imaging. 2013;28:284–290. doi: 10.1097/RTI.0b013e318298733c. [DOI] [PMC free article] [PubMed] [Google Scholar]
- 7.Buckler AJ, Mulshine JL, Gottlieb R, et al. The use of volumetric CT as an imaging biomarker in lung cancer. Acad Radiol. 2010;17:100–106. doi: 10.1016/j.acra.2009.07.030. [DOI] [PubMed] [Google Scholar]
- 8.Mulshine JL, Gierada DS, Armato SG, 3rd, et al. Role of the Quantitative Imaging Biomarker Alliance in optimizing CT for the evaluation of lung cancer screen-detected nodules. J Am Coll Radiol. 2015;12:390–395. doi: 10.1016/j.jacr.2014.12.003. [DOI] [PubMed] [Google Scholar]
- 9.Bartholmai BJ, Raghunath S, Karwoski RA, et al. Quantitative computed tomography imaging of interstitial lung diseases. J Thorac Imaging. 2013;28:298–307. doi: 10.1097/RTI.0b013e3182a21969. [DOI] [PMC free article] [PubMed] [Google Scholar]
- 10.Coxson HO, Hogg JC, Mayo JR, et al. Quantification of idiopathic pulmonary fibrosis using computed tomography and histology. Am J Respir Crit Care Med. 1997;155:1649–1656. doi: 10.1164/ajrccm.155.5.9154871. [DOI] [PubMed] [Google Scholar]
- 11.Witt CA, Sheshadri A, Carlstrom L, et al. Longitudinal changes in airway remodeling and air trapping in severe asthma. Acad Radiol. 2014;21:986–993. doi: 10.1016/j.acra.2014.05.001. [DOI] [PMC free article] [PubMed] [Google Scholar]
- 12.Maldonado F, Moua T, Rajagopalan S, et al. Automated quantification of radiological patterns predicts survival in idiopathic pulmonary fibrosis. Eur Respir J. 2014;43:204–212. doi: 10.1183/09031936.00071812. [DOI] [PubMed] [Google Scholar]
- 13.Kim HJ, Brown MS, Chong D, et al. Comparison of the quantitative CT imaging biomarkers of idiopathic pulmonary fibrosis at baseline and early change with an interval of 7 months. Acad Radiol. 2015;22:70–80. doi: 10.1016/j.acra.2014.08.004. [DOI] [PubMed] [Google Scholar]
- 14.Matsuoka S, Yamashiro T, Matsushita S, et al. Quantitative CT evaluation in patients with combined pulmonary fibrosis and emphysema: correlation with pulmonary function. Acad Radiol. 2015;22:626–631. doi: 10.1016/j.acra.2015.01.008. [DOI] [PubMed] [Google Scholar]
- 15.Dournes G, Laurent F. Airway Remodelling in Asthma and COPD: Findings, Similarities, and Differences Using Quantitative CT. Pulm Med. 2012;2012:670414. doi: 10.1155/2012/670414. [DOI] [PMC free article] [PubMed] [Google Scholar]
- 16.Jain N, Covar RA, Gleason MC, et al. Quantitative computed tomography detects peripheral airway disease in asthmatic children. Pediatr Pulmonol. 2005;40:211–218. doi: 10.1002/ppul.20215. [DOI] [PubMed] [Google Scholar]
- 17.Walker C, Gupta S, Hartley R, et al. Computed tomography scans in severe asthma: utility and clinical implications. Curr Opin Pulm Med. 2012;18:42–47. doi: 10.1097/MCP.0b013e32834db255. [DOI] [PMC free article] [PubMed] [Google Scholar]
- 18.Choi S, Hoffman EA, Wenzel SE, et al. Improved CT-based estimate of pulmonary gas trapping accounting for scanner and lung-volume variations in a multicenter asthmatic study. J Appl Physiol. 2014;117:593–603. doi: 10.1152/japplphysiol.00280.2014. [DOI] [PMC free article] [PubMed] [Google Scholar]
- 19.Burri PH. Structural aspects of postnatal lung development - alveolar formation and growth. Biol Neonate. 2006;89:313–322. doi: 10.1159/000092868. [DOI] [PubMed] [Google Scholar]
- 20.Mund SI, Stampanoni M, Schittny JC. Developmental alveolarization of the mouse lung. Dev Dyn. 2008;237:2108–2116. doi: 10.1002/dvdy.21633. [DOI] [PubMed] [Google Scholar]
- 21.Tschanz SA, Salm LA, Roth-Kleiner M, et al. Rat lungs show a biphasic formation of new alveoli during postnatal development. J Appl Physiol. 2014;117:89–95. doi: 10.1152/japplphysiol.01355.2013. [DOI] [PubMed] [Google Scholar]
- 22.Barre SF, Haberthur D, Stampanoni M, et al. Efficient estimation of the total number of acini in adult rat lung. Physiol Rep. 2014;2(7) doi: 10.14814/phy2.12063. [DOI] [PMC free article] [PubMed] [Google Scholar]
- 23.Narayanan M, Owers-Bradley J, Beardsmore CS, et al. Alveolarization continues during childhood and adolescence: new evidence from helium-3 magnetic resonance. American journal of respiratory and critical care medicine. 2012;185:186–191. doi: 10.1164/rccm.201107-1348OC. [DOI] [PMC free article] [PubMed] [Google Scholar]
- 24.Schittny JC, Mund SI, Stampanoni M. Evidence and structural mechanism for late lung alveolarization. Am J Physiol Lung Cell Mol Physiol. 2008;294:L246–254. doi: 10.1152/ajplung.00296.2007. [DOI] [PubMed] [Google Scholar]
- 25.Rao L, Tiller C, Coates C, et al. Lung growth in infants and toddlers assessed by multi-slice computed tomography. Academic Radiology. 2010;17:1128–1135. doi: 10.1016/j.acra.2010.04.012. [DOI] [PMC free article] [PubMed] [Google Scholar]
- 26.Rosenthal M, Bain SH, Cramer D, et al. Lung function in white children aged 4 to 19 years: I Spirometry. Thorax. 1993;48:794–802. doi: 10.1136/thx.48.8.794. [DOI] [PMC free article] [PubMed] [Google Scholar]
- 27.Rosenthal M, Cramer D, Bain SH, et al. Lung function in white children aged 4 to 19 years: II Single breath analysis and plethysmography. Thorax. 1993;48:803–808. doi: 10.1136/thx.48.8.803. [DOI] [PMC free article] [PubMed] [Google Scholar]
- 28.Coppoletta JM, Wolbach SB. Body Length and Organ Weights of Infants and Children: A Study of the Body Length and Normal Weights of the More Important Vital Organs of the Body between Birth and Twelve Years of Age. Am J Pathol. 1933;9:55–70. [PMC free article] [PubMed] [Google Scholar]
- 29.Cook CD, Hamann JF. Relation of lung volumes to height in healthy persons between the ages of 5 and 38 years. J Pediatr. 1961;59:710–714. doi: 10.1016/s0022-3476(61)80007-3. [DOI] [PubMed] [Google Scholar]
- 30.de Jong PA, Nakano Y, Lequin MH, et al. Estimation of lung growth using computed tomography. Eur Respir J. 2003;22:235–238. doi: 10.1183/09031936.03.00089702. [DOI] [PubMed] [Google Scholar]
- 31.Rosenblum LJ, Mauceri RA, Wellenstein DE, et al. Density patterns in the normal lung as determined by computed tomography. Radiology. 1980;137:409–416. doi: 10.1148/radiology.137.2.7433674. [DOI] [PubMed] [Google Scholar]
- 32.Hedlund L, Vock P, Effmann E. Computed tomography of the lung. Densitometric studies. Radiol Clin North Am. 1983;21:775–788. [PubMed] [Google Scholar]
- 33.Lee JY, Shank B, Bonfiglio P, et al. CT analysis of lung density changes in patients undergoing total body irradiation prior to bone marrow transplantation. J Comput Assist Tomogr. 1984;8:885–891. doi: 10.1097/00004728-198410000-00014. [DOI] [PubMed] [Google Scholar]
- 34.Vock P, Malanowski D, Tschaeppeler H, et al. Computed tomographic lung density in children. Invest Radiol. 1987;22:627–631. doi: 10.1097/00004424-198708000-00002. [DOI] [PubMed] [Google Scholar]
- 35.Ringertz HG, Brasch RC, Gooding CA, et al. Quantitative density-time measurements in the lungs of children with suspected airway obstruction using ultrafast CT. Pediatr Radiol. 1989;19:366–370. doi: 10.1007/BF02387628. [DOI] [PubMed] [Google Scholar]
- 36.Long FR, Williams RS, Castile RG. Inspiratory and expiratory CT lung density in infants and young children. Pediatr Radiol. 2005;35:677–683. doi: 10.1007/s00247-005-1450-6. [DOI] [PubMed] [Google Scholar]
- 37.Long FR, Castile RG. Technique and clinical applications of full-inflation and end-exhalation controlled-ventilation chest CT in infants and young children. Pediatric radiology. 2001;31:413–422. doi: 10.1007/s002470100462. [DOI] [PubMed] [Google Scholar]
- 38.Sarria EE, Mattiello R, Rao L, et al. Quantitative assessment of chronic lung disease of infancy using computed tomography. Eur Respir J. 2012;39:992–999. doi: 10.1183/09031936.00064811. [DOI] [PMC free article] [PubMed] [Google Scholar]
- 39.Bonnel AS, Song SM, Kesavarju K, et al. Quantitative air-trapping analysis in children with mild cystic fibrosis lung disease. Pediatr Pulmonol. 2004;38:396–405. doi: 10.1002/ppul.20091. [DOI] [PubMed] [Google Scholar]
- 40.de Jong PA, Nakano Y, Hop WC, et al. Changes in airway dimensions on computed tomography scans of children with cystic fibrosis. Am J Respir Crit Care Med. 2005;172:218–224. doi: 10.1164/rccm.200410-1311OC. [DOI] [PubMed] [Google Scholar]
- 41.Goris ML, Zhu HJ, Blankenberg F, et al. An automated approach to quantitative air trapping measurements in mild cystic fibrosis. Chest. 2003;123:1655–1663. doi: 10.1378/chest.123.5.1655. [DOI] [PubMed] [Google Scholar]
- 42.Loeve M, Rosenow T, Gorbunova V, et al. Reversibility of trapped air on chest computed tomography in cystic fibrosis patients. Eur J Radiol. 2015;84:1184–1190. doi: 10.1016/j.ejrad.2015.02.011. [DOI] [PubMed] [Google Scholar]
- 43.Rosenow T, Oudraad MC, Murray CP, et al. PRAGMA-CF. A Quantitative Structural Lung Disease Computed Tomography Outcome in Young Children with Cystic Fibrosis. Am J Respir Crit Care Med. 2015;191:1158–1165. doi: 10.1164/rccm.201501-0061OC. [DOI] [PubMed] [Google Scholar]
- 44.DeBoer EM, Swiercz W, Heltshe SL, et al. Automated CT scan scores of bronchiectasis and air trapping in cystic fibrosis. Chest. 2014;145:593–603. doi: 10.1378/chest.13-0588. [DOI] [PMC free article] [PubMed] [Google Scholar]
- 45.Strauss KJ, Goske MJ, Kaste SC, et al. Image gently: ten steps you can take to optimize image quality and lower CT dose for pediatric patients. AJR Am J Roentgenol. 2010;194:868–873. doi: 10.2214/AJR.09.4091. [DOI] [PubMed] [Google Scholar]
- 46.Callahan MJ. CT dose reduction in practice. Pediatr Radiol. 2011;41(Suppl 2):488–492. doi: 10.1007/s00247-011-2099-y. [DOI] [PubMed] [Google Scholar]
- 47.Frush DP. Overview of CT technologies for children. Pediatr Radiol. 2014;44(Suppl 3):422–426. doi: 10.1007/s00247-014-3043-8. [DOI] [PubMed] [Google Scholar]
- 48.Nelson TR. Practical strategies to reduce pediatric CT radiation dose. J Am Coll Radiol. 2014;11:292–299. doi: 10.1016/j.jacr.2013.10.011. [DOI] [PubMed] [Google Scholar]
- 49.Brenner DJ, Elliston CD, Hall EJ, et al. Estimated risks of radiation-induced fatal cancer from pediatric CT. AJR Am J Roentgenol. 2001;176:289–296. doi: 10.2214/ajr.176.2.1760289. [DOI] [PubMed] [Google Scholar]
- 50.Brody AS, Frush DP, Huda W, et al. Radiation risk to children from computed tomography. Pediatrics. 2007;120:677–682. doi: 10.1542/peds.2007-1910. [DOI] [PubMed] [Google Scholar]
- 51.Miglioretti DL, Johnson E, Williams A, et al. The use of computed tomography in pediatrics and the associated radiation exposure and estimated cancer risk. JAMA pediatrics. 2013;167:700–707. doi: 10.1001/jamapediatrics.2013.311. [DOI] [PMC free article] [PubMed] [Google Scholar]
- 52.Colagrande S, Origgi D, Zatelli G, et al. CT exposure in adult and paediatric patients: a review of the mechanisms of damage, relative dose and consequent possible risks. Radiol Med. 2014;119:803–810. doi: 10.1007/s11547-014-0393-0. [DOI] [PubMed] [Google Scholar]
- 53.Yoon SH, Goo JM, Goo HW. Quantitative thoracic CT techniques in adults: can they be applied in the pediatric population? Pediatr Radiol. 2013;43:308–314. doi: 10.1007/s00247-012-2467-2. [DOI] [PubMed] [Google Scholar]
- 54.Xu Y, Sonka M, McLennan G, et al. MDCT-based 3-D texture classification of emphysema and early smoking related lung pathologies. IEEE Trans Med Imaging. 2006;25:464–475. doi: 10.1109/TMI.2006.870889. [DOI] [PubMed] [Google Scholar]
- 55.Coxson HO, Mayo JR, Behzad H, et al. Measurement of lung expansion with computed tomography and comparison with quantitative histology. J Appl Physiol. 1995;79:1525–1530. doi: 10.1152/jappl.1995.79.5.1525. [DOI] [PubMed] [Google Scholar]
- 56.Hoffman EA. Effect of body orientation on regional lung expansion: a computed tomographic approach. J Appl Physiol. 1985;59:468–480. doi: 10.1152/jappl.1985.59.2.468. [DOI] [PubMed] [Google Scholar]
- 57.Zach JA, Newell JD, Jr, Schroeder J, et al. Quantitative computed tomography of the lungs and airways in healthy nonsmoking adults. Invest Radiol. 2012;47:596–602. doi: 10.1097/RLI.0b013e318262292e. [DOI] [PMC free article] [PubMed] [Google Scholar]
- 58.Verschakelen JA, Van fraeyenhoven L, Laureys G, et al. Differences in CT density between dependent and nondependent portions of the lung: influence of lung volume. AJR Am J Roentgenol. 1993;161:713–717. doi: 10.2214/ajr.161.4.8372744. [DOI] [PubMed] [Google Scholar]
- 59.Gevenois PA, Scillia P, de Maertelaer V, et al. The effects of age, sex, lung size, and hyperinflation on CT lung densitometry. AJR Am J Roentgenol. 1996;167:1169–1173. doi: 10.2214/ajr.167.5.8911175. [DOI] [PubMed] [Google Scholar]
- 60.Castile R, Filbrun D, Flucke R, et al. Adult-type pulmonary function tests in infants without respiratory disease. Pediatr Pulmonol. 2000;30:215–227. doi: 10.1002/1099-0496(200009)30:3<215::aid-ppul6>3.0.co;2-v. [DOI] [PubMed] [Google Scholar]


