Abstract
Both neuroinflammation and microglial activation are pathological markers of a number of central nervous system (CNS) diseases. During chronic activation of the microglial cells, the induced release of excessive amounts of reactive oxygen species (ROS) and pro-inflammatory cytokines have been implicated in several neurodegenerative diseases such as Alzheimer’s disease. Thymoquinone (TQ), a major bioactive compound of the natural product Nigella sativa seed, has been shown to be effective against numerous oxidative stress-induced and inflammatory disorders as well as possess neuroprotective properties. In this study, we investigated the antioxidant effects of TQ on LPS/IFNγ or H2O2-activated BV-2 microglia by assessing the levels of specific oxidative stress markers, the activities of selected antioxidant enzymes, as well as profiling 84 key genes related to oxidative stress via real-time reverse transcription (RT2) PCR array. Our results showed that in the LPS/IFNγ-activated microglia TQ significantly decreased the cellular production of both superoxide and nitric oxide 4-fold (p<0.0001) and 6 fold (p<0.0001), respectfully. In the H2O2-activated microglia, TQ also significantly decreased the cellular production of superoxide 3-fold (p<0.0001) and significantly decreased hydrogen peroxide levels ~20% (p<0.05). Moreover, TQ treatment significantly decreased the levels oxidative stress in the activated BV-2 as evidenced by the assessed levels of lipid hydroperoxides and glutathione. TQ significantly decreased the levels of lipid hydroperoxides 2-fold (p<0.0001) and significantly increased the levels of antioxidant glutathione 2.5-fold (p<0.0001) in the LPS/IFNγ-activated BV-2 cells. In the H2O2-activated microglia, TQ significantly decreased lipid hydroperoxides 8-fold (p<0.0001) and significantly increased glutathione 15% (p<0.05). Activities of antioxidant enzymes, superoxide dismutase (SOD) and catalase (CAT), in the TQ-treated microglial cells also reflected a reduced oxidative stress status in the cellular environment. SOD and CAT activities were 6 fold (p<0.0001) and 5 fold (p<0.0001) lower, respectfully, for the LPS/INFγ-activated microglia treated with TQ in comparison to those that were not. For the H2O2-activated microglia treated with TQ, SOD and CAT activities were 5 fold (p<0.0001) and 3 fold (p<0.01) lower, respectfully, compared to the untreated. Furthermore, RT2 PCR array profiling of the selected 84 genes related to oxidative stress confirmed that TQ treatment in the LPS/IFNγ-activated microglia downregulates specific pro-oxidant genes, upregulates specific anti-oxidant genes, and enhances the up- or downregulation of specific genes related to the cells’ natural antioxidant defense against LPS/IFNγ activation. These findings suggest that TQ may be utilized as an effective therapeutic agent for delaying the onset and/or slowing/preventing the progression of microglia-derived neurodegeneration propagated by excessive oxidative stress in the CNS.
Keywords: microglia, thymoquinone, oxidative stress, neurodegenerative disease
Introduction
Microglia are the specialized immune cells that serve as the brain’s resident macrophages providing its innate immune function [1–6]. They exhibit either a quiescent/resting or activated phenotype according to local cellular conditions [7]. In a normal, healthy brain a majority of the microglia are in a usually in the resting state, during which they constantly surveil their microenvironment to remain ready for immediate activation i.e. reaction to an immunological challenge such as local injury or invading pathogens [1, 2, 8, 9]. Activation of microglia and its phagocytic response are a central part of the brain’s defense mechanism to ensure healthy neuronal function [10]. It helps to restore CNS homeostasis during pathological conditions via removal of unwanted cellular debris and pathogens and secreting neurotrophic agents in support of surrounding neurons [11–14]. However, overactivated microglia exhibit chronic inflammatory response and can lead to the overproduction of pro-inflammatory cytokines and reactive oxygen/nitrogen species (ROS/RNS), specifically superoxide and nitric oxide (NO). This combination produces the powerful pro-oxidant peroxynitrite (ONOO−) which can cause neurotoxic injury to surrounding neurons and thereby contribute to the progressive damage observed in neurodegenerative diseases (ND) [11, 12, 15–24]. Microglia-derived excessive oxidative stress and chronic neuroinflammation have more recently been recognized as important pathological events in Alzheimer’s disease (AD), especially in the onset and development of the disease [25–30].
Over the last few decades, there has been rapidly growing interest in naturally occurring phytochemical compounds with antioxidant, anti-inflammatory, as well as neuroprotective potential, not only because of the concerns about the side effects of conventional medicine, but also because natural products are comparatively inexpensive and typically readily available in an ingestible form [31]. Additionally, given that medicinal plants serving as effective therapeutics for a multitude of conditions and disorders date back numerous generations and thousands of years [32, 33], they are viewed as relatively nontoxic, and therefore, are preferred over conventional medicine [34].
Amongst the promising medicinal plants is Nigella sativa, a dicotyledon of the Ranunculaceae family, an annual herbaceous plant that grows wildly in countries bordering the Mediterranean and is widely cultivated and distributed in the Middle East, the Indian subcontinent, Middle Europe, and western Asia [31, 35–40]. It produces capsule-like fruit full of numerous white trigonal seeds which turn black upon exposure to air after the fruit capsule matures and opens [41]. The black seeds also called black cumin, or black caraway seed are the richest source of its bioactive compounds including thymoquinone (TQ; 2-isopropyl- 5-methyl-1, 4-benzoquinone) [31, 36, 42]. Thymoquinone (TQ) is the most abundant bioactive component in the volatile oil from Nigella sativa black seeds [43, 44]; ranging from 18.4–24.0% [44–47] to as high as 27.8 – 57% TQ [31, 36, 37, 42, 48, 49] depending on where the plant is cultivated and how the oil is extracted [39, 50]. Scientific research shows that TQ possesses reproducible antioxidant effects. TQ acts as a potent scavenger of various ROS including superoxide radical anion and hydroxyl radicals [51–53], enhances the oxidant scavenger system via preserving the activity of various antioxidant enzymes such as catalase and glutathione peroxidase [34, 37, 47, 50, 54], and mediates an inhibitory effect on NO production [55]. TQ also inhibits non-enzymatic lipid peroxidation via inhibiting the generation eicosanoids, namely thromboxane B2 and leukotriene B4 [31, 48, 51–53, 56, 57]. The oil and TQ have also shown potent anti-inflammatory effects on several inflammation-based models including experimental encephalomyelitis, colitis, peritonitis, asthma, and arthritis through suppression of pro-inflammatory mediators [31, 37, 46, 50, 54, 58, 59]. Additionally, studies show that TQ possess neuroprotective [46, 47, 60–62], antimicrobial [42, 50], antidiabetic [42, 50, 63], anticancer [34] and beneficial immunomodulatory properties [36, 44, 54].
Given what is now known about the early pathophysiology of ND, the goal in the pharmacological research evolves into the development of therapies that target the underlying mechanisms of ND. Furthermore, recent studies have shown that the pathophysiological changes related to ND occur decades before the clinical symptoms [64]. Therefore, it is ideal to halt or delay ND development and progression in the critical pre-clinical phase. Targeting the minimization the oxidative damage and neuroinflammation precipitated from activated microglia observed in ND’s early pathophysiology may prove to be a viable therapeutic approach [12, 65–71]. Because TQ has anti-oxidant, anti-inflammatory, and neuroprotective properties, it may be an agent which not only prevents the direct injurious effects of oxidants but also may fundamentally alter the underlying inflammatory processes that play an important role in the pathology of ND such as AD [31]. Here we examined the antioxidant effects of TQ on the microglia activated by the presence of LPS/IFNγ or H2O2.
Methods and Materials
High glucose Dulbecco’s Modified Eagle’s Medium (DMEM) supplemented with 4 mM GlutaMAX™, penicillin-streptomycin (10,000 U/mL), interferon gamma recombinant mouse protein (IFNγ), and trypsin/EDTA (0.25%), phenol red were purchased from Thermo Fisher Scientific (formerly Life Technologies). The heat-inactivated fetal bovine serum (FBS) was purchased from Atlanta Biologicals. Thymoquinone (99% purity; Cat # 274666), lipopolysaccharides from Escherichia coli (LPS) and the reagents for the nitric oxide and superoxide anion assays were purchased from Sigma-Aldrich. The Superoxide Dismutase (SOD), Catalase (CAT), Glutathione (GSH), and Hydrogen Peroxide (H2O2) Cell-Based Assay Kits were purchased from Cayman Chemical. The supplies and reagents for the Oxidative Stress PCR Array assay, including the RT2 Profiler PCR Array (Cat #: 330231-PAMM 065Z), the RNeasy Mini Kit (Cat #: 74104/74106), the RNase-Free DNase Set (Cat #: 79254), QIAshredders (Cat #: 79656), the RT2 First Strand Kit (Cat #: 330401), and the RT2 SYBR Green Mastermix (Cat #: 330500) were purchased from Qiagen.
Cell Culture
The BV-2 cell line is an immortalized murine microglial cell line supplied by the lab of Elisabeth Blasi at the University of Perugia [72]. The BV-2 cells were cultured in high glucose DMEM-GlutaMAX™ media containing phenol red, 10% heat-inactivated FBS, 100U/mL penicillin, and 100μg/mL streptomycin. The cells were maintained at 37°C in a 5% CO2 humidified atmosphere with the media changed every 2–3 days.
Cell Viability
The BV-2 cells were seeded (5×10⁵ cells/mL) in 96-well plates (100 μL/well) and treated with thymoquinone (TQ) at concentrations ranging 0 – 40 μM in experimental cell culture media (high glucose DMEM-GlutaMAX™, 2.5% heat-inactivated FBS) for 24 h. The TQ stock was freshly prepared by initially dissolving in DMSO then diluting further with experimental media to the appropriate concentration for each treatment so that the concentration of DMSO did not exceed 0.025% which was used for the control (0 μM TQ). Cell viability was assessed using resazurin dye (7-hydroxy-3H-phenoxazin-3-one 10-oxide), a cell permeable redox indicator that is used as a measure of the viable cell count.
Briefly, a working solution of resazurin was prepared in HBSS (pH 7.4) at 0.5 mg/mL and passed through a 0.2-μm filter into a sterile, light-protected container. The dye solution was added to the samples (20 μL of reagent to the 100 μL of the medium in the 96-well format) and returned to the incubator (37°C) for 4 hrs to allow the viable cells to convert the dark blue resazurin dye to the bright pink fluorescent resorufin product via redox reactions. The conversion of resazurin to the fluorescent resorufin is proportional to the number of metabolically active, viable cells presented in a population and was quantitatively measured on a microplate fluorometer using 550 nm excitation/580 nm emission filter settings.
For the assay experiments thereafter, BV-2 cells (5×10⁵ cells/mL) were seeded overnight to attach, then activated with either 500 ng/mL LPS + 0.5 ng/mL IFNγ (LPS/IFNγ) or 75 μM H2O2 in the presence or absence of TQ for 24 h.
Superoxide Assay
Intracellular superoxide radical anion (•O2−) content was measured using a more sensitive nitro-blue tetrazolium (NBT) assay method developed by Choi, HS and colleagues [73] based on the reduction of yellow colored-NBT to NBT blue formazan by •O2−.
Briefly, BV-2 cells were seeded (5×10⁵ cells/mL) overnight in 24-well culture plates then treated as previously described in triplicate for 24 h in phenol-red –free and serum-free medium. The cultures were incubated with 100 μL of yellow-colored nitro-blue tetrazolium (Y-NBT) solution containing 600 ng/mL PMA (phorbol 12-myristate 13-acetate) for 45–60 min. As negative controls, some cells were incubated in Y-NBT solution containing PMA with 30 μg/mL SOD. After incubation, cells were washed twice with warm PBS, then once with methanol, and air-dried. The NBT blue formazan deposited inside the cells were dissolved in DMSO (140 μL) after solubilizing the cell membranes with the addition of 120 μL of 2M KOH to each well. The plate was incubated for 10 min at room temperature with gentle shaking. The dissolved NBT solution was transferred to a 96-well plate, and the absorbance was read at 620 nm.
Nitric Oxide (Griess) Assay
The BV-2 cells’ nitric oxide (NO) production by was determined by measuring the amount of nitrite (NO2−), a relatively stable oxidation product, released in the cell cultures’ supernatants with a colorimetric assay using Griess reagent (1% sulfanilamide and 0.1% N- (1-naphthyl) - ethylenediamine hydrochloride in 5% phosphoric acid (H3PO4)).
Briefly, BV-2 cells (5×10⁴ cells/well, in a 96-well plate) were seeded overnight to attach, then treated as previously described for 24 h. Equal volumes (50 μL each) of Griess reagent was combined with cell culture supernatant and incubated for 10 min at room temperature, protected from light. The absorbance at 530–550 nm was measured with a microplate spectrophotometer. Concentrations of NO present in the samples are calculated using a standard curve generated from known concentrations (0 – 160 μM) of sodium nitrite (NaNO2) freshly prepared in the culture medium, subtracting for background nitrite.
Hydrogen Peroxide Cell-Based Assay
Quantitation of the extracellular H2O2 produced by the BV-2 cells is detected using the highly sensitive and stable H2O2 probe, ADHP (10-acetyl-3,7-dihydroxyphenoxzine) in which it reacts with H2O2 to produce the highly fluorescent resorufin using horseradish peroxidase (HRP) as a catalyst.
Briefly, cells were seeded in a 96-well plate (5×10⁴ cells/well) overnight in 100 μL/well of serum-free culture medium, then treated as previously described for 24 h. Extra wells containing medium and experimental compounds without cells were included for treatment-controls and catalase controls as directed in the kit’s manual. The samples were assayed according to the kit’s protocol. The fluorescence intensity (excitation = 530 nm; emission = 590 nm) of each well was measured using microplate reader.
Lipid Hydroperoxide Assay
Lipid hydroperoxides were directly measured utilizing reduction/oxidation reactions with ferrous ions yielding ferric ions that are readily detected via the thiocyanate ion chromagen.
Brief; ly, BV-2 cells were seeded (5×10⁵ cells/mL) overnight in T-75 flasks, treated as previously described for 24 h then harvested using a cell scraper and collected by centrifugation at 1,000–2,000×g for 10 minutes at 4°C. The pellet was homogenized via sonication in 1 – 2 mL of HPLC-grade water and the lipid hydroperoxides were extracted from the samples into freshly deoxygenated chloroform just before performing the assay according to the kit’s instructions. At the completion of the assay reaction, the assay mixtures for each sample were transferred into the designated wells of the kit provided 96-well solid glass plate, and the absorbance was measured at 500 nm using a plate reader.
Glutathione Assay
The total GSH content was measured utilizing a carefully optimized enzymatic DTNB (5, 5′-dithio-bis-2-(nitrobenzoic acid), Ellman’s reagent) - GSSG reductase recycling method forming a yellow product (5-thio-2nitrobenzoic acid) at a rate directly proportional to the concentration of total GSH in the sample.
Briefly, cells cultured and treated in T-75 flasks, as previously described, were harvested using a cell scraper and collected by centrifugation at 1,000–2,000×g for 10 minutes at 4°C. The pellet was homogenized via sonication in 1 – 2 mL of cold 50 mM MES buffer, pH 6–7, containing 1 mM EDTA and centrifuged at 10,000×g at 4°C for 15 minutes. The supernatants were retained on ice for deproteinization with equal volume freshly prepared 10% metaphosphoric acid (MPA) reagent. The samples were prepared for measurement with the addition of freshly prepared 4 M TEAM reagent. The assay was carried out according to the kit’s instructions, and the absorbance was measured at 405 – 414 nm.
Superoxide Dismutase (SOD) and Catalase (CAT) Enzyme Activity Assays
The antioxidant enzymes, SOD, and CAT are crucial in the cellular antioxidant defense mechanism, catalyzing the dismutation of superoxide anion and detoxification of H2O2, respectfully. Total SOD activity was assayed utilizing a tetrazolium salt for detection of superoxide radicals generated by xanthine oxidase and hypoxanthine. Catalase (CAT) activity was measured utilizing the peroxidation function of the enzyme reacting with methanol in the presence of an optimal concentration of H2O2 to produce formaldehyde that reacts with a chromagen to produce a colorimetric product.
Briefly, cells cultured and treated in T-75 flasks, as previously described, were harvested using a cell scraper and collected via centrifugation at 1,000 – 2,000×g for 10 minutes at 4°C. The cell pellets were sonicated in the appropriate ice-cold buffer indicated in the kit’s instructions, then centrifuged at the designated speed and time at 4 °C, and the supernatants were retained for assay as directed in the kit’s instructions. The absorbance at the designated wavelengths was measured using a plate reader.
RT2 Profiler PCR Array – Oxidative Stress
Profiling the expression of 84 key genes related to oxidative stress was performed using the Oxidative Stress RT2 Profiler PCR Array. The functional grouping of the genes of interest in this array includes a selection of genes for peroxidases, genes involved in ROS metabolism, and relevant oxygen transporter genes.
Briefly, the BV-2 cells were seeded (5×10⁵ cells/mL) in T-75 flasks (20 mL/flask), treated as previously described, harvested using cell scrapers then collected via centrifugation in RNase-free polypropylene tubes. The supernatant was completely removed from the cell pellet via aspiration, and the RNA was extracted and purified according to the manufacturer’s instructions using Qiagen’s RNeasy Mini Kit with the assistance of QIAshredders to homogenize the cell pellets and the RNase-Free DNase Set to ensure a complete DNA removal. RNA quantity and purity was determined spectrophotometrically (Nanodrop) before converting the purified extracted RNA into first-strand cDNA using the Qiagen RT2 First Strand Kit according to the manufacturer’s instructions. The prepared cDNA was then mixed with an appropriate amount RT2 SYBR Green Mastermix and RNase-free water in a 5 mL tube as directed and this mixture was aliquoted into the wells of the RT2 Profiler PCR Array. The RT2 Profiler PCR Array was tightly sealed, centrifuged for 1 minute at 1000×g at room temperature (15 – 25 °C), and run on the PCR cycling program.
Data Analysis
Results are expressed as mean values ± SEM. Statistical analysis was performed using GraphPad Prism 6 (version 6.07; Graph Pad Software Inc. San Diego, CA, USA) Data were analyzed using One-Way ANOVA with Tukey’s post hoc multiple comparisons test. Values of p < 0.05 were considered statistically significant. Data generated from the RT2 Profiler PCR Array was analyzed via Qiagen’s PCR Array Data Analysis Web Portal at www.SABiosciences.com/pcrarraydataanalysis.php.
Results
Cell Viability
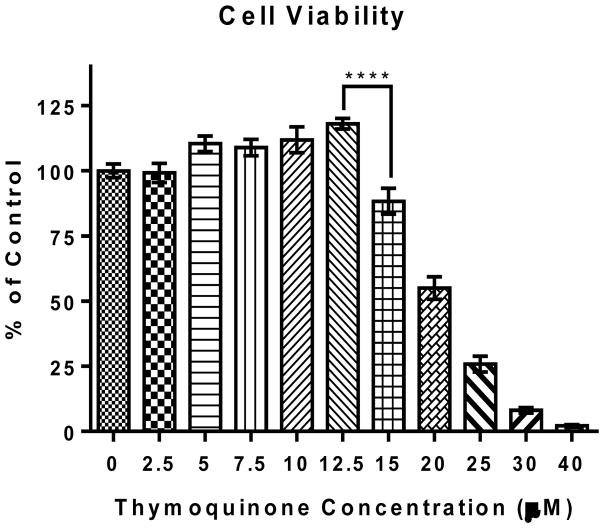
The effect of TQ BV-2 cells was determined using resazurin dye (7-hydroxy-3H-phenoxazin-3-one 10-oxide) after 24 hr. treatment. TQ did not decrease BV-2 microglial cell viability at concentrations ≤12.5 μM. However, there was a significant (**** P ≤ 0.0001) dose-dependent decrease in cell viability for TQ concentrations ≥15 μM. Therefore to observe the maximum effect of TQ without reducing cell viability, 12.5 μM TQ from freshly prepared stock was used for experiments.
Thymoquinone Decreases Superoxide and Nitric Oxide Production and Hydrogen Peroxide Levels in activated microglia
Superoxide
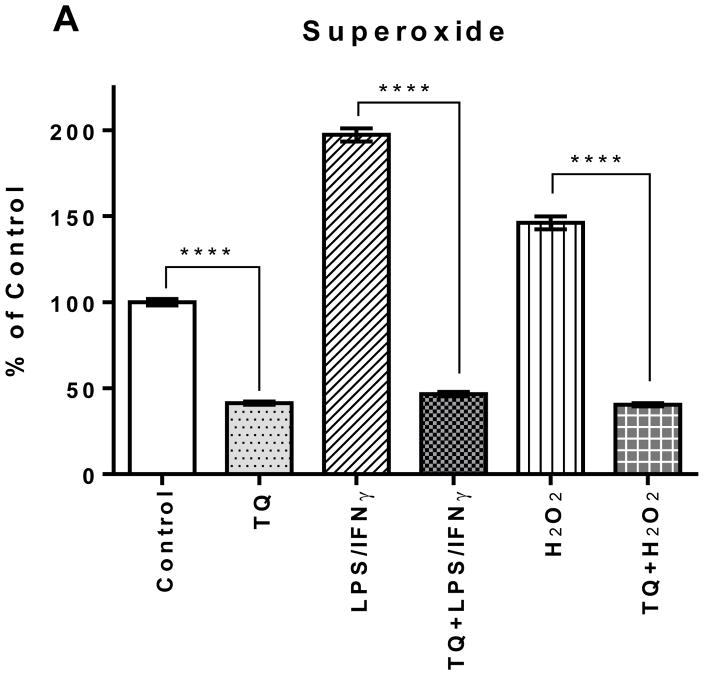
The superoxide levels in the LPS/IFNγ- and H2O2-activated cells were 200% and 150%, respectfully, higher than the control. TQ treatment significantly reduced superoxide levels in the LPS/IFNγ- and H2O2-activated BV-2 microglial cells as well as the control BV-2 microglial cells (p<0.0001). There was no significant difference amongst all the TQ-treated cells. TQ treatment decreased superoxide levels for all groups to 40–50% of the superoxide level of the control.
Nitric Oxide
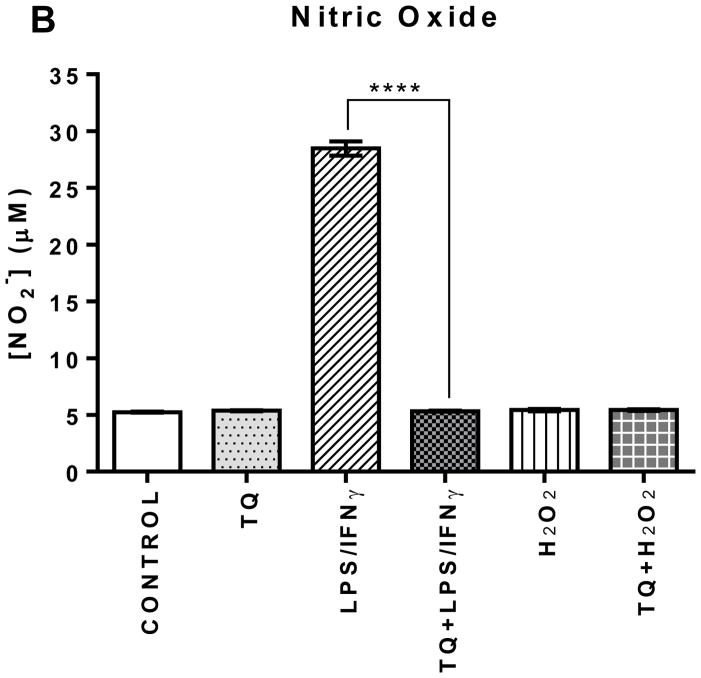
There was no statistical difference in the cellular NO production amongst the Control, TQ-treated, H2O2-activated, and the TQ-treated + H2O2-activated experimental groups. However, there was a significant (**** P ≤ 0.0001) decrease in NO production in the TQ-treated + LPS/IFNγ-activated cells compared the LPS/IFNγ-activated cells. Nitric oxide production was decreased >5-fold in the LPS/IFNγ-activated microglial cells treated with TQ versus those without treatment, bringing NO levels in the similar range of the control cells.
Hydrogen Peroxide
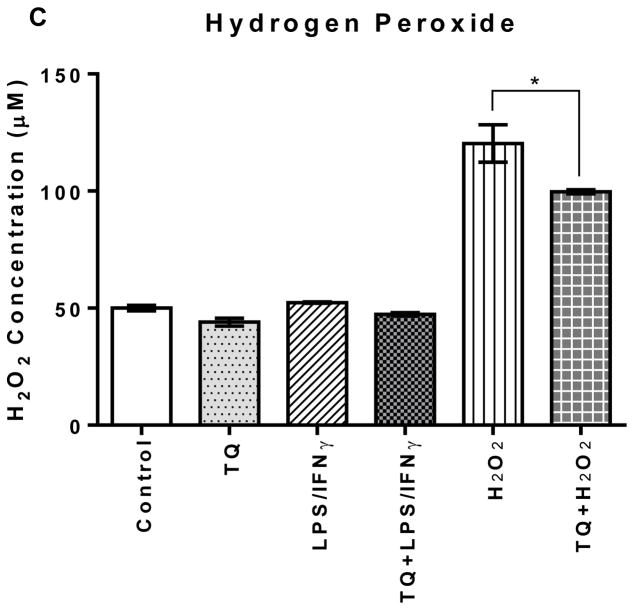
TQ treatment significantly (p<0.05) reduced the levels of hydrogen peroxide for the H2O2-activated microglial cells. However, there was no significant difference amongst the other experimental groups: control, TQ, LPS/IFNγ, and TQ+LPS/IFNγ. The LPS/IFNγ-activated microglial cells did not have elevated hydrogen peroxide levels compared to the controls, and there was no significant difference in hydrogen peroxide levels between the TQ treated and control microglial cells.
Thymoquinone Decreases Lipid Hydroperoxides and Increases Antioxidant Glutathione in Activated Microglia
Lipid Hydroperoxides
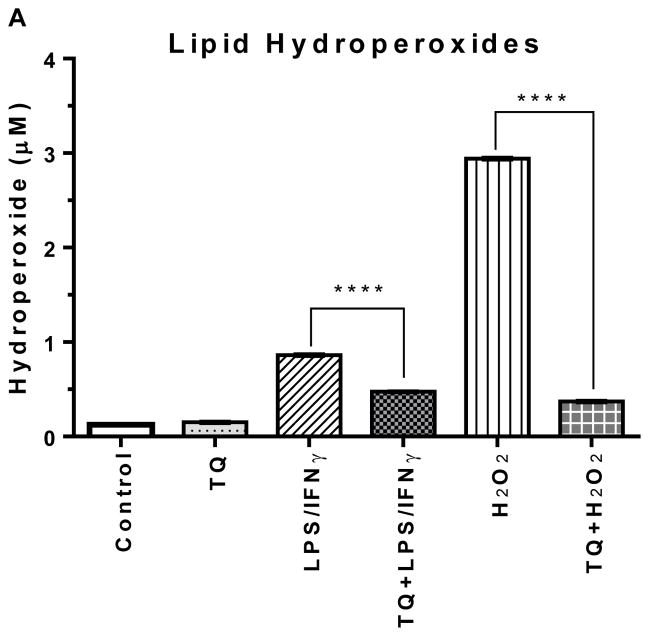
The lipid hydroperoxide levels in the LPS/IFNγ- and H2O2- activated BV-2 cells were elevated significantly higher (p<0.0001) than the control cells. TQ treatment of the LPS/IFNγ- and H2O2- activated cells very significantly lowered (p<0.0001) the levels of lipid hydroperoxides. There was no significant difference between the control and TQ only treated groups.
Glutathione
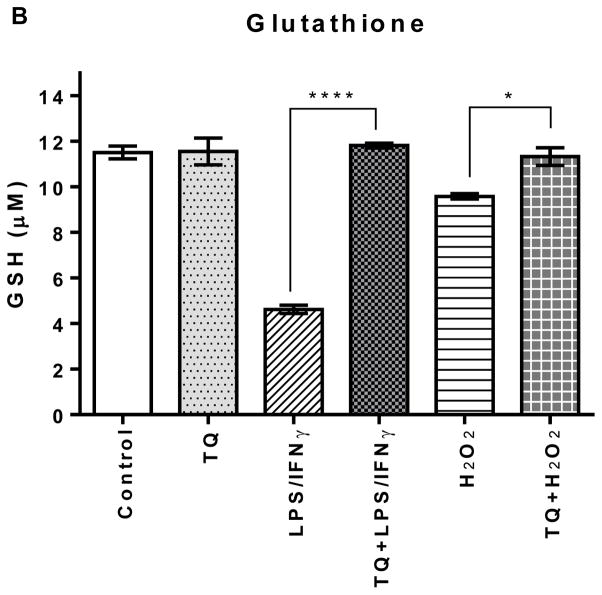
The glutathione (GSH) content in the LPS/IFNγ- and the H2O2-activated cells are significantly lower (p<0.0001 and p<0.05, respectfully) than the control group. TQ treatment restored the GSH to levels similar to the control. Additionally, there was no significant difference between the control and TQ only treated groups.
Thymoquinone-treated BV-2 Microglial Cells Have Decreased Superoxide Dismutase (SOD) and Catalase (CAT) Enzyme Activities
Superoxide Dismutase
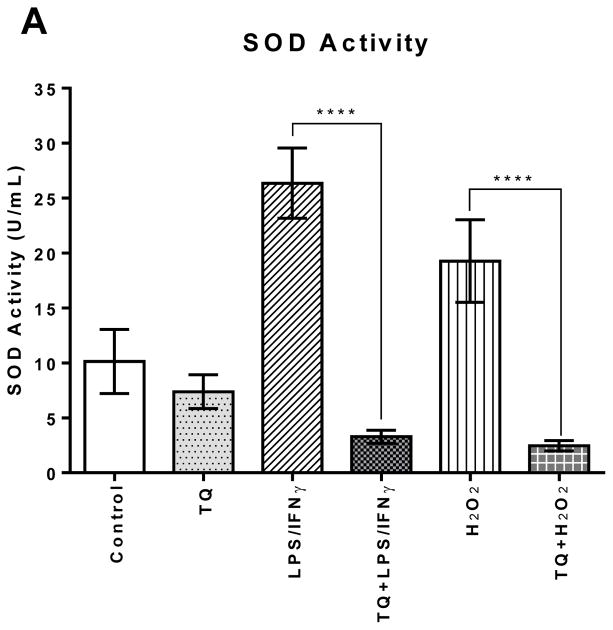
The SOD activity levels in the LPS/IFNγ-stimulated cells were statistically significantly (P≤0.0001) higher (250%) compared to the control cells. Likewise, the H2O2-stimulated cells showed statistically significantly higher SOD activity (200%) compared to the control cells. There was no significant difference amongst the control and all of the TQ-treated cells.
Catalase
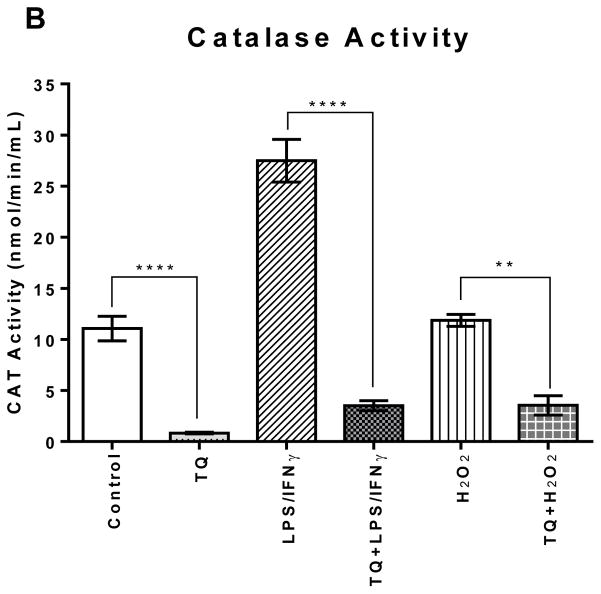
Treating the LPS/IFNγ- and H2O2-activated cells with TQ significantly reduced CAT activity (p<0.0001, p<0.01). TQ treatment also significantly reduced CAT activity in the control cells (p<0.0001). However, there was no significant difference amongst all the cells that were treated with TQ.
Thymoquinone Modulates the Expression of Specific Key Genes Related to Oxidative Stress in LPS-IFNγ-activated BV-2 Microglial Cells
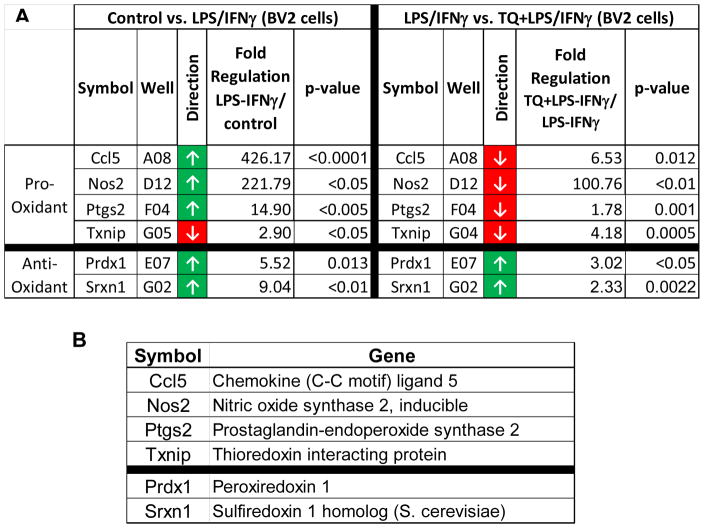
Activation of BV-2 microglial cells with LPS/IFNγ lead to significant upregulation of several key genes related to the observed oxidative stress. Chemokine (C-C) motif ligand 5 (Ccl5), nitric oxide synthase 2, inducible (Nos2), and Prostaglandin-endoperoxide synthase 2 (Ptgs2) are amongst the genes significantly upregulated at least 7-fold. These genes are directly related to increased inflammation and the resulting increase in oxidative stress in the cellular environment. TQ treatment the LPS/IFNγ-activated cells caused a significant down-regulation of those same genes, counteracting their pro-oxidant effects that result from LPS/IFNγ-activation of the microglial cells. There is also statistically significant upregulation of genes for Peroxiredoxin 1 (Prdx 1) and Sulfiredoxin 1 homolog (S. cerevisiae) (Sxrn1), which both are related to combating oxidative stress. TQ treatment also enhanced the upregulation of these genes related to antioxidant defense. Moreover, the downregulation the gene for the pro-oxidant Thioredoxin-interacting protein (Txnip) observed with LPS/IFNγ stimulation is further enhanced with TQ treatment.
Discussion
ND such as AD, involve the chronic progressive loss of number, structure, and function of neuronal cells, leading to generalized brain atrophy and profound cognitive deficit. They share many common characteristics in addition to the progressive neuronal loss, including changes in the number and morphology of microglia, elevated levels of pro-inflammatory cytokines, and oxidative stress [74]. Oxidative stress is a key hallmark AD that can be related to microglial activation [74, 75]. Microglial activation is an early sign that often precedes neuronal death [76, 77] and increasing evidence reports that sustained microglia activation is implicated in the chronic nature ND [78, 79]. TQ has been shown to have antioxidant properties [51, 80–82] and therefore we evaluated those properties on the BV-2 microglial cells.
In this study, we showed that TQ was effective in reducing the production of key ROS, superoxide (O2•−) and nitric oxide (NO), and the levels of the hydrogen peroxide (H2O2) in the activated BV-2 microglial cells. Exposing the BV-2 microglial cells to the combination of LPS (0.5 μg/mL) and IFNγ (0.5 ng/mL) for 24 h activated the cells and precipitated the pro-inflammatory response with increased ROS production. The LPS/IFNγ-activated microglial cells produced significantly higher levels of superoxide (2 fold) and nitric oxide (6 fold) compared to the control. However, TQ treatment of the LPS/IFNγ-activated cells significantly (P<0.0001) reduced the production of superoxide and nitric oxide by 4 fold and 6 fold, respectively. Likewise, the BV-2 microglial cells were also activated by direct oxidation via exposure to hydrogen peroxide (75 μM) for 24h. TQ treatment also significantly (P<0.0001) reduced the levels of superoxide production 3 fold and the hydrogen peroxide levels by 20% in the H2O2-activated BV-2 microglial cells. Excessive production of ROS from infiltrating immune cells is very toxic and damaging to cells, because ROS cause production of peroxynitrite (from the combination of superoxide and nitric oxide) and hydroxyl radical (from hydrogen peroxide), which are powerful mediators of brain injury in brain inflammation and can lead to lipid peroxidation [83–85]. Oxidative damage to the CNS predominantly manifests as lipid peroxidation (LPO) because of the high content of polyunsaturated fatty acids that are particularly susceptible to oxidation [86]. Furthermore, research suggests that lipid peroxidation is an important mechanism of neurodegeneration in AD brain [87, 88]. Research has also shown that such high levels of NO induce neuronal death by causing inhibition of mitochondrial cytochrome oxidase in neurons [89, 90]. Studies have shown that TQ functions as a superoxide radical anion and hydroxyl scavenger [51, 52, 91–94]. This is significant because superoxide and hydroxyl radical are particularly potent in producing destruction of the cell membrane via lipid peroxidation induction and causing oxidative damage to cell membranes [85, 95]. This study shows that TQ is also effective in reducing superoxide in the BV-2 microglia activated with LPS/INFγ and H2O2. TQ’s ability to reduce the levels of these specific ROS despite LPS/IFNγ or H2O2 microglial activation demonstrates that its antioxidant properties are effective also in the BV-2 microglia.
Levels of oxidative stress were assessed from the measuring the levels of lipid hydroperoxides and GSH present in the cell. Lipid peroxidation results in the formation of highly reactive and unstable hydroperoxides of both saturated and unsaturated lipids. Quantification of lipid peroxidation is essential to assess the cytotoxic oxidative damage to neurons particularly in neurodegeneration resulting from excess oxidative stress [88, 96–98]. In this study we showed that TQ treatment significantly reduced the levels of lipid hydroperoxides by 2-fold for the LPS/IFNγ-activated microglial cells and by 8 fold for the H2O2-activated microglial cells. This implies that TQ not only is effective in reducing the levels of ROS in the cellular environment but also reducing or preventing the damage caused by elevated oxidative stress. This is confirmed when the GSH levels are taken into account. Exposing the cells to LPS/IFNγ and H2O2 lowered the cellular concentration of GSH. Glutathione is the most abundant non-protein thiol tripeptide present in the central nervous system that acts as a major cellular antioxidant in neuronal and non-neuronal cells [99, 100]. GSH acts alone as well as in concert with enzymes within cells to reduce superoxide radicals, hydroxyl radicals, and peroxynitrites. formed during normal cellular metabolism and the preferred substrate for several enzymes in xenobiotic metabolism and antioxidant defense [99, 101–103]. GSH deficiency has been observed in aging and in a wide range of pathologies including ND. Additionally, studies show that intracellular GSH concentrations appear to play an important factor in regulating the susceptibility of the cell to NO and its derivatives [104]. GSH reacts with NO to form hydroxylamine and GSSG. If GSH levels are compromised due to oxidative stress conditions, neurons become particularly sensitive to NO and ONOO− [105]. TQ treatment increased the GSH levels in the activated microglia to help maintain lower levels of oxidative stress in the cells. There was no significant difference in GSH levels amongst the control and all the TQ treated cells, which reflect the lower NO, and superoxide levels in the TQ treated cells.
Further assessment of the effect of TQ on the LPS/IFNγ and H2O2-activated BV-2 cells showed that superoxide dismutase (SOD) and catalase (CAT) activities were reduced in comparison to the untreated. SOD catalyzes the dismutation of superoxide anion radical into molecular oxygen or hydrogen peroxide. Catalase catalyzes the decomposition of hydrogen peroxide into water and oxygen. The two enzymes work together to help reduce the levels of ROS and keep the cell at healthy levels of oxidative stress when superoxide and hydrogen peroxide are present at excessive levels. The SOD and CAT activities in the LPS/IFNγ-activated cells treated with TQ were 6 fold and 5 fold lower, respectively. And the SOD and CAT activities in the H2O2-activated cells treated with TQ were 5 fold and 3 fold lower, respectively. Although the TQ treated cells had lower antioxidant enzyme activities, the concentrations of reduced GSH are similar to controls indicating the oxidative stress levels are also similar. Therefore the lower antioxidant enzyme activities of the TQ-treated cells may be attributed to the ROS scavenging properties of TQ and not a detrimental decrease in the antioxidant enzyme activities. In this study, our results suggest that TQ imparts its antioxidant protection in the microglia cells as an ROS scavenger rather than the enhancement of antioxidant enzyme activity.
TQ’s antioxidant protection of the BV-2 microglia cells is further confirmed via RT2 PCR Profiling Array for genes related to oxidative stress. The LPS/IFNγ-activated microglial cells showed upregulation ≥ 7 fold of specific pro-oxidant genes: Chemokine (C-C) motif ligand 5 (Ccl5), nitric oxide synthase 2, inducible (Nos2), and Prostaglandin-endoperoxide synthase 2 (Ptgs2). These pro-oxidant genes code for proteins that are typically elevated during the inflammation. These proteins are also linked to oxidative stress through the inflammatory response. TQ treatment in the LPS/IFNγ-activated microglial cells significantly downregulated those same genes. Furthermore, the upregulation of antioxidant genes, Peroxiredoxin 1 (Prdx 1) and Sulfiredoxin 1 homolog (S. cerevisiae) (Sxrn1), in response to LPS/IFNγ activation as part of the cells’ antioxidant defense was enhanced with TQ treatment. These genes code for proteins that reduce alkyl hydroperoxides and over-oxidized cysteine residues under conditions of severe oxidative stress. Hence, the fact that TQ enhances that defense further demonstrates its powerful antioxidant properties.
Conclusions
In this study, TQ proves to be effective in reducing superoxide, nitric oxide, and hydrogen peroxide levels. TQ reduced oxidative damage via lowered lipid hydroperoxides as well as increase antioxidant GSH. Furthermore, the reduction in ROS and oxidative stress is evident by the lowered SOD and CAT activities and confirmed from the PCR Array profiling. Our studies indicate that TQ reduces microglia-derived oxidative stress and may prove to be useful in delaying the onset or attenuating the progression of microglia-derived neurodegeneration related to excessive oxidative stress in the CNS and heightened neuroinflammation. Because we know that excessive oxidative stress and neuroinflammation have shown to be key players in the development and progression of ND like AD, this study warrants further investigation of the efficacy of TQ in specialized AD models as a possible therapeutic agent.
FIGURE 1. Effect of thymoquinone on the viability of BV-2 cells.
Cell viability was evaluated using resazurin dye (7-hydroxy-3H-phenoxazin-3-one 10-oxide), 24 h after treatment. Values expressed as mean ± SEM. **** P ≤ 0.0001.
FIGURE 2.
FIGURE 2A | Effect of thymoquinone on the levels of superoxide, nitric oxide, and hydrogen peroxide in BV-2 cells stimulated with the combination of LPS (500 ng/mL) and IFNγ (0.5 ng/mL) (LPS/IFNγ) or H2O2 (75 μM) for 24 h. (A) The intracellular concentration of superoxide was measured using nitroblue tetrazolium (NBT) 24 h after treatment. Values expressed as mean ± SEM. ****P≤0.0001.
FIGURE 2B | Effect of thymoquinone on the levels of superoxide, nitric oxide, and hydrogen peroxide in BV-2 cells stimulated with the combination of LPS (500 ng/mL) and IFNγ (0.5 ng/mL) (LPS/IFNγ) or H2O2 (75 μM) for 24 h. (B) Nitric oxide production was measured using Griess reagent (1% sulfanilamide, 0.1% N - (1-naphthyl) - ethylenediamine hydrochloride in 5% phosphoric acid (H3PO4)) 24 h after treatment. Values expressed as mean ± SEM. ****P≤0.0001.
FIGURE 2C | Effect of thymoquinone on the levels of superoxide, nitric oxide, and hydrogen peroxide in BV-2 cells stimulated with the combination of LPS (500 ng/mL) and IFNγ (0.5 ng/mL) (LPS/IFNγ) or H2O2 (75 μM) for 24 h. (C) Hydrogen peroxide was measured using the highly sensitive and stable H2O2 probe ADHP (10-acetyl-3,7-dihydroxyphenoxazine) 24 h after treatment. Values expressed as mean ± SEM. *P≤0.05.
FIGURE 3.
FIGURE 3A | Effect of thymoquinone on lipid hydroperoxides and glutathione in stimulated BV-2 microglial cells. (A) Lipid hydroperoxides were measured in BV-2 microglial cells 24 h after treatment. Values expressed as mean ± SEM. ****P≤0.0001.
FIGURE 3B | Effect of thymoquinone on lipid hydroperoxides and glutathione in stimulated BV-2 microglial cells. (B) Glutathione was measured in BV-2 microglial cells 24 h after treatment. Values expressed as mean ± SEM. ****P≤0.0001; *P≤0.05.
FIGURE 4.
FIGURE 4A | Effect of thymoquinone on superoxide dismutase and catalase enzyme activities in stimulated BV-2 microglial cells. (A) SOD enzyme activity was measured in BV-2 microglial cells 24 h after treatment. Values expressed as mean ± SEM. ****P≤0.0001.
FIGURE 4B | Effect of thymoquinone on superoxide dismutase and catalase enzyme activities in stimulated BV-2 microglial cells. (B) Catalase enzyme activity was measured in BV-2 microglial cells 24 h after treatment. Values expressed as mean ± SEM. ****P≤0.0001; **P≤0.01.
FIGURE 5. Effect of thymoquinone on the expression of key genes related to oxidative stress in stimulated BV-2 microglial cells.
(A) The fold regulation change of Control vs LPS/IFNγ and LPS/IFNγ vs TQ+LPS/IFNγ. Values expressed as fold regulation. P values listed in the table. (B) Gene name for the symbol listed in the table.
Acknowledgments
This research was supported by the National Institute on Minority Health and Health Disparities of the National Institutes of Health through Grant Number G12 MD007582 and Grant Number P20 MD006738.
References
- 1.Kreutzberg GW. Microglia: a sensor for pathological events in the CNS. Trends in neurosciences. 1996;19(8):312–318. doi: 10.1016/0166-2236(96)10049-7. [DOI] [PubMed] [Google Scholar]
- 2.Gao HM, Liu B, Hong JS. Critical role for microglial NADPH oxidase in rotenone-induced degeneration of dopaminergic neurons. The Journal of neuroscience: the official journal of the Society for Neuroscience. 2003;23(15):6181–6187. doi: 10.1523/JNEUROSCI.23-15-06181.2003. [DOI] [PMC free article] [PubMed] [Google Scholar]
- 3.Gonzalez-Scarano F, Baltuch G. Microglia as mediators of inflammatory and degenerative diseases. Annual review of neuroscience. 1999;22:219–240. doi: 10.1146/annurev.neuro.22.1.219. [DOI] [PubMed] [Google Scholar]
- 4.Block ML, Zecca L, Hong JS. Microglia-mediated neurotoxicity: uncovering the molecular mechanisms. Nature reviews Neuroscience. 2007;8(1):57–69. doi: 10.1038/nrn2038. [DOI] [PubMed] [Google Scholar]
- 5.Schwab JM, Schluesener HJ. Microglia rules: Insights into microglial-neuronal signaling. Cell death and differentiation. 2004;11(12):1245–1246. doi: 10.1038/sj.cdd.4401487. [DOI] [PubMed] [Google Scholar]
- 6.Zhang L, Wu C, Zhao S, Yuan D, Lian G, Wang X, Wang L, Yang J. Demethoxycurcumin, a natural derivative of curcumin attenuates LPS-induced pro-inflammatory responses through down-regulation of intracellular ROS-related MAPK/NF-kappaB signaling pathways in N9 microglia induced by lipopolysaccharide. International immunopharmacology. 2010;10(3):331–338. doi: 10.1016/j.intimp.2009.12.004. [DOI] [PubMed] [Google Scholar]
- 7.del Rio-Hortega P. Microglia. New York: Hoeber; 1932. [Google Scholar]
- 8.Nimmerjahn A, Kirchhoff F, Helmchen F. Resting microglial cells are highly dynamic surveillants of brain parenchyma in vivo. Science. 2005;308(5726):1314–1318. doi: 10.1126/science.1110647. [DOI] [PubMed] [Google Scholar]
- 9.Davalos D, Grutzendler J, Yang G, Kim JV, Zuo Y, Jung S, Littman DR, Dustin ML, Gan WB. ATP mediates rapid microglial response to local brain injury in vivo. Nature neuroscience. 2005;8(6):752–758. doi: 10.1038/nn1472. [DOI] [PubMed] [Google Scholar]
- 10.Solito E, Sastre M. Microgllia function in Alzheimer’s disease. Frontiers in pharmacology. 2012;3(14) doi: 10.3389/fphar.2012.00014. [DOI] [PMC free article] [PubMed] [Google Scholar]
- 11.Lefkowitz DL, Lefkowitz SS. Microglia and myeloperoxidase: a deadly partnership in neurodegenerative disease. Free radical biology & medicine. 2008;45(5):726–731. doi: 10.1016/j.freeradbiomed.2008.05.021. [DOI] [PubMed] [Google Scholar]
- 12.Nam KN, Son MS, Park JH, Lee EH. Shikonins attenuate microglial inflammatory responses by inhibition of ERK, Akt, and NF-kappaB: neuroprotective implications. Neuropharmacology. 2008;55(5):819–825. doi: 10.1016/j.neuropharm.2008.06.065. [DOI] [PubMed] [Google Scholar]
- 13.Ransohoff RM, Perry VH. Microglial physiology: unique stimuli, specialized responses. Annual Review of Immunology. 2009;27:119–145. doi: 10.1146/annurev.immunol.021908.132528. [DOI] [PubMed] [Google Scholar]
- 14.Zhang F, Liu J, Shi JS. Anti-inflammatory activities of resveratrol in the brain: role of resveratrol in microglial activation. Eur J Pharmacol. 2010;636(1–3):1–7. doi: 10.1016/j.ejphar.2010.03.043. [DOI] [PubMed] [Google Scholar]
- 15.Gonsette RE. Neurodegeneration in multiple sclerosis: the role of oxidative stress and excitotoxicity. Journal of the neurological sciences. 2008;274(1–2):48–53. doi: 10.1016/j.jns.2008.06.029. [DOI] [PubMed] [Google Scholar]
- 16.McGeer PL, McGeer EG. Glial reactions in Parkinson’s disease. Movement disorders: official journal of the Movement Disorder Society. 2008;23(4):474–483. doi: 10.1002/mds.21751. [DOI] [PubMed] [Google Scholar]
- 17.McGeer PL, McGeer EG. Inflammation and neurodegeneration in Parkinson’s disease. Parkinsonism Relat Disord. 2004;10(Suppl 1):S3–7. doi: 10.1016/j.parkreldis.2004.01.005. [DOI] [PubMed] [Google Scholar]
- 18.McGeer PL, McGeer EG. Inflammation and the degenerative diseases of aging. Annals of the New York Academy of Sciences. 2004;1035:104–116. doi: 10.1196/annals.1332.007. [DOI] [PubMed] [Google Scholar]
- 19.Wyss-Coray T, Mucke L. Inflammation in neurodegenerative disease--a double-edged sword. Neuron. 2002;35(3):419–432. doi: 10.1016/s0896-6273(02)00794-8. [DOI] [PubMed] [Google Scholar]
- 20.Lehnardt S. Innate immunity and neuroinflammation in the CNS: the role of microglia in Toll-like receptor-mediated neuronal injury. Glia. 2010;58:253–263. doi: 10.1002/glia.20928. [DOI] [PubMed] [Google Scholar]
- 21.Bianca VD, Dusi S, Bianchini E, Dal Pra I, Rossi F. Beta-amyloid activates the O-2 forming NADPH oxidase in microglia, monocytes, and neutrophils. A possible inflammatory mechanism of neuronal damage in Alzheimer’s disease. The Journal of biological chemistry. 1999;274(22):15493–15499. doi: 10.1074/jbc.274.22.15493. [DOI] [PubMed] [Google Scholar]
- 22.Sriram K, Matheson JM, Benkovic SA, Miller DB, Luster MI, O’Callaghan JP. Deficiency of TNF receptors suppresses microglial activation and alters the susceptibility of brain regions to MPTP-induced neurotoxicity: role of TNF-alpha. FASEB journal: official publication of the Federation of American Societies for Experimental Biology. 2006;20(6):670–682. doi: 10.1096/fj.05-5106com. [DOI] [PubMed] [Google Scholar]
- 23.Sriram K, Matheson JM, Benkovic SA, Miller DB, Luster MI, O’Callaghan JP. Mice deficient in TNF receptors are protected against dopaminergic neurotoxicity: Implications for Parkinson’s disease. The FASEB Journal. 2002;16(11):1474–1476. doi: 10.1096/fj.02-0216fje. [DOI] [PubMed] [Google Scholar]
- 24.Qian L, Xu Z, Zhang W, Wilson B, Hong JS, Flood PM. Sinomenine, a natural dextrorotatory morphinan analog, is anti-inflammatory and neuroprotective through inhibition of microglial NADPH oxidase. Journal of neuroinflammation. 2007;4:23. doi: 10.1186/1742-2094-4-23. [DOI] [PMC free article] [PubMed] [Google Scholar]
- 25.Rojo LE, Fernandez JA, Maccioni AA, Jimenez JM, Maccioni RB. Neuroinflammation: implications for the pathogenesis and molecular diagnosis of Alzheimer’s disease. Archives of medical research. 2008;39(1):1–16. doi: 10.1016/j.arcmed.2007.10.001. [DOI] [PubMed] [Google Scholar]
- 26.Sheng JG, Bora SH, Xu G, Borchelt DR, Price DL, Koliatsos VE. Lipopolysaccharide-induced-neuroinflammation increases intracellular accumulation of amyloid precursor protein and amyloid beta peptide in APPswe transgenic mice. Neurobiology of disease. 2003;14(1):133–145. doi: 10.1016/s0969-9961(03)00069-x. [DOI] [PubMed] [Google Scholar]
- 27.Streit WJ, Mrak RE, Griffin WS. Microglia and neuroinflammation: a pathological perspective. Journal of neuroinflammation. 2004;1(1):14. doi: 10.1186/1742-2094-1-14. [DOI] [PMC free article] [PubMed] [Google Scholar]
- 28.Akiyama H, Barger S, Barnum S, Bradt B, Bauer J, Cole GM, Cooper NR, Eikelenboom P, Emmerling M, Fiebich BL, et al. Inflammation and Alzheimer’s disease. Neurobiology of aging. 2000;21(3):383–421. doi: 10.1016/s0197-4580(00)00124-x. [DOI] [PMC free article] [PubMed] [Google Scholar]
- 29.Bamberger ME, Harris ME, McDonald DR, Husemann J, Landreth GE. A cell surface receptor complex for fibrillar beta-amyloid mediates microglial action. The Journal of Neuroscience. 2003;23(7):2665–2674. doi: 10.1523/JNEUROSCI.23-07-02665.2003. [DOI] [PMC free article] [PubMed] [Google Scholar]
- 30.Bozic I, Savic D, Stevanovic I, Pekovic S, Nedeljkovic N, Lavrnja I. Benfotiamine upregulates antioxidative system in activated BV-2 microglia cells. Front Cell Neurosci. 2015;9:351. doi: 10.3389/fncel.2015.00351. [DOI] [PMC free article] [PubMed] [Google Scholar]
- 31.Gali-Muhtasib H, Roessner A, Schneider-Stock R. Thymoquinone: a promising anti-cancer drug from natural sources. The international journal of biochemistry & cell biology. 2006;38(8):1249–1253. doi: 10.1016/j.biocel.2005.10.009. [DOI] [PubMed] [Google Scholar]
- 32.Dattner AM. From medical herbalism to phytotherapy in dermatology: back to the future. Dermatoligic Therapy. 2003;16(2):106–113. doi: 10.1046/j.1529-8019.2003.01618.x. [DOI] [PubMed] [Google Scholar]
- 33.Fong HH. Integration of herbal medicine into modern medical practices: issues and prospects. Integrative cancer therapies. 2002;1(3):287–293. doi: 10.1177/153473540200100313. [DOI] [PubMed] [Google Scholar]
- 34.Alemi M, Sabouni F, Sanjarian F, Haghbeen K, Ansari S. Anti-inflammatory effect of seeds and callus of Nigella sativa L. extracts on mix glial cells with regard to their thymoquinone content. AAPS Pharm Sci Tech. 2013;14(1):160–167. doi: 10.1208/s12249-012-9899-8. [DOI] [PMC free article] [PubMed] [Google Scholar]
- 35.El-Dakhakhny M, Madi NJ, Lembert N, Ammon HPT. Nigella sativa oil, nigellone and derived thymoquinone inhibit synthesis of 5-lipooxygenase products in polymorphonuclear leukocytes from rats. Journal of ethnopharmacology. 2002;81(2):161–164. doi: 10.1016/s0378-8741(02)00051-x. [DOI] [PubMed] [Google Scholar]
- 36.Velho-Pereira RM, Barhate CR, Kulkarni SR, Jagtap AG. Validated high-performance thin-layer chromatographic method for the quantification of thymoquinone in Nigella Sativa extracts and formulations. Phytochemical Analysis: PCA. 2011;22(4):367–373. doi: 10.1002/pca.1289. [DOI] [PubMed] [Google Scholar]
- 37.Woo CC, Kumar AP, Sethi G, Tan KH. Thymoquinone: potential cure for inflammatory disorders and cancer. Biochemical pharmacology. 2012;83(4):443–451. doi: 10.1016/j.bcp.2011.09.029. [DOI] [PubMed] [Google Scholar]
- 38.Tekeoglu I, Dogan A, Demiralp L. Effects of thymoquinone (volatile oil of black cumin) on rheumatoid arthritis in rat models. Phytotherapy research: PTR. 2006;20(10):869–871. doi: 10.1002/ptr.1964. [DOI] [PubMed] [Google Scholar]
- 39.Gharby S, Harhar H, Guillaume D, Roudani A, Boulbaroud S, Ibrahimi M, Ahmad M, Sultana S, Hadda TB, Chafchaouni-Moussaoui I, et al. Chemical Investigation of Nigella sativa L. seed oil produced in Morocco. Journal of the Saudi Society of Agricultural Sciences. 2014 [Google Scholar]
- 40.Wajs A, Bonikowski R, Kalemba D. Composition of essential oil from seeds of Nigella sativa L. cultivated in Poland. Flavour and Fragrance Journal. 2008;23:126–132. [Google Scholar]
- 41.Schleicher P, Saleh M. Black seed cumin: the magical Egyptian herb for allergies, asthma, and immune disorders. Rochester, Vermont: Healing Arts Press; 1998. [Google Scholar]
- 42.Ali BH, Blunden G. Pharmacological and toxicological properties of Nigella sativa. Phytotherapy research: PTR. 2003;17(4):299–305. doi: 10.1002/ptr.1309. [DOI] [PubMed] [Google Scholar]
- 43.Sethi G, Ahn KS, Aggarwal BB. Targeting nuclear factor-kappa B activation pathway by thymoquinone: role in suppression of antiapoptotic gene products and enhancement of apoptosis. Molecular cancer research: MCR. 2008;6(6):1059–1070. doi: 10.1158/1541-7786.MCR-07-2088. [DOI] [PubMed] [Google Scholar]
- 44.El-Mahmoudy A, Matsuyama H, Borgan MA, Shimizu Y, El-Sayed MG, Minamoto N, Takewaki T. Thymoquinone suppresses expression of inducible nitric oxide synthase in rat macrophages. International immunopharmacology. 2002;2(11):1603–1611. doi: 10.1016/s1567-5769(02)00139-x. [DOI] [PubMed] [Google Scholar]
- 45.Al-Saleh IA, Billedo G, El-Doush II. Levels of selenium, dl-α-tocopherol, dl-γ-tocopherol, all-trans-retinol, thymoquinone and thymol in different brands of Nigella sativa seeds. Journal of Food Composition and Analysis. 2006;19(2–3):167–175. [Google Scholar]
- 46.Radad K, Moldzio R, Taha M, Rausch WD. Thymoquinone protects dopaminergic neurons against MPP+ and rotenone. Phytotherapy research: PTR. 2009;23(5):696–700. doi: 10.1002/ptr.2708. [DOI] [PubMed] [Google Scholar]
- 47.El-Agamy DS, Nader MA. Attenuation of oxidative stress-induced vascular endothelial dysfunction by thymoquinone. Experimental biology and medicine. 2012;237(9):1032–1038. doi: 10.1258/ebm.2012.012107. [DOI] [PubMed] [Google Scholar]
- 48.Hosseinzadeh H, Parvardeh S. Anticonvulsant effects of thymoquinone, the major constituent of Nigella sativa seeds, in mice. Phytomedicine: international journal of phytotherapy and phytopharmacology. 2004;11(1):56–64. doi: 10.1078/0944-7113-00376. [DOI] [PubMed] [Google Scholar]
- 49.Al-Ali A, Alkhawajah AA, Randhawa MA, Shaikh NA. Oral and intraperitoneal LD50 of thymoquinone, an active principle of Nigella sativa, in mice and rats. Journal of Ayub Medical College, Abbottabad: JAMC. 2008;20(2):25–27. [PubMed] [Google Scholar]
- 50.Lutterodt H, Luther M, Slavin M, Yin J-J, Parry J, Gao J-M, Yu L. Fatty acid profile, thymoquinone content, oxidative stability, and antioxidant properties of cold-pressed black cumin seed oils. LWT - Food Science and Technology. 2010;43(9):1409–1413. [Google Scholar]
- 51.Badary OA, Taha RA, Gamal el-Din AM, Abdel-Wahab MH. Thymoquinone is a potent superoxide anion scavenger. Drug and chemical toxicology. 2003;26(2):87–98. doi: 10.1081/dct-120020404. [DOI] [PubMed] [Google Scholar]
- 52.Mansour MA, Nagi MN, El-Khatib AS, Al-Bekairi AM. Effects of thymoquinone on antioxidant enzyme activities, lipid peroxidation and DT-diaphorase in different tissues of mice: a possible mechanism of action. Cell Biochem Funct. 2002;20(2):143–151. doi: 10.1002/cbf.968. [DOI] [PubMed] [Google Scholar]
- 53.Padhye S, Banerjee S, Ahmad A, Mohammad R, Sarkar FH. From here to eternity - the secret of Pharohs: Therapeutc potential of black cumin seeds and beyond. Cancer Therapy. 2008;6:4895–4510. [PMC free article] [PubMed] [Google Scholar]
- 54.Salem ML. Immunomodulatory and therapeutic properties of the Nigella sativa L. seed. International immunopharmacology. 2005;5(13–14):1749–1770. doi: 10.1016/j.intimp.2005.06.008. [DOI] [PubMed] [Google Scholar]
- 55.Khan A, Vaibhav K, Javed H, Khan MM, Tabassum R, Ahmed ME, Srivastava P, Khuwaja G, Islam F, Siddiqui MS, et al. Attenuation of Abeta-induced neurotoxicity by thymoquinone via inhibition of mitochondrial dysfunction and oxidative stress. Molecular and cellular biochemistry. 2012;369(1–2):55–65. doi: 10.1007/s11010-012-1368-x. [DOI] [PubMed] [Google Scholar]
- 56.Mousavi SH, Tayarani-Najaran Z, Asghari M, Sadeghnia HR. Protective effect of Nigella sativa extract and thymoquinone on serum/glucose deprivation-induced PC12 cells death. Cellular and molecular neurobiology. 2010;30(4):591–598. doi: 10.1007/s10571-009-9484-1. [DOI] [PMC free article] [PubMed] [Google Scholar]
- 57.Hosseinzadeh H, Parvardeh S, Asl MN, Sadeghnia HR, Ziaee T. Effect of thymoquinone and Nigella sativa seeds oil on lipid peroxidation level during global cerebral ischemia-reperfusion injury in rat hippocampus. Phytomedicine: international journal of phytotherapy and phytopharmacology. 2007;14(9):621–627. doi: 10.1016/j.phymed.2006.12.005. [DOI] [PubMed] [Google Scholar]
- 58.El Gazzar MA, El Mezayen R, Nicolls MR, Dreskin SC. Thymoquinone attenuates proinflammatory responses in lipopolysaccharide-activated mast cells by modulating NF-kappaB nuclear transactivation. Biochimica et biophysica acta. 2007;1770(4):556–564. doi: 10.1016/j.bbagen.2007.01.002. [DOI] [PubMed] [Google Scholar]
- 59.Umar S, Zargan J, Umar K, Ahmad S, Katiyar CK, Khan HA. Modulation of the oxidative stress and inflammatory cytokine response by thymoquinone in the collagen induced arthritis in Wistar rats. Chemico-biological interactions. 2012;197(1):40–46. doi: 10.1016/j.cbi.2012.03.003. [DOI] [PubMed] [Google Scholar]
- 60.Kanter M. Nigella sativa and derived thymoquinone prevents hippocampal neurodegeneration after chronic toluene exposure in rats. Neurochemical research. 2008;33(3):579–588. doi: 10.1007/s11064-007-9481-z. [DOI] [PubMed] [Google Scholar]
- 61.Kanter M. Protective effects of Nigella sativa on the neuronal injury in frontal cortex and brain stem after chronic toluene exposure. Neurochemical research. 2008;33(11):2241–2249. doi: 10.1007/s11064-008-9702-0. [DOI] [PubMed] [Google Scholar]
- 62.Kanter M. Effects of Nigella sativa and its major constituent, thymoquinone on sciatic nerves in experimental diabetic neuropathy. Neurochemical research. 2008;33(1):87–96. doi: 10.1007/s11064-007-9419-5. [DOI] [PubMed] [Google Scholar]
- 63.Kanter M. Protective effects of thymoquinone on streptozotocin-induced diabetic nephropathy. Journal of molecular histology. 2009;40(2):107–115. doi: 10.1007/s10735-009-9220-7. [DOI] [PubMed] [Google Scholar]
- 64.Wright AL, Zinn R, Hohensinn B, Konen LM, Beynon SB, Tan RP, Clark IA, Abdipranoto A, Vissel B. Neuroinflammation and neuronal loss precede Abeta plaque deposition in the hAPP-J20 mouse model of Alzheimer’s disease. PloS one. 2013;8(4):e59586. doi: 10.1371/journal.pone.0059586. [DOI] [PMC free article] [PubMed] [Google Scholar]
- 65.Fan LY, Chiu MJ. Combotherapy and current concepts as well as future strategies for the treatment of Alzheimer’s disease. Neuropsychiatric Disease and Treatment. 2014;10:439–451. doi: 10.2147/NDT.S45143. [DOI] [PMC free article] [PubMed] [Google Scholar]
- 66.Dhawan G, Combs CK. Inhibition of Src kinase activity attenuates amyloid associated microgliosis in a murine model of Alzheimer’s disease. Journal of neuroinflammation. 2012;9:117. doi: 10.1186/1742-2094-9-117. [DOI] [PMC free article] [PubMed] [Google Scholar]
- 67.Breitner JC, Baker LD, Montine TJ, Meinert CL, Lyketsos CG, Ashe KH, Brandt J, Craft S, Evans DE, Green RC, et al. Extended results of the Alzheimer’s disease anti-inflammatory prevention trial. Alzheimer’s & dementia. 2011;7(4):402–411. doi: 10.1016/j.jalz.2010.12.014. [DOI] [PMC free article] [PubMed] [Google Scholar]
- 68.Wyss-Coray T. Inflammation in Alzheimer disease: driving force, bystander or beneficial response? Nature medicine. 2006;12(9):1005–1015. doi: 10.1038/nm1484. [DOI] [PubMed] [Google Scholar]
- 69.Rivest S. Regulation of innate immune responses in the brain. Nature Reviews Immunology. 2009;9(6):429–439. doi: 10.1038/nri2565. [DOI] [PubMed] [Google Scholar]
- 70.Mandrekar-Colucci S, Landreth GE. Microglia and Inflammation in Alzheimer’s disease. CNS & Neurological Disorders Drug Targets. 2010;9(2):156–167. doi: 10.2174/187152710791012071. [DOI] [PMC free article] [PubMed] [Google Scholar]
- 71.Song M, Jin J, Lim JE, Kou J, Pattanayak A, Rehman JA, Kim HD, Tahara K, Lalonde R, Fukuchi K. TLR4 mutation reduces microglial activation, increases Abeta deposits and exacerbates cognitive deficits in a mouse model of Alzheimer’s disease. Journal of neuroinflammation. 2011;8:92. doi: 10.1186/1742-2094-8-92. [DOI] [PMC free article] [PubMed] [Google Scholar]
- 72.Blasi E, Barluzzi R, Bocchini V, Mazzolla R, Bistoni F. Immortalization of murine microglial cells by a v-raf/v-myc carrying retrovirus. Journal of Neuroimmunology. 1990;27(2–3):229–237. doi: 10.1016/0165-5728(90)90073-v. [DOI] [PubMed] [Google Scholar]
- 73.Choi HS, Kim JW, Cha YN, Kim C. A quantitative nitroblue tetrazolium assay for determining intracellular superoxide anion production in phagocytic cells. J Immunoassay Immunochem. 2006;27(1):31–44. doi: 10.1080/15321810500403722. [DOI] [PubMed] [Google Scholar]
- 74.Dumont M, Beal MF. Neuroprotective strategies involving ROS in Alzheimer disease. Free Radic Biol Med. 2011;51(5):1014–1026. doi: 10.1016/j.freeradbiomed.2010.11.026. [DOI] [PMC free article] [PubMed] [Google Scholar]
- 75.El Khoury J, Luster AD. Mechanisms of microglia accumulation in Alzheimer’s disease: therapeutic implications. Trends Pharmacol Sci. 2008;29(12):626–632. doi: 10.1016/j.tips.2008.08.004. [DOI] [PubMed] [Google Scholar]
- 76.Minghetti L, Ajmone-Cat MA, De Berardinis MA, De Simone R. Microglial activation in chronic neurodegenerative diseases: roles of apoptotic neurons and chronic stimulation. Brain Res Brain Res Rev. 2005;48(2):251–256. doi: 10.1016/j.brainresrev.2004.12.015. [DOI] [PubMed] [Google Scholar]
- 77.Wilkinson K, El Khoury J. Microglial scavenger receptors and their roles in the pathogenesis of Alzheimer’s disease. Int J Alzheimers Dis. 2012;2012:489456. doi: 10.1155/2012/489456. [DOI] [PMC free article] [PubMed] [Google Scholar]
- 78.Lull ME, Block ML. Microglial activation and chronic neurodegeneration. Neurotherapeutics. 2010;7(4):354–365. doi: 10.1016/j.nurt.2010.05.014. [DOI] [PMC free article] [PubMed] [Google Scholar]
- 79.Rodríguez JJ, Verkhratsky A. Neuroglial roots of neurodegenerative diseases? Mol Neurobiol. 2011;43(2):87–96. doi: 10.1007/s12035-010-8157-x. [DOI] [PubMed] [Google Scholar]
- 80.Al-Johar D, Shinwari N, Arif J, Al-Sanea N, Jabbar AA, El-Sayed R, Mashhour A, Billedo G, El-Doush I, Al-Saleh I. Role of Nigella sativa and a number of its antioxidant constituents towards azoxymethane-induced genotoxic effects and colon cancer in rats. Phytother Res. 2008;22(10):1311–1323. doi: 10.1002/ptr.2487. [DOI] [PubMed] [Google Scholar]
- 81.Inci M, Davarci M, Motor S, Yalcinkaya FR, Nacar E, Aydin M, Sefil NK, Zararsiz I. Anti-inflammatory and antioxidant activity of thymoquinone in a rat model of acute bacterial prostatitis. Hum Exp Toxicol. 2013;32(4):354–361. doi: 10.1177/0960327112455068. [DOI] [PubMed] [Google Scholar]
- 82.Ismail M, Al-Naqeep G, Chan KW. Nigella sativa thymoquinone-rich fraction greatly improves plasma antioxidant capacity and expression of antioxidant genes in hypercholesterolemic rats. Free Radic Biol Med. 2010;48(5):664–672. doi: 10.1016/j.freeradbiomed.2009.12.002. [DOI] [PubMed] [Google Scholar]
- 83.Halliwell B. Oxidative stress and neurodegeneration: where are we now? J Neurochem. 2006;97(6):1634–1658. doi: 10.1111/j.1471-4159.2006.03907.x. [DOI] [PubMed] [Google Scholar]
- 84.Sumimoto H, Miyano K, Takeya R. Molecular composition and regulation of the Nox family NAD(P)H oxidases. Biochem Biophys Res Commun. 2005;338(1):677–686. doi: 10.1016/j.bbrc.2005.08.210. [DOI] [PubMed] [Google Scholar]
- 85.Bromont C, Marie C, Bralet J. Increased lipid peroxidation in vulnerable brain regions after transient forebrain ischemia in rats. Stroke. 1989;20(7):918–924. doi: 10.1161/01.str.20.7.918. [DOI] [PubMed] [Google Scholar]
- 86.Praticò D, Uryu K, Leight S, Trojanoswki JQ, Lee VM. Increased lipid peroxidation precedes amyloid plaque formation in an animal model of Alzheimer amyloidosis. J Neurosci. 2001;21(12):4183–4187. doi: 10.1523/JNEUROSCI.21-12-04183.2001. [DOI] [PMC free article] [PubMed] [Google Scholar]
- 87.Markesbery WR. Oxidative stress hypothesis in Alzheimer’s disease. Free Radic Biol Med. 1997;23(1):134–147. doi: 10.1016/s0891-5849(96)00629-6. [DOI] [PubMed] [Google Scholar]
- 88.Markesbery WR, Kryscio RJ, Lovell MA, Morrow JD. Lipid peroxidation is an early event in the brain in amnestic mild cognitive impairment. Ann Neurol. 2005;58(5):730–735. doi: 10.1002/ana.20629. [DOI] [PubMed] [Google Scholar]
- 89.Bal-Price A, Brown GC. Inflammatory neurodegeneration mediated by nitric oxide from activated glia-inhibiting neuronal respiration, causing glutamate release and excitotoxicity. J Neurosci. 2001;21(17):6480–6491. doi: 10.1523/JNEUROSCI.21-17-06480.2001. [DOI] [PMC free article] [PubMed] [Google Scholar]
- 90.Brown GC, Cooper CE. Nanomolar concentrations of nitric oxide reversibly inhibit synaptosomal respiration by competing with oxygen at cytochrome oxidase. FEBS Lett. 1994;356(2–3):295–298. doi: 10.1016/0014-5793(94)01290-3. [DOI] [PubMed] [Google Scholar]
- 91.Nagi MN, Mansour MA. Protective effect of thymoquinone against doxorubicin-induced cardiotoxicity in rats: a possible mechanism of protection. Pharmacol Res. 2000;41(3):283–289. doi: 10.1006/phrs.1999.0585. [DOI] [PubMed] [Google Scholar]
- 92.Kruk I, Michalska T, Lichszteld K, Kładna A, Aboul-Enein HY. The effect of thymol and its derivatives on reactions generating reactive oxygen species. Chemosphere. 2000;41(7):1059–1064. doi: 10.1016/s0045-6535(99)00454-3. [DOI] [PubMed] [Google Scholar]
- 93.Mollazadeh H, Hosseinzadeh H. The protective effect of Nigella sativa against liver injury: a review. Iran J Basic Med Sci. 2014;17(12):958–966. [PMC free article] [PubMed] [Google Scholar]
- 94.Padhye S, Banerjee S, Ahmad A, Mohammad R, Sarkar FH. From here to eternity - the secret of Pharaohs: Therapeutic potential of black cumin seeds and beyond. Cancer Ther. 2008;6(b):495–510. [PMC free article] [PubMed] [Google Scholar]
- 95.Mimnaugh EG, Trush MA, Bhatnagar M, Gram TE. Enhancement of reactive oxygen-dependent mitochondrial membrane lipid peroxidation by the anticancer drug adriamycin. Biochem Pharmacol. 1985;34(6):847–856. doi: 10.1016/0006-2952(85)90766-x. [DOI] [PubMed] [Google Scholar]
- 96.Sultana R, Perluigi M, Allan Butterfield D. Lipid peroxidation triggers neurodegeneration: A redox proteomics view into the Alzheimer disease brain. Free Radical Biology and Medicine. 2013;62:157–169. doi: 10.1016/j.freeradbiomed.2012.09.027. [DOI] [PMC free article] [PubMed] [Google Scholar]
- 97.Butterfield DA, Castegna A, Lauderback CM, Drake J. Evidence that amyloid beta-peptide-induced lipid peroxidation and its sequelae in Alzheimer’s disease brain contribute to neuronal death. Neurobiol Aging. 2002;23(5):655–664. doi: 10.1016/s0197-4580(01)00340-2. [DOI] [PubMed] [Google Scholar]
- 98.Butterfield DA, Lauderback CM. Lipid peroxidation and protein oxidation in Alzheimer’s disease brain: potential causes and consequences involving amyloid β-peptide-associated free radical oxidative stress1,2. Free Radical Biology and Medicine. 2002;32(11):1050–1060. doi: 10.1016/s0891-5849(02)00794-3. [DOI] [PubMed] [Google Scholar]
- 99.Chinta SJ, Rajagopalan S, Butterfield DA, Andersen JK. In vitro and in vivo neuroprotection by gamma-glutamylcysteine ethyl ester against MPTP: relevance to the role of glutathione in Parkinson’s disease. Neurosci Lett. 2006;402(1–2):137–141. doi: 10.1016/j.neulet.2006.03.056. [DOI] [PubMed] [Google Scholar]
- 100.Meister A, Anderson ME. Glutathione. Annu Rev Biochem. 1983;52:711–760. doi: 10.1146/annurev.bi.52.070183.003431. [DOI] [PubMed] [Google Scholar]
- 101.Smeyne M, Smeyne RJ. Glutathione metabolism and Parkinson’s disease. Free Radic Biol Med. 2013;62:13–25. doi: 10.1016/j.freeradbiomed.2013.05.001. [DOI] [PMC free article] [PubMed] [Google Scholar]
- 102.Cacciatore I, Cornacchia C, Pinnen F, Mollica A, Di Stefano A. Prodrug approach for increasing cellular glutathione levels. Molecules. 2010;15(3):1242–1264. doi: 10.3390/molecules15031242. [DOI] [PMC free article] [PubMed] [Google Scholar]
- 103.Fang YZ, Yang S, Wu G. Free radicals, antioxidants, and nutrition. Nutrition. 2002;18(10):872–879. doi: 10.1016/s0899-9007(02)00916-4. [DOI] [PubMed] [Google Scholar]
- 104.Butterfield DA, Pocernich CB, Drake J. Elevated Glutathione as a Therapeutic Strategy in Alzheimer’s Disease. Drug Development Research. 2002;56(3):428–437. [Google Scholar]
- 105.Barker JE, Bolaños JP, Land JM, Clark JB, Heales SJ. Glutathione protects astrocytes from peroxynitrite-mediated mitochondrial damage: implications for neuronal/astrocytic trafficking and neurodegeneration. Dev Neurosci. 1996;18(5–6):391–396. doi: 10.1159/000111432. [DOI] [PubMed] [Google Scholar]


