

Abstract
Trypanosoma cruzi is the causative agent of chronic chagasic cardiomyopathy. Why macrophages (mφs), the early responders to infection, fail to achieve parasite clearance is not known. Mouse (RAW 264.7) and human (THP-1 and primary) mφs were infected for 3 h and 18 h with T. cruzi TcI isolates, SylvioX10/4 (SYL, virulent) and TCC (nonpathogenic), which represent mφ stimulation and infection states, respectively. Mφs incubated with lipopolysaccharide and gamma interferon (LPS/IFN-γ) and with interleukin-4 (IL-4) were used as controls. We monitored the cytokine profile (using enzyme-linked immunosorbent assay [ELISA]), reactive oxygen species (ROS; fluorescent probes), nitric oxide (·NO; Griess assay), and metabolic state using a custom-designed mitoxosome array and Seahorse XF24 Analyzer. LPS/IFN-γ treatment of mφs elicited a potent increase in production of tumor necrosis alpha (TNF-α) at 3 h and of ROS and ·NO by 18 h. Upon SYL infection, murine mφs elicited an inflammatory cytokine profile (TNF-α ≫ TGF-β + IL-10) and low levels of ·NO and ROS production. LPS/IFN-γ treatment resulted in the inhibition of oxidative metabolism at the gene expression and functional levels and a switch to the glycolytic pathway in mφs, while IL-4-treated mφs utilized oxidative metabolism to meet energy demands. SYL infection resulted in an intermediate functional metabolic state with increased mitoxosome gene expression and glycolysis, and IFN-γ addition shut down the oxidative metabolism in SYL-infected mφs. Further, TCC- and SYL-stimulated mφs exhibited similar levels of cell proliferation and production of TNF-α and ROS, while TCC-stimulated mφs exhibited up to 2-fold-higher levels of oxidative metabolism and ·NO production than SYL-infected mφs. Inhibiting ATP-coupled O2 consumption suppressed the ·NO generation in SYL-infected mφs. Mitochondrial oxygen consumption constitutes a mechanism for stimulating ·NO production in mφs during T. cruzi infection. Enhancing the oxidative metabolism provides an opportunity for increased ·NO production and pathogen clearance by mφs to limit disease progression.
INTRODUCTION
Chagas cardiomyopathy is a neglected debilitating disease caused by the blood-borne parasite Trypanosoma cruzi. T. cruzi isolates are classified within six genetic groups (TcI to TcVI) which give insight into the evolution of the parasite (1). The virulent T. cruzi strain SylvioX10/4 (SYL) (2) and the nonpathogenic T. cruzi isolate (TCC) (3) are both of the TcI lineage which is considered to be the most common cause of disease in the Southern zone countries of South America, Central America, and Mexico. In mice and rats, SYL elicits acute parasitemia and persistent inflammatory infiltrate and injury in the myocardium and skeletal muscle during the chronic disease phase (4), while infection with the TCC isolate results in no detectable parasitemia or tissue injury (5).
Macrophages (mφs) serve as the first responders to T. cruzi infection, and their inflammatory activation exerts cytotoxic effects via NADPH oxidase (NOX)-mediated superoxide (O2·−) and inducible nitric oxide synthase (iNOS)-mediated nitric oxide (·NO) production. In the context of T. cruzi, it is suggested that mφ-derived peroxynitrite, a strong cytotoxic agent, formed by the reaction of ·NO with O2·−, plays a major role in the direct killing of T. cruzi (6). CD4+ and CD8+ T cells producing type 1 cytokines and CD8+ T cell-mediated cytolytic activity were shown to be activated in response to T. cruzi infection in both experimental models and human patients (reviewed in reference 7); however, infected hosts are unable to clear the parasite and eventually develop chronic chagasic cardiomyopathy and heart failure (8). Further, rodent models of acute Chagas disease have shown that mφs have a dual role in controlling parasitemia and facilitating T. cruzi dissemination to peripheral tissues (9, 10). These studies suggest that a subpar activation of mφs or other innate immune cells may be key to parasite persistence and resultant evolution of chronic disease; however, why mφs lack potent anti-parasite cytotoxic responses is not known.
Recent studies have suggested that the metabolic status of mφs may govern their functional capabilities (11). The signature of the proinflammatory mφs is the production of high levels of ·NO and tumor necrosis alpha (TNF-α) associated with the use of glycolysis to meet energy demands (12). On the other end of the mφ activation spectrum, immunomodulatory mφs primarily depend on the electron transport chain (ETC) and oxidative phosphorylation (OXPHOS) systems for the generation of energy (13). Evaluating the metabolic response of mφs would give insight into their functional status upon T. cruzi stimulation.
In this study, we investigated how mφs activate to an insufficient inflammatory phenotype in response to T. cruzi infection. We evaluated the responses of mouse and human mφs to SYL and TCC isolates of T. cruzi by monitoring the generation of reactive oxygen species (ROS) and reactive nitrogen species (RNS), cytokine profiles, and metabolic functions. Parasite-stimulated and -infected mφs were compared to mφs induced with lipopolysaccharide and gamma interferon (LPS/IFN-γ) or with interleukin-4 (IL-4) for proinflammatory and immunomodulatory phenotypes, respectively. Our data suggest that the virulent isolate of T. cruzi inhibits the activation of the glycolytic pathway and the oxidative/nitrosative response in mφs. Mitochondrial oxidative metabolism-induced O2 consumption may constitute a novel mechanism for initiating ·NO production and pathogen clearance by mφs to limit disease progression.
MATERIALS AND METHODS
Ethics statement.
Human peripheral blood mononuclear cells (PBMCs) were obtained from healthy donors per an approved Institutional Review Board (IRB) protocol (11-076). The work with the pathogen Trypanosoma cruzi was conducted in a biosafety level 2 laboratory following the regulations of the University of Texas Medical Branch (UTMB) and Centers for Disease Control and Prevention.
Parasites and macrophage cultures.
T. cruzi SYL and TCC trypomastigotes were propagated in C2C12 cells. SYL and C2C12 cells were purchased from American Type Culture Collection (ATCC, Manassas VA), and the TCC isolate was kindly provided by M. P. Zago (Instituto de Patologia Experimental, Salta, Argentina). RAW 264.7 mφs (ATCC TIB-71) were cultured in high-glucose Dulbecco's modified Eagle's medium (DMEM) with glutamine (Corning, Corning, NY) containing 10% fetal bovine serum (FBS) (Invitrogen, Carlsbad, CA), 100 U/ml penicillin, and 100 μg/ml streptomycin (Corning). THP-1 monocytes (ATCC TIB-202) (a kind gift from Alfredo Torres at UTMB) were propagated in RPMI media containing 10% FBS and 100 U/ml penicillin and 100 μg/ml streptomycin (complete RPMI). To generate THP-1 mφs, monocyte cultures were treated with 50 ng/ml of phorbol 12-myristate 13-acetate (Sigma-Aldrich, St. Louis, MO) in complete RPMI media for 24 h, washed, and rested for 48 h before their use in experiments. To generate primary human mφs, fresh blood samples were collected from healthy volunteers per our approved IRB protocol, and then monocytes were isolated by using Ficoll-Paque solution (GE Healthcare, Pittsburgh, PA) and a human monocyte enrichment kit without CD16 and an Easysep magnet (Stemcell, Vancouver, Canada) by following the recommendations of the manufacturers. The resulting monocytes were differentiated to mφs over 7 days with 25 ng/ml granulocyte-macrophage colony-stimulating factor (GM-CSF) (Peprotech, Rocky Hill, NJ) in complete RPMI media. All cells were maintained in 5% CO2 in a humidified incubator at 37°C.
Macrophages were seeded in 12-well (1 × 10⁶/well), 24-well (5 × 10⁵/well), or 96-well (6.7× 10⁴/well) plates and were infected with T. cruzi trypomastigotes at a cell-to-parasite ratio of 1:3. Infected macrophages were incubated in the presence or absence of 50 ng/ml IFN-γ (Biolegend, San Diego, CA) for 3 h or 18 h. Mφs incubated with 100 ng/ml LPS–20 ng/ml IFN-γ and 20 ng/ml IL-4 (Life Technologies, Carlsbad, CA) were used as proinflammatory and immunomodulatory mφ controls, respectively. Mφs incubated with media alone were used as no-treatment background controls. Culture supernatants were stored at −80°C until analysis.
Cytokine levels.
The release of TGF-β, IL-10, and TNF-α was measured in culture supernatants of mφs incubated with LPS/IFN-γ, IL-4, or T. cruzi by using a sandwich enzyme-linked immunosorbent assay (ELISA) (eBioscience, San Diego, CA) following the instructions of the manufacturers. The change in absorbance as a measure of cytokine concentration was monitored at 450 nm by using a SpectraMax M5 spectrophotometer (Molecular Devices, Sunnyvale, CA). A standard curve was prepared with 0 to 1,000 pg/ml of recombinant cytokines.
Nitric oxide (·NO) and reactive oxygen species (ROS) detection.
The ·NO level in culture supernatants was measured by assaying the concentrations of nitrite (a stable nitric oxide breakdown product) in the culture supernatants by using the Griess assay (14). Briefly, 50 μl of supernatant samples was incubated for 5 min with 50 μl of 1% sulfanilamide made using 5% phosphoric acid and then with 50 μl of 0.1% N-(1-napthyl) ethylenediamine dihydrochloride (Sigma-Aldrich). Formation of diazonium salt was monitored at 545 nm (standard curve, 0 to 50 μM sodium nitrite). To measure ROS release, 50 μl of culture supernatants was incubated for 5 min with final reaction concentrations of 33 μM Amplex Red reagent (Thermo Scientific, Waltham, MA) and 0.1 U/ml horseradish peroxidase (final volume, 150 μl). The oxidation of Amplex Red to fluorescent resorufin by H2O2 (excitation wavelength, 563 nm [Ex563]; emission wavelength, 587 nm [Em587]) was recorded on a SpectraMax M5 microplate reader (standard curve, 0 to 10 μM H2O2) (15). To evaluate intracellular ROS levels, mφs were seeded in black-walled, clear-bottom 96-well plates and infected with T. cruzi isolates for 3 h or 18 h as described under “Parasites and macrophage cultures” above. The cells were washed, replenished with 100 μl culture media, and incubated for 30 min in the presence of 50 μM 2′,7′-dichlorodihydrofluorescein diacetate (H2DCFDA; Molecular Probes, Eugene, OR) at 37°C and 5% CO2. The cells were washed twice with phosphate-buffered saline (PBS) and loaded with 100 μl PBS, and then the intracellular ROS-dependent formation of 2′,7′-dichlorofluorescein (DCF) was analyzed at Ex485/Em538 by fluorimetry (16). To monitor the mitochondrial superoxide, RAW 264.7 macrophages were seeded in black-walled, clear-bottom 96-well plates and infected with T. cruzi isolates for 18 h. Cells were washed twice with PBS, incubated for 30 min in the presence of 5 μM MitoSox Red (Molecular Probes), and then washed and replenished with 100 μl Hanks balanced salt solution (HBSS). MitoSOX Red is rapidly and selectively targeted to the mitochondria, where its oxidation by superoxide results in release of red fluorescence that was measured at Ex510/Em580 by fluorimetry.
Quantitative reverse transcription-PCR (RT-qPCR) for analyzing oxidative metabolism.
The custom-designed mitoxosome arrays consisting of primer sets for probing the expression profiles of 45 key genes related to oxidative phosphorylation and mitochondrial biogenesis (plus 1 reference gene) were designed in collaboration with Tom Wood at the Biomolecular Resource Facility at the UTMB Galveston (Table 1). The oligomers were then synthesized (IDT, Coralville, IA) and validated for the generation of a single product in quantitative PCR (qPCR) under the thermal cycling conditions described below. All primer sequences are available upon request. Total RNA from the cells was extracted by using TRIzol reagent (Sigma-Aldrich) following the manufacturer's instructions. The DNA that might have been contaminating the RNA preparation was removed using an RNA purification kit (Ambion, Austin, TX). The RNA pellets were resuspended in Molecular Grade water (Corning) and then quantified by using a NanoDrop-1000 spectrophotometer (Thermo Scientific, Waltham, MA). The total RNA (500 ng) was reverse transcribed in a 20-μl reaction mixture by using an iScript cDNA synthesis kit (Bio-Rad, Hercules, CA). The cDNA was distributed equally across the gene array to be used as a template on a CFX Real-Time PCR detection system (Bio-Rad). The real-time PCR mix (20 μl) consisted of cDNA, 10 μl SYBR green master mix (Bio-Rad), and a 500 nM concentration of each of the gene-specific oligonucleotides. The thermal cycle conditions were 94°C for a 15-s denaturation step followed by annealing and extension at 60°C for 1 min for 40 cycles. The threshold cycle (CT) values for target mRNAs were normalized to the CT values for the 16S RNA gene sequence, and then the relative fold change of each target gene expression was calculated as 2−ΔΔCT by normalization to control group values using PrimePCR Analysis software (Bio-Rad). Values below 1.0 were calculated as negative fold change by dividing by −1 and are represented as downregulated levels of gene expression compared to the expression in no-treatment controls (17).
TABLE 1.
Mitoxosome gene expression of macrophages measured by qRT-PCRa
| Gene ID | Description | GenBank accession no. | LPS/IFN-γ |
IL-4 |
SYLX10 |
|||
|---|---|---|---|---|---|---|---|---|
| Fold change | P value | Fold change | P value | Fold change | P value | |||
| atp5a1 | ATP synthase, H+ transporting, mitochondrial F1 complex, alpha subunit 1, cardiac muscle | NM_001001937 | −1.833 | ND | −10.017 | 0.385 | −1.680 | 0.410 |
| atp5c1 | ATP synthase, H+ transporting, mitochondrial F1 complex, gamma polypeptide 1 | NM_001001973 | 19.202 | 0.117 | −2.237 | 0.343 | 8.980 | 0.000 |
| atp5o | ATP synthase, H+ transporting, mitochondrial F1 complex, O subunit | NM_001697 | −8.594 | 0.157 | −1.513 | 0.455 | 11.022 | 0.000 |
| bpol | Polymerase (DNA directed), beta | NM_002690 | −4.486 | 0.045 | −1.626 | 0.203 | 6.132 | 0.001 |
| cenpb | Centromere protein B | NM_001810 | 2.042 | 0.447 | 6.563 | 0.581 | −26.233 | 0.119 |
| cox5b | Cytochrome c oxidase subunit Vb | NM_001862 | −4.293 | 0.002 | NC | 0.023 | 5.092 | 0.000 |
| cox7a2 | Cytochrome c oxidase subunit VIIa polypeptide 2 (liver) | NM_001865 | −5.742 | 0.077 | NC | 0.623 | 8.219 | 0.001 |
| cyb5r3 | Cytochrome b5 reductase 3 | NM_000398 | 1.876 | 0.784 | 2.496 | 0.906 | −1.622 | 0.220 |
| cycn1 | Cyclin 1 | NM_006835 | −2.457 | 0.291 | 1.899 | 0.832 | NC | 0.429 |
| drp1 | Dynamin 1-like | NM_012063 | −2.672 | 0.224 | NC | 0.955 | 1.912 | 0.190 |
| fhl1 | Four and a half LIM domains 1 | NM_001449 | −6.389 | 0.230 | NC | 0.488 | −1.935 | 0.185 |
| fis1 | Fission 1 (mitochondrial outer membrane) | NM_016068 | −4.750 | 0.000 | −1.520 | 0.047 | 5.142 | 0.000 |
| ho1 | Heme oxygenase 1 | GQ221778.1 | 1.510 | 0.831 | NC | 0.763 | −1.617 | 0.252 |
| hspc051 | Ubiquinol-cytochrome c reductase, complex III subunit X | NM_013387 | −5.593 | 0.002 | NC | 0.137 | 5.544 | 0.006 |
| lsp1 | Lymphocyte-specific protein 1 | NM_002339 | −1.856 | 0.339 | NC | 0.478 | −3.082 | 0.170 |
| mfn1 | Mitofusin 1 | NM_033540 | 1.536 | 0.664 | NC | 0.738 | 1.865 | 0.255 |
| mfn2 | Mitofusin 2 | NM_014874 | NC | 0.360 | 1.681 | 0.835 | 2.874 | 0.436 |
| mt-16S | Mitochondrially encoded 16S RNA | GQ369957.1 | ||||||
| mt-atp6 | Mitochondrially encoded ATP synthase 6 | GQ369957.1 | −3.176 | 0.033 | NC | 0.647 | 5.727 | 0.007 |
| mt-atp8 | Mitochondrially encoded ATP synthase 8 | GQ369957.1 | −3.464 | 0.080 | NC | 0.881 | 2.068 | 0.189 |
| mt-co1 | Mitochondrially encoded cytochrome c oxidase I | GQ369957.1 | −1.893 | 0.310 | NC | 0.613 | 2.377 | 0.098 |
| mt-co2 | Mitochondrial cytochrome c oxidase subunit II | GQ369957.1 | −1.758 | 0.318 | NC | 0.981 | 2.242 | 0.110 |
| mt-co3 | Mitochondrially encoded cytochrome c oxidase III | GQ369957.1 | −3.387 | 0.002 | NC | 0.307 | 8.819 | 0.006 |
| mt-cytb | Mitochondrially encoded cytochrome b | GQ369957.1 | −2.957 | 0.108 | NC | 0.438 | 4.326 | 0.010 |
| mt-nd1 | Mitochondrially encoded NADH dehydrogenase 1 | GQ369957.1 | −4.970 | 0.000 | −1.596 | 0.017 | 6.823 | 0.012 |
| mt-nd2 | Mitochondrially encoded NADH dehydrogenase 2 | GQ369957.1 | −2.945 | 0.150 | NC | 0.546 | 4.241 | 0.011 |
| mt-nd3 | Mitochondrially encoded NADH dehydrogenase 3 | GQ369957.1 | −3.033 | 0.026 | NC | 0.381 | 5.673 | 0.011 |
| mt-nd4 | NADH dehydrogenase 4 | GQ369957.1 | −1.962 | 0.308 | NC | 0.990 | 2.711 | 0.091 |
| mt-nd4l | Mitochondrially encoded NADH dehydrogenase 4L | GQ369957.1 | −2.340 | 0.234 | NC | 0.929 | 2.923 | 0.026 |
| mt-nd5 | Mitochondrially encoded NADH dehydrogenase 5 | GQ369957.1 | −1.556 | 0.370 | 1.654 | 0.985 | NC | 0.704 |
| mt-nd6 | NADH dehydrogenase subunit 6 | GQ369957.1 | −4.373 | 0.032 | NC | 0.442 | 4.131 | 0.006 |
| ndufa5 | NADH dehydrogenase (ubiquinone) 1 alpha subcomplex 5 | NM_005000 | −7.325 | 0.048 | NC | 0.329 | 3.893 | 0.017 |
| ndufb5 | NADH dehydrogenase (ubiquinone) 1 beta subcomplex 5 | NM_002492 | −5.277 | 0.003 | NC | 0.455 | 5.191 | 0.004 |
| nrf1a | Nuclear respiratory factor 1 | NM_001040110 | −1.825 | 0.342 | NC | 0.961 | NC | 0.347 |
| nrf2 | Nuclear factor, erythroid 2-like 2 | NM_006164 | 1.566 | 0.913 | NC | 0.527 | NC | 0.401 |
| opa1 | Optic atrophy 1 | NM_015560 | −2.678 | 0.169 | NC | 0.969 | 2.529 | 0.012 |
| parkin | Parkin RBR E3 ubiquitin protein ligase | NM_004562 | −2.344 | 0.290 | NC | 0.607 | −1.717 | 0.218 |
| ppargc1a | Peroxisome proliferator-activated receptor gamma, coactivator 1 alpha | NM_013261 | −3.540 | 0.503 | NC | 0.978 | 2.921 | 0.180 |
| pink1 | PTEN-induced putative kinase 1 | NM_032409 | −5.809 | 0.128 | −1.514 | 0.390 | 2.567 | ND |
| polg1 | Polymerase (DNA directed), gamma | NM_002693 | 3.406 | 0.575 | 6.286 | 0.901 | −15.256 | 0.126 |
| rps2 | Ribosomal protein S2 | NM_002952 | NC | 0.426 | 2.675 | 0.646 | NC | 0.346 |
| sdhd | Succinate dehydrogenase complex, subunit D, integral membrane protein | NM_003002 | −1.604 | 0.299 | NC | 0.444 | 4.132 | 0.002 |
| sod2 | Superoxide dismutase 2, mitochondrial | NM_000636 | 4.054 | 0.017 | −5.395 | 0.169 | 1.876 | 0.249 |
| tfam | Mitochondrial transcription factor A | NM_003201 | −8.659 | 0.001 | NC | 0.680 | 5.306 | ND |
| uqcrb | Ubiquinol-cytochrome c reductase binding protein | NM_006294 | −6.859 | 0.004 | −1.843 | 0.019 | 7.502 | 0.001 |
| uqcrc1 | Ubiquinol-cytochrome c reductase core protein I | NM_003365 | −3.162 | 0.198 | 1.843 | 0.361 | 2.094 | 0.174 |
A panel of 45 mitoxosome genes were used for the evaluation of THP-1 macrophages treated with IFN-γ/LPS, IL-4, and SYL as described in Materials and Methods. Fold changes in gene expression compared to no-treatment controls (N) were calculated by using the 2−ΔΔCT method. Fold change values > |1.5| are shown. Upregulation data are highlighted with underlining, downregulation data are highlighted in bold, and P values < 0.05 are highlighted in italics. ND, not detectable or not determined; NC, no change or fold change < |1.5|. ID, identifier.
Bioenergetic function analysis.
An XF24 Extracellular Flux Analyzer (Seahorse Biosciences, North Billerica, MA) was used to measure bioenergetic function (18). The optimum number of RAW 264.7 mφs per well was determined as 80,000/0.32 cm2/well for obtaining a confluent monolayer culture. In all experiments, each treatment was performed in five replicates. The oxygen consumption rate (OCR) (moles per minute) was measured as an index of mitochondrial function. Cells were equilibrated in XF assay medium (serum-free, bicarbonate-free, phenol red-free DMEM [pH 7.4] supplemented with 5 mM glucose and 0.5 mM l-glutamine) for 1 h prior to the bioenergetic measurements. A line diagram of the OCR measurements is shown in Fig. S1A in the supplemental material. After recording the initial basal OCR of macrophages (with or without T. cruzi, LPS/IFN-γ, or IL-4), oligomycin (1 μM), FCCP [carbonyl cyanide-4-(trifluoromethoxy)phenylhydrazone] (1 μM), and antimycin A (1 μM) were injected sequentially through the ports of the Seahorse Flux Pak cartridge. The ATP production-dependent OCR was calculated by the decrease in basal OCR post-oligomycin addition. The remaining OCR is due to proton leakage. An increase in the OCR post-FCCP addition (OCRFCCP) (uncouples the respiratory chain from ATP synthesis) was used to determine the maximal mitochondrial respiration capacity. The reserve (spare) respiratory capacity (SRC) was calculated as the difference between the OCRBasal and OCRFCCP values. Treatment with antimycin A inhibited the flux of electrons through complex III and O2 consumption at cytochrome c oxidase and allowed measurement of background nonmitochondrial respiration.
The indices of glycolytic function were monitored by the extracellular acidification rate (ECAR; mpH per minute) based on lactate efflux (19) and were determined simultaneously with the OCR. A line diagram of ECAR measurements is shown in Fig. S1B in the supplemental material. The ECAR at the basal level (ECARBasal) and the increase in the ECAR with oligomycin addition (ECAROligomycin) represented the use of glycolysis for energy demand and total glycolytic capacity, respectively. The glycolytic reserve capacity was calculated as the difference between ECARBasal and ECAROligomycin. Adding 2-deoxyglucose (2DG) inhibited all glycolytic function and allowed a measure of the nonglycolytic acidification rate (18).
Measurement of cell viability.
RAW 264.7 mφs (2 × 10⁴ per well) were seeded in 96-well plates and incubated with T. cruzi isolates for 3 h or 18 h. Cells were washed twice with PBS and incubated for 30 min in the presence of 0.5 mg/ml of 3-(4,5-dimethylthiazol-2-yl)-2,5-diphenyltetrazolium bromide (MTT; from Sigma-Aldrich) in culture media. The reduction of yellow tetrazolium MTT by dehydrogenase enzymes in metabolically active cells results in the formation of purple formazan crystals. Formazan crystals were solubilized in 100 μl of dimethyl sulfoxide (DMSO), and the change in absorbance was measured at 590 nm by using a SpectraMax M5 spectrophotometer.
Giemsa staining of T. cruzi-infected macrophages.
A total of 2 × 10⁴ RAW 264.7 mφs were seeded in Nunc Lab-Tek 8-well chamber slides (Thermo Scientific) and then treated with T. cruzi for 18 h. Cells were washed twice with PBS and then fixed with methanol for 5 min. Methanol was aspirated, and cells were air-dried before incubation with Giemsa working stain was performed. Stock Giemsa stain (Acros Organics, Thermo Scientific) was diluted to a 2.5% working stain in 6.7 mM sodium phosphate buffer–0.0025% Triton X-100 (pH 7.2) and then incubated on the cell slides for 45 min. The stained cells were washed with wash buffer, air-dried, and then visualized at 40× on a light microscope (BX53F Olympus, Center Valley, PA).
Statistical analysis.
All experiments were conducted with at least triplicate observations per treatment, and data are expressed as means ± standard errors of the means (SEM). Data were analyzed by Student's t test, one-way analysis of variance (ANOVA) with Tukey's post hoc test, or two-way ANOVA with Bonferroni post hoc test by using GraphPad Prism 5 software. Statistical significance for gene expression analysis was calculated by using PrimePCR Analysis software (Bio-Rad). Significant differences compared to no-treatment controls or as otherwise stated are annotated as follows: *, P value < 0.05; **, P value < 0.01; and ***, P value < 0.001.
Accession number(s).
Accession numbers for data determined in this work and deposited in GenBank are presented in Table 1.
RESULTS
ROS production and NO production, but not TNF-α production, are suppressed in macrophages infected with T. cruzi.
To assess the quality of the mφ response to pathogenic T. cruzi SylvioX10/4 (SYL), we quantified the secretion of the proinflammatory activation markers TNF-α, ROS, and ·NO from murine (RAW 264.7) and human (THP-1 and primary) mφs. Macrophages were incubated with T. cruzi for 3 h and 18 h to capture the state of parasite-induced mφ stimulation and infection, respectively, and mφs incubated with LPS/IFN-γ or IL-4 were used as controls. The LPS/IFN-γ-treated murine mφs, compared to mφs incubated in media alone, exhibited a >1,000-fold increase in TNF-α release within 3 h (Fig. 1A, P < 0.001ANOVA-Tukey's) that was not further increased at 18 h posttreatment (Fig. 1B). RAW 264.7 mφs infected with SYL (versus no treatment) exhibited a rapid and potent increase in TNF-α release at 3 h (P < 0.001ANOVA-Tukey's) that was slightly lower than that noted in LPS/IFN-γ-treated mφs. By 18 h, SYL-infected murine mφs exhibited levels of TNF-α that were similar to or higher than those noted for LPS/IFN-γ-treated mφs (Fig. 1B). In comparison, murine mφs incubated with IL-4 exhibited no increase in TNF-α release above the background levels (Fig. 1A and B). Human (THP-1- and PBMC-derived) mφs treated with LPS/IFN-γ for 18 h also exhibited a potent increase in TNF-α release above the background level (Fig. 1C and D, P < 0.001ANOVA-Tukey's). However, human mφs exhibited no significant increase in TNF-α release in response to SYL infection (Fig. 1C and D), like that noted in IL-4-treated mφs. No increase was noted in the immunomodulatory cytokines tumor growth factor-β and IL-10 in murine mφs incubated with SYL for 3 h or 18 h. Together, the results presented in Fig. 1 suggested that a potent activation of TNF-α is a key feature of LPS/IFN-γ induced mφs and that murine (but not human) mφs are capable of responding to SYL infection by elicitation of inflammatory cytokine response.
FIG 1.
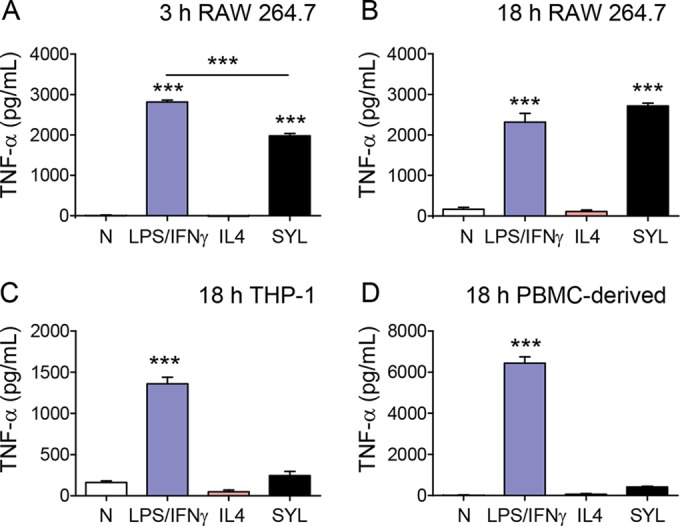
T. cruzi SYL challenge induces the production of TNF-α in murine RAW 264.7 macrophages (mφs) but not in mφs of human lineage. Murine (RAW 264.7) and human (THP-1 and peripheral blood monocyte-derived) mφs were infected with T. cruzi SylvioX10/4 (SYL) isolate at 1:3 cell-to-parasite ratio. Macrophages treated with 100 ng/ml LPS–20 ng IFN-γ or 20 ng/ml IL-4 were used as controls. Culture supernatants were obtained at 3 h and 18 h postincubation, and an ELISA was performed to quantitate cytokine release. Data represent the results of TNF-α release from RAW mφs incubated for 3 h (A) or 18 h (B) and TNF-α release from human THP-1 (C) and peripheral blood mononuclear cell (PBMC)-derived primary (D) mφs incubated for 18 h. In all figures, data are expressed as means ± SEM (n ≥ 3 replicates per treatment per experiment). Significance was calculated by one-way ANOVA with Tukey's multiple-comparison test; data are presented as treatment group versus no-treatment control (N) unless marked by a horizontal line (***, P < 0.001).
Macrophage production of ·NO and O2·−, known as nitrosative and oxidative stress, respectively, is an important indicator of the cytotoxicity of phagocytes. Our data showed that ·NO and H2O2 release as well as intracellular ROS (DCF fluorescence) levels were not significantly increased above the background levels in murine mφs incubated with LPS/IFN-γ, IL-4, or SYL for 3 h (Fig. 2A to C). By 18 h postincubation, LPS/IFN-γ induced 10-fold and 5-fold increases in ·NO release and intracellular ROS, respectively (Fig. 2D and E, P < 0.001ANOVA-Tukey's), while no significant differences were observed for H2O2 release (Fig. 2F) compared to that noted in mφs incubated with IL-4 or media alone. RAW 264.7 mφs infected with SYL for 18 h exhibited low levels of ·NO (Fig. 2D), a 2-fold increase in H2O2 release (Fig. 2F), and no increase in intracellular ROS levels (Fig. 2E) compared to those noted in normal controls. A significant induction of intracellular ROS was also detected in human THP-1 mφs that were incubated with LPS/IFN-γ (P < 0.001ANOVA-Tukey's) compared to THP-1 mφs incubated with IL-4, SYL, or media alone for 18 h (Fig. 2G). To identify the source of ROS, we stimulated RAW 264.7 mφs with LPS/IFN-γ in the presence of an NADPH oxidase (NOX2) inhibitor, diphenyleneiodonium (DPI), and then measured the levels of intracellular ROS and mitochondrial ROS using H2DCFDA and MitoSOX Red fluorescent probes, respectively. We found that the inhibition of NOX2 by DPI abolished the LPS/IFN-γ-induced intracellular ROS (Fig. 2H). Basal levels of mitochondrial ROS that were detected in the no-treatment control mφs were further decreased by LPS/IFN-γ induction, and cotreatment with DPI prevented the LPS/IFN-γ suppression of mitochondrial ROS in murine mφs (Fig. 2I). Together, the results presented in Fig. 2 suggested that murine and human mφs respond by the production of ·NO and ROS in the order LPS/IFN-γ ≫ SYL > IL-4 = media alone, where ROS release is increased by NADPH oxidase activation.
FIG 2.

Macrophages elicit suboptimal ·NO and ROS production in response to T. cruzi infection. (A to F) RAW 264.7 murine mφs were infected with the SYL isolate of T. cruzi as described for Fig. 1. Macrophages treated with 100 ng/ml LPS–20 ng/ml IFN-γ or 20 ng/ml IL-4 were used as controls. Macrophages were incubated for 3 h (A to C) or 18 h (D to I). Bar graphs show nitrite release, a measure of ·NO production, by Griess test (A and D); DCF fluorescence, a measure of intracellular ROS production (B and E); and H2O2 release measured by an Amplex Red assay by fluorimetry (C and F). (G) THP-1 mφs were infected with SYL or treated with LPS/IFN-γ or IL-4 for 18 h as described above, and DCF fluorescence (intracellular ROS) was determined by fluorimetry. (H and I) RAW 264.7 mφ were treated with 100 ng/ml LPS–20 ng/ml IFN-γ for 18 h in the presence or absence of a NOX inhibitor, diphenyleneiodonium (DPI). Total intracellular ROS (H) and mitochondrial ROS (I) were measured by DCF and MitoSOX Red fluorescence, respectively. Fold change is presented in comparison to no-treatment controls. Data are shown as means ± SEM (n ≥ 3 replicates per treatment per experiment). Significance was calculated by one-way ANOVA with Tukey's multiple-comparison test, and data are presented as treatment group versus no-treatment control unless marked by a horizontal line (*, P < 0.05; **, P < 0.01; ***, P < 0.001).
Mitochondrial gene transcription is induced in T. cruzi-infected macrophages.
Cellular metabolic status can serve as a signaling event in the functional activation of mφs toward diverse phenotypes (20). THP-1 mφs were incubated for 12 h with LPS/IFN-γ or IL-4, or for 18 h with SYL, and we performed RT-qPCR analysis to probe the expression of 45 mitoxosome genes by using a custom-designed array (Table 1). All 45 of the genes were differentially expressed by at least ∣1.5∣-fold change in mφs incubated with LPS/IFN-γ, IL-4, or SYL compared to media alone (Fig. 3A), and the results for 22 of the genes were statistically significant (P < 0.05).
FIG 3.

Oxidative metabolism-related gene expression profile in macrophages infected with T. cruzi. THP-1 monocytes were differentiated to resting mφs and incubated in triplicate with LPS/IFN-γ, IL-4, or SYL as described in Materials and Methods. RT-qPCR was performed by using custom-designed arrays to profile the expression of mitochondrial oxidative metabolism-related genes in LPS/IFN-γ-, IL-4-, and SYL-treated mφs. The data were normalized to the 16S gene, and fold change was calculated against the expression levels in mφs incubated in media alone. (A) A heat map of differential gene expression profile. Mitoch, mitochondrial; Nuc, nuclear. (B and C) Venn diagrams of numbers of genes whose expression was increased (B) or decreased (C) (≥1.5-fold change, P < 0.05) in mφs incubated with LPS/IFN-γ, IL-4, or SYL with respect to no-treatment controls are shown.
A total of 27 genes were differentially expressed by at least ∣1.5∣-fold change (2 upregulated, 25 downregulated) in LPS/IFN-γ-induced mφs (Fig. 3B and C), where the upregulation of an antioxidant gene (sod2) and downregulation of 9 genes (mt-nd3, mt-nd6, ndufa5, ndufb5, hspc051, cox5b, mt-co3, mt-atp6, and tfam) involved in the electron transport chain, mitochondrial fission, and mitochondrial and nuclear gene transcription were deemed statistically significant in comparison to the no-treatment mφ group.
In IL-4-treated mφs, only 2 genes (atp5c1 and sod2) were downregulated (P < 0.05) (Fig. 3C) and 5 genes were upregulated by ≥∣1.5∣-fold (Fig. 3B), but the results were not significantly different from the expression in the untreated mφs (Table 1). In comparison, SYL-infected mφs exhibited upregulation of 27 genes, encoding products involved in the electron transport chain, mitochondrial fission and fusion, and a nuclear polymerase (Fig. 3A), and the results for 19 of the genes were deemed statistically significant (Fig. 3B and Table 1). Only 4 genes were differentially downregulated, but the results did not show statistical significance (Fig. 3C and Table 1). These results suggested that LPS/IFN-γ switched off the mitoxosome at the transcriptional level and that SYL-infected mφs enhanced the gene expression profile conducive to oxidative metabolism.
T. cruzi-infected macrophages fail to switch to glycolytic metabolism.
To investigate the metabolic status of mφs at the functional level in response to SYL, we employed the XF24 Analyzer to examine two major pathways of energy production: oxidative metabolism based on mitochondrial oxygen consumption rate (OCR; see Fig. S1A in the supplemental material) and glycolysis by extracellular acidification rate (ECAR; see Fig. S1B). The metabolic status of murine mφs incubated with LPS/IFN-γ, IL-4, or SYL for 3 h showed no differences in the levels of basal (OCRBasal-OCRAntimycin) and ATP-linked (OCRBasal-OCROligomycin) OCR, as well as in proton leak (OCROligomycin-OCRAntimycin), in treated (versus untreated) mφs at 3 h (Fig. 4A.a and A.b). However, FCCP induction of mitochondrial maximal respiration capacity (OCRFCCP-OCRAntimycin) was found to be 60% (P < 0.001ANOVA-BF) and 35% (P < 0.05ANOVA-BF) higher in IL-4-treated and SYL-infected murine mφs, respectively, than in LPS/IFN-γ-treated mφs. Likewise, IL-4-treated and SYL-infected mφs exhibited 7-fold higher levels of mitochondrial respiratory reserve capacity (OCRFCCP-OCRBasal) (Fig. 4A.a and A.b, P < 0.01 to 0.001ANOVA-BF). Basal use of the glycolytic pathway for energy demand was enhanced by 1.6-fold and 2-fold by LPS/IFN-γ and SYL, respectively, compared to that noted in IL-4-treated mφs (Fig. 4B.a and B.b, all, P < 0.001ANOVA-BF). After the addition of oligomycin (inhibits complex V ATP synthase activity), the maximal ECAR was increased in all mφ samples, with the least increase in ECAR being induced by IL-4 treatment. Total levels of glycolytic capacity (ECAROligomycin-ECARBasal) were not statistically different in any of the macrophage samples at 3 h (Fig. 4B). Altogether, at 3 h postincubation, (i) LPS/IFN-γ treatment resulted in a reduction of the mitochondrial maximal and reserve respiration capacity and activation of glycolytic metabolism; (ii) IL-4 induced preferential utilization of oxidative metabolism; and (iii) SYL infection resulted in an intermediate metabolic state that presented with no decline in oxidative metabolism combined with the capability of using glycolysis to meet the energy demand in macrophages.
FIG 4.

Macrophage utilization of oxidative metabolism is not perturbed in the presence of T. cruzi SYL. RAW 264.7 mφs (8 × 10⁴/well) were seeded in XF24 plates and incubated with T. cruzi (SylvioX10/4), LPS/IFN-γ, or IL-4 for 3 h (A and B) or 18 h (C and D). The oxygen consumption rate (OCR = mitochondrial oxidative metabolism rate) and extracellular acidification rate (ECAR = anaerobic glycolytic metabolism) were evaluated by using an XF24 Analyzer. Data represent OCR (A.a and C.a) and ECAR (B.a and D.a) profiles of macrophages in response to sequential administration of pharmacological modulators of the mitochondrial electron transport chain, including oligomycin (O), FCCP (F), and antimycin (A). Bar graphs show mean values (± SEM) for OCR (A.b and C.b)- and ECAR (B.b and D.b)-based parameters, derived from the mean of five replicates (triplicate readings per sample). Significance was calculated by two-way ANOVA with Bonferroni post hoc test and is expressed as results of comparisons to the LPS/IFN-γ (A.b and C.b)- or IL-4 (B.b and D.b)-treated mφs (*, P < 0.05; **, P < 0.01; ***, P < 0.001).
By 18 h, murine mφs incubated with IL-4 and LPS/IFN-γ were completely polarized in their use of mitochondrial oxidative metabolism and glycolysis, respectively, for energy demand (Fig. 4C and D). LPS/IFN-γ-treated mφs showed no use of mitochondrial respiration (Fig. 4C.a and C.b). In comparison, IL-4-treated mφs exhibited >10-fold higher levels of basal, ATP-coupled, maximal, and reserve mitochondrial respiration (Fig. 4C.a and C.b, all P < 0.001ANOVA-BF) that was abolished by antimycin (inhibits ATP-coupled respiration), thus suggesting that the mitochondrial oxidative metabolism was the major pathway used to fulfill energy demand. Further, SYL-infected murine mφs (versus LPS/IFN-γ mφs) continued to utilize mitochondrial oxidative metabolism, though basal, ATP coupled, and maximal respiration levels in SYL-infected mφs at 18 h were at 45% to 60% of the levels noted in IL-4-treated mφs (P < 0.001ANOVA-BF), and their reserve respiratory capacity was completely depleted (Fig. 4C.a and C.b). A 2-fold decline in OCR mediated by 2-deoxyglucose (2DG; inhibits glycolysis) in IL-4-treated mφs suggested that immunomodulatory mφs utilize the glycolytic pathway to feed the substrate to tricarboxylic acid (TCA) cycle-linked oxidative metabolism (Fig. 4C.a and C.b).
ECAR measurements in murine mφs incubated for 18 h showed that LPS/IFN-γ and SYL induced 57 to 61% more utilization of the glycolytic pathway than IL-4 in mφs (ECARBasal) (P < 0.001ANOVA-BF, Fig. 4D.a and D.b). When mitochondrial respiration was inhibited by oligomycin, IL-4-treated and SYL-infected (versus LPS/IFN-γ-treated) mφs were capable of increasing glycolysis as a source of energy and showed high levels of glycolytic reserve capacity (Fig. 4D.a and D.b, P < 0.001ANOVA-BF). The shutdown of ECAR by the addition of 2DG confirmed that LPS/IFN-γ-treated mφs utilized glucose for energy. Altogether, at 18 h postincubation, (i) IL-4-induced mφs continued to utilize mitochondrial oxidative metabolism as a major source of energy; (ii) complete shutdown of mitochondrial metabolism and a switch to glycolysis as a sole source of energy with no glycolytic reserve capacity occurred in LPS/IFN-γ-treated mφs; and, importantly, (iii) SYL infection arrested the mφs in an IL-4-like metabolic state and prevented the switch to utilizing glycolysis as a major source of energy as was noted in LPS/IFN-γ-treated mφs.
IFN-γ supplementation during T. cruzi infection promotes a metabolic switch in macrophages.
We next investigated if providing IFN-γ as a secondary stimulus would enhance the metabolic shift of mφs treated with T. cruzi. Within 3 h, SYL/IFN-γ-treated mφs exhibited a 57% decline in basal and ATP-linked respiration (Fig. 5A.a and A.b, P < 0.001ANOVA-BF) and a partial use of glycolysis (Fig. 5B.a and B.b) compared to the results noted in mφs treated with only SYL or in no-treatment mφs. By 18 h, SYL/IFN-γ-treated mφs exhibited a shutdown of basal, ATP-linked, and maximal mitochondrial oxygen consumption (Fig. 5C.a and C.b) and utilized glycolysis at the maximal capacity (Fig. 5D.a and D.b), which was similar to the results noted in LPS/IFN-γ-treated mφs (Fig. 4C and D). These results suggested that (i) T. cruzi did not irreversibly affect the macrophage's ability to utilize oxidative or glycolytic metabolism and that (ii) IFN-γ serves as a signal sufficient to deactivate macrophage respiration and enhance glycolysis during T. cruzi infection.
FIG 5.

IFN-γ supplementation during T. cruzi infection suppressed oxygen consumption. RAW 264.7 mφ (8 × 10⁴/well) were seeded in XF24 plates and incubated for 3 h (A and B) or 18 h (C and D) with T. cruzi SYL in the presence or absence of 50 ng/ml IFN-γ. The OCR (A.a and C.a) and ECAR (B.a and D.a) real-time profiles of mφs in response to sequential modulation of mitochondrial electron transport chain were recorded as described for Fig. 4. Bar graphs show mean values (± SEM) of OCR (A.b and C.b)- and ECAR (B.b and D.b)-based parameters at 18 h, derived from the mean of 3 to 4 replicates (triplicate readings per sample). Significance was calculated by two-way ANOVA with Bonferroni post hoc test and is expressed as results of comparisons to the LPS/IFN-γ-treated mφs unless marked by a horizontal line (*, P < 0.05; **, P < 0.01; ***, P < 0.001). Note that supplementation of IFN-γ with T. cruzi reduced the mφ respiration in comparison to T. cruzi treatment alone.
Oxidative metabolism and NO production of macrophages are augmented in response to TCC.
The SYL isolate establishes a chronic infection, while the TCC isolate fails to persist in mice. To determine if a metabolic switch to a glycolytic pathway and LPS/IFN-γ-like activation was a prerequisite for mφ control of T. cruzi, we challenged the murine mφs with the TCC isolate. Giemsa staining showed no major differences in association of TCC and SYL isolates with RAW 264.7 mφs at 3 h (data not shown), and by 18 h, SYL trypomastigotes showed entrance into the host cell cytoplasm whereas some of the TCC trypomastigotes remained attached to the surface of mφs at this time point (Fig. 6A.a and A.b). In terms of oxidative metabolism at 3 h postincubation, the levels of basal, ATP-linked, and maximal O2 consumption seen with TCC-infected mφs were 54%, 59%, and 56% higher, respectively, than those seen with SYL-infected mφs (Fig. 6B.a and B.b, P < 0.01 to 0.001ANOVA-BF). TCC-infected mφs also exhibited a 60% higher level of mitochondrial spare respiratory capacity (OCRFCCP-OCRBasal) than SYL-infected mφs (Fig. 6B.a and B.b, P < 0.001ANOVA-BF). At 18 h (versus 3 h) postinfection (pi), the maximal OCR of TCC-infected murine mφs declined by 3-fold (compare Fig. 6B.b with Fig. 6C.b) but remained higher than the OCR of SYL-infected mφs (Fig. 6C.a and C.b, P < 0.01ANOVA-BF). However, no differences in the levels of mitochondrial OCR reserve at 18 h (Fig. 6C.b) or in ECARs (basal utilization of glycolytic pathway and glycolytic reserve) at 3 h and 18 h postincubation were observed in TCC- and SYL-infected mφs (see Fig. S2A and B in the supplemental material). These data suggested that TCC-infected mφs utilize a higher level of mitochondrial oxidative metabolism than SYL-infected mφs.
FIG 6.

SYL-versus-TCC-induced changes in oxygen consumption rate in macrophages. (A) RAW 264.7 mφs (2 × 10⁴/well) were seeded in Nunc Lab-Tek 8-well chamber slides and incubated with SYL or TCC isolates of T. cruzi for 18 h. Slides were stained with Giemsa stain and then visualized at ×40 magnification. Intracellular and attached T. cruzi trypomastigotes are marked by black and blue arrows, respectively. (B and C) RAW 264.7 mφs (8 × 10⁴/well) were seeded in XF24 plates and incubated with SYL or TCC isolates of T. cruzi for 3 h (B) and 18 h (C). The OCR was recorded as described for Fig. 4. Note that the basal, ATP-linked, and maximal respiration levels are augmented in mφs challenged with TCC compared to those challenged with the SYL isolate at 3 h (B.a). By 18 h pi, mφs challenged with TCC respired at levels similar to those seen with SYL-infected cells but continued to have an enhanced maximum O2 consumption capacity (C.a). Bar graphs show mean values (± SEM) of OCR-based parameters at 3 h (B.b) and 18 h (C.b) derived from the mean of four replicates (triplicate readings per sample). Significance was calculated by two-way ANOVA with Bonferroni post hoc test, and data are expressed as results of comparisons to the SYL-infected mφs (**, P < 0.01; ***, P < 0.001).
At a functional level, incubation for 3 h elicited no increase in the release of ·NO and H2O2, and intracellular ROS levels in TCC- and SYL-infected (versus uninfected) murine mφs (Fig. 7A, panels a to c) and mφ viability were also not affected by TCC or SYL after 3 h of incubation (Fig. 7A.d). After 18 h, TCC- and SYL-infected (versus no-treatment) murine mφs exhibited 4-fold and 2-fold increases in ·NO release (Fig. 7B.a, P < 0.001ANOVA-Tukey's) and 69% and 47% increases in H2O2 release (Fig. 7B.b, P < 0.05 to 0.01ANOVA-Tukey's), respectively, while no significant change in intracellular ROS levels (Fig. 7B.c) was observed. The SYL-infected and TCC-infected mφs exhibited 16.5% (P < 0.05) and 47.5% (P < 0.01) increases in proliferation (versus untreated controls), respectively, at 18 h postincubation (Fig. 7B.d). Further, TCC- and SYL-infected (versus uninfected) murine mφs exhibited a 10-fold increase in TNF-α release (Fig. 7C.aANOVA-Tukey's) at 18 h postincubation. THP-1 human mφs infected with TCC and SYL isolates for 18 h, compared to no-infection controls, also exhibited 14-fold and 21-fold increases in TNF-α release, respectively (Fig. 7C.b, P < 0.001ANOVA-Tukey's), although TNF-α release from infected THP-1 mφs was lower than that observed in LPS/IFN-γ-treated M1 mφs (Fig. 1C). Together, the results presented in Fig. 6 and 7 and in Fig. S2A and B in the supplemental material suggested that TCC- and SYL-infected mφs do not differ in their capacity to produce ROS and TNF-α but that TCC-infected mφs exhibit enhanced O2 consumption, mitochondrial oxidative metabolism, and nitrite production compared to the levels noted in SYL-infected mφs.
FIG 7.

SYL-versus-TCC-induced functional activation of macrophages. (A and B) RAW 264.7 mφs (5 × 10⁵ per well) were seeded in 24-well plates and incubated with TCC or SYL isolates of T. cruzi at a 1:3 cell-to-parasite ratio for 3 h (A) or 18 h (B). Bar graphs show nitrite release by a Griess test (A.a and B.a); H2O2 release by an Amplex Red assay (A.b and B.b); DCF fluorescence, a measure of intracellular ROS production (A.c and B.c); and cell viability and proliferation by MTT absorbance analysis (A.d and B.d). (C) RAW 264.7 and THP-1 mφs were infected with SYL for 18 h as described above. TNF-α production by RAW 264.7 (C.a) and THP-1 (C.b) mφs was measured by an ELISA. Data are presented as means ± SEM (n = 3 to 4 replicates per treatment per experiment). Significance was calculated by one-way ANOVA with Tukey's multiple-comparison test, and data are presented as results of comparisons to a no-treatment control (N) unless marked by a horizontal line (*, P < 0.05; **, P < 0.01; ***, P < 0.001).
Inhibition of oxygen consumption suppresses the release of ·NO in macrophages.
To determine if mφ O2 consumption regulates ·NO production and constitutes a mechanism involved in parasite control, we incubated murine mφs with SYL in combination with oligomycin (inhibits ATP synthase and suppresses mitochondrial O2 consumption) or FCCP (uncouples electron transport chain from ATP synthesis and induces maximal O2 consumption) and measured the ·NO level at 18 h posttreatment. Oligomycin treatment abolished the SYL-induced 2-fold increase in ·NO levels in infected mφs (P < 0.01ANOVA-Tukey's, Fig. 8A), while no significant effect of oligomycin was observed on the SYL-induced ROS levels (Fig. 8B). Likewise, FCCP treatment had no inhibitory effects on SYL-induced ·NO release in infected murine mφs (Fig. 8C). These results suggested that ATP-coupled O2 consumption may be a mechanism for ·NO generation by mφs during T. cruzi infection.
FIG 8.

Nitrite oxide release from T. cruzi-infected macrophages requires mitochondrial oxygen consumption. RAW 264.7 mφs were infected with the T. cruzi SylvioX10 isolate and coincubated with 1 μM oligomycin (Oligo; A and B) or 1 μM FCCP (C) for 18 h. Nitric oxide release in culture supernatants was measured by the Griess assay (A and C), and DCF fluorescence (which detects intracellular ROS) was measured by fluorimetry (B). Data are presented as means ± SEM (n ≥ 3 replicates per treatment per experiment), and significance is expressed as results of comparisons to no-treatment controls unless marked by a horizontal line (*, P < 0.05; **, P < 0.01; ***, P < 0.001) calculated by one-way ANOVA with Tukey's multiple-comparison test.
DISCUSSION
In this study, we investigated how levels of mφ activation differed in response to T. cruzi isolates that had been shown to exhibit different levels of virulence in mice (21). We showed that infection with the virulent SYL isolate arrested the mφs in an intermediate proinflammatory state with enhanced TNF-α production, low levels of ROS and ·NO release, and partial utilization of glycolysis and oxidative metabolism at the gene expression and functional levels. Importantly, TCC-infected mφs did not differ from SYL-infected mφs in their capacity to produce TNF-α and ROS; however, the TCC-infected mφs exhibited levels of O2 consumption, oxidative metabolism, and ·NO production that were up to 2-fold higher than those seen with the SYL-infected mφs. These results, to the best of our knowledge, provide the first evidence that mitochondrial O2 consumption constitutes a mechanism for stimulating ·NO production in mφs during T. cruzi infection. We postulate that enhancing the respiratory capacity will provide an attractive strategy for increasing ·NO production and pathogen clearance by mφs to limit disease progression.
The proinflammatory markers TNF-α, ROS, and ·NO are indicators of mφs that have been activated for innate immune defense (22). Indeed, murine and human mφs incubated with LPS/IFN-γ exhibited a >1,000-fold increase in TNF-α production at 3 h (Fig. 1) that was succeeded by a robust (>10-fold) increase in ·NO, extracellular H2O2, and intracellular O2·− generation at 18 h (Fig. 2). Differential levels of activation in human and mouse cells have also been observed by others (23). Importantly, both human and mouse mφs elicited low levels of oxidative (O2·−, H2O2) and nitrosative (·NO) stress upon SYL infection (Fig. 2). Because ROS and NO and their by-products are strong cytotoxic agents that may directly kill the pathogen (24) or influence the cellular function by formation of adducts on DNA, proteins, and lipids (25, 26), our data suggest that T. cruzi diminishes the oxidative/nitrosative response to ensure its survival in mφs. Our finding of inhibition of ROS by DPI (NOX2 inhibitor) and a lack of mitochondrial ROS stimulated by LPS/IFN-γ (Fig. 2H and I) and our prior T. cruzi infection studies in splenocytes and human THP-1 mφs (27, 28) suggest that NOX2 is the major source of ROS in mφs. How SYL diminishes NOX2 activation to control ROS/NO levels remains to be further investigated. Others have suggested that an elaborate antioxidant network comprising peroxiredoxins that scavenge ROS and NO provides a survival advantage to T. cruzi in immune cells (6). These observations, along with our finding of increased NO production in TCC-infected (versus SYL-infected) mφs (Fig. 7), allow us to propose that intraphagosomal ROS and ·NO survival constitutes at least one key mechanism of the parasite's persistence in the host.
Electron transport chain (ETC)-coupled oxidative phosphorylation (OXPHOS) is the main source of ATP energy in eukaryotic cells. The immunomodulatory mφs are long-lived and regulate immune functions such as by clearing immune complexes, suppressing inflammatory responses, and promoting wound healing (13). Our data showed that IL-4-induced immunomodulatory mφs maintained the transcription levels of ETC and OXPHOS complexes, antioxidant responses, and mitochondrial regulatory enzymes and primarily utilized oxidative metabolism to meet the energy demand. The glycolysis product, pyruvate, may be reduced to lactate, resulting in ATP release, or may provide acetyl-coenzyme A (acetyl-CoA) to support the TCA cycle. Our finding of a decline in the oxygen consumption rate (OCR) in IL-4-treated mφs after addition of 2-DG (Fig. 4C.a) suggested that these mφs utilize the glycolytic pathway to drive pyruvate to feed the TCA cycle and generate reduced (NADH/NADPH) energy for oxidative metabolism (29, 30). Our data also suggest that the use of oxidative metabolism in IL-4-induced mφs was not because of an inability to use glycolysis for producing energy, as shown by a metabolic switch to glycolysis after ATP synthase inhibition (Fig. 4D.a). The LPS/IFN-γ-induced proinflammatory mφs solely utilized the glycolytic pathway for meeting the energy demand and shut down the oxidative metabolism at the transcriptional and functional levels (Fig. 3 and 4). How the metabolism is shifted and how it may drive the inflammatory versus immunomodulatory phenotype in mφs remain incompletely understood. Some studies have suggested that poly(ADP-ribose) polymerase 1 (PARP1), a DNA repair enzyme activated by ROS-induced DNA adducts, depletes the NAD+ substrate required for normal activity of sirtuin 1, a metabolic sensor (31, 32), and may activate cells to utilize a glycolytic pathway for energy (33). In our present study, we indeed observed the downregulation of mitoxosome gene expression in mφ stimulated with LPS/IFN-γ; but we noted early metabolic polarization in mφs responding to LPS/IFN-γ and IL-4 at 3 h (Fig. 4A and B) before significant increases in ROS and ·NO levels at 18 h (Fig. 2). This suggests that ROS-induced PARP1 activation would occur after the transcriptional inhibition of mitochondrial oxidative metabolism and may have a role in the maintenance of glycolysis in cells. In the mφs responding to SYL, the metabolic and cytotoxic phenotype was arrested at an intermediate state with an LPS/IFN-γ-like activation of glycolysis with TNF-α production and IL-4-like oxidative metabolism at the gene expression and functional levels and low levels of ROS and NO production. The addition of IFN-γ lifted the T. cruzi-induced metabolic block, which suggests that IFN-γ secreted by nearby cells in an in vivo disease system could aid in the proinflammatory metabolic activation of macrophages for T. cruzi killing. How IFN-γ regulates the metabolic state of the mφs remains to be investigated in future studies.
Secreted factors originating from T. cruzi influence the host cell signaling pathways for successful infection (reviewed in reference 34). One of these soluble proteins, cruzipain, has been found to enhance arginase activity (35), which is a key characteristic in immunomodulatory/IL-4-polarized murine mφs. Trypanosoma phospholipase A1 is a virulence factor that has been shown to generate secondary lipid messengers and to activate protein kinase C (36), an enzyme that promotes glycolysis in B cells (37) in host cells. These T. cruzi molecules may prove to be significant in reducing T. cruzi pathogenesis or improving the mφ response by affecting the metabolic processes.
TCC is a low-pathogenicity T. cruzi strain that has been previously studied for its immunogenicity (38) and was recently found to be controlled by mφs (39). Surprisingly, TCC-treated mφs, instead of switching to a glycolytic pathway for energy demand, consumed more oxygen and exhibited heightened oxidative metabolism at 3 h pi and then produced higher levels of ·NO than SYL-infected mφs. These results suggest that ·NO may contribute to T. cruzi killing as multiple reactive nitrogen species (RNS) (40). High oxygen consumption has been described to correlate with increased ROS levels in neutrophils and PBMCs activated with diverse stimuli (41, 42) and with l-arginine supplementation for endothelial NOS activity (43). Yet, with T. cruzi infection of mφs, we did not observe potent ROS generation but instead observed augmented ·NO production in response to the TCC isolate. Arginase 1 (Arg1) competes with iNOS for arginine for the synthesis of ornithine and polyamines, which results in a net effect of reduced production of RNS (44). Thus, one possibility is that increased O2 consumption diverts the arginine metabolism from Arg1 to ·NO production in TCC-infected mφs; however, the mere increase in O2 consumption caused by FCCP treatment of the SYL-infected mφs did not further increase ·NO production (Fig. 8). Instead, inhibiting ATP synthase and OXPHOS with oligomycin caused a significant decline in ·NO release in infected mφs (Fig. 8). These data suggest that O2 consumption-linked ATP synthesis is important for the generation of ·NO by mφs in response to T. cruzi. Our observation of a direct relationship between OXPHOS and ·NO in T. cruzi-infected mφs differs from the literature wherein others have documented the ·NO as being an antagonist for O2 consumption (45, 46). The kinetics of O2 consumption and ·NO production in T. cruzi-infected mφs will provide further insight into how phagocytes may achieve parasite clearance while preventing overactivation of mitochondrial function and ·NO to ensure host survival.
Antigenic lysates of intracellular pathogens have the potential to activate the inflammatory profile of immune cells. In the context of T. cruzi, prepared lysates are insufficient to activate an inflammatory response in mφs and splenocytes. Human THP-1 mφs were shown to lack induction of IL-1β with either live T. cruzi and T. cruzi lysate stimulation compared to LPS treatment (28). Splenocytes isolated from normal mice respond to T. cruzi lysates with low levels of production of H2O2 that were enhanced only when splenic cells were primed with live T. cruzi before secondary stimulation with T. cruzi lysate (27). Further, expression of the proinflammatory cytokines IL-1β, IL-6, TNF-1α, and IFN-γ and the immunomodulatory cytokine IL-4 was not elicited by T. cruzi lysate treatment compared to no-treatment controls (27). Others have shown that inoculation with heat-killed T. cruzi induced cardiac damage but lacked inflammatory qualities in the heart and splenocytes compared to the results seen with T. cruzi-infected mice (47). These observations suggest that immune cells do not respond to heat-killed T. cruzi or T. cruzi lysates with an enhanced proinflammatory profile compared to live T. cruzi.
In summary, we have investigated the antimicrobial and metabolic responses of mφs to T. cruzi. Our results suggested that ·NO and oxidative metabolism, rather than complete activation of inflammatory phenotypes like those seen with LPS/IFN-γ-treated mφs, may be the key components for the resistance and cytotoxic response of macrophages to T. cruzi. To our knowledge, this is the first report that ·NO formation can be dependent on mitochondrion-linked oxygen consumption in mφs and that mitochondrial respiration can be beneficial in an antimicrobial response by mφs.
Supplementary Material
ACKNOWLEDGMENTS
We thank Tom Wood and the UTMB Molecular Genomics staff for their assistance in designing the mitoxosome array and Maria P Zago (UNSa-CONICET, Argentina) for giving us the TCC isolate. We also thank Alfredo Torres (UTMB) for his gift of THP-1 cells and Tonyia Eaves-Pyles (UTMB) for human PBMC-derived macrophages. We also thank Jian-jun Wen (UTMB) for assistance with chemical reagents and revision of the manuscript.
We declare that we have no competing interests.
Footnotes
Supplemental material for this article may be found at http://dx.doi.org/10.1128/IAI.00809-16.
REFERENCES
- 1.Zingales B, Miles MA, Campbell DA, Tibayrenc M, Macedo AM, Teixeira MM, Schijman AG, Llewellyn MS, Lages-Silva E, Machado CR, Andrade SG, Sturm NR. 2012. The revised Trypanosoma cruzi subspecific nomenclature: rationale, epidemiological relevance and research applications. Infect Genet Evol 12:240–253. doi: 10.1016/j.meegid.2011.12.009. [DOI] [PubMed] [Google Scholar]
- 2.Postan M, Cheever AW, Dvorak JA, McDaniel JP. 1986. A histopathological analysis of the course of myocarditis in C3H/He mice infected with Trypanosoma cruzi clone Sylvio-X10/4. Trans R Soc Trop Med Hyg 80:50–55. doi: 10.1016/0035-9203(86)90193-8. [DOI] [PubMed] [Google Scholar]
- 3.Cura CI, Duffy T, Lucero RH, Bisio M, Peneau J, Jimenez-Coello M, Calabuig E, Gimenez MJ, Valencia Ayala E, Kjos SA, Santalla J, Mahaney SM, Cayo NM, Nagel C, Barcán L, Málaga Machaca ES, Acosta Viana KY, Brutus L, Ocampo SB, Aznar C, Cuba Cuba CA, Gürtler RE, Ramsey JM, Ribeiro I, VandeBerg JL, Yadon ZE, Osuna A, Schijman AG. 2015. Multiplex real-time PCR assay using TaqMan probes for the identification of Trypanosoma cruzi DTUs in biological and clinical samples. PLoS Negl Trop Dis 9:e0003765. doi: 10.1371/journal.pntd.0003765. [DOI] [PMC free article] [PubMed] [Google Scholar]
- 4.Postan M, Dvorak JA, McDaniel JP. 1983. Studies of Trypanosoma cruzi clones in inbred mice. I. A comparison of the course of infection of C3H/HEN- mice with two clones isolated from a common source. Am J Trop Med Hyg 32:497–506. [DOI] [PubMed] [Google Scholar]
- 5.Basombrío MA, Segura MA, Gómez L, Padilla M. 2000. Studies on the virulence and attenuation of Trypanosoma cruzi using immunodeficient animals. Mem Inst Oswaldo Cruz 95(Suppl 1):175–178. doi: 10.1590/S0074-02762000000700029. [DOI] [PubMed] [Google Scholar]
- 6.Alvarez MN, Peluffo G, Piacenza L, Radi R. 2011. Intraphagosomal peroxynitrite as a macrophage-derived cytotoxin against internalized Trypanosoma cruzi: consequences for oxidative killing and role of microbial peroxiredoxins in infectivity. J Biol Chem 286:6627–6640. doi: 10.1074/jbc.M110.167247. [DOI] [PMC free article] [PubMed] [Google Scholar]
- 7.Albareda MC, Laucella SA. 2015. Modulation of Trypanosoma cruzi-specific T-cell responses after chemotherapy for chronic Chagas disease. Mem Instituto Oswaldo Cruz 110:414–421. doi: 10.1590/0074-02760140386. [DOI] [PMC free article] [PubMed] [Google Scholar]
- 8.Zhang L, Tarleton RL. 1999. Parasite persistence correlates with disease severity and localization in chronic Chagas' disease. J Infect Dis 180:480–486. doi: 10.1086/314889. [DOI] [PubMed] [Google Scholar]
- 9.Celentano AM, Gonzalez Cappa SM. 1993. In vivo macrophage function in experimental infection with Trypanosoma cruzi subpopulations. Acta Trop 55:171–180. doi: 10.1016/0001-706X(93)90075-M. [DOI] [PubMed] [Google Scholar]
- 10.Silva GC, Nagib PR, Chiari E, van Rooijen N, Machado CR, Camargos ER. 2004. Peripheral macrophage depletion reduces central nervous system parasitism and damage in Trypanosoma cruzi-infected suckling rats. J Neuroimmunol 149:50–58. doi: 10.1016/j.jneuroim.2003.12.004. [DOI] [PubMed] [Google Scholar]
- 11.Kelly B, O'Neill LA. 2015. Metabolic reprogramming in macrophages and dendritic cells in innate immunity. Cell Res 25:771–784. doi: 10.1038/cr.2015.68. [DOI] [PMC free article] [PubMed] [Google Scholar]
- 12.Blagih J, Jones RG. 2012. Polarizing macrophages through reprogramming of glucose metabolism. Cell Metab 15:793–795. doi: 10.1016/j.cmet.2012.05.008. [DOI] [PubMed] [Google Scholar]
- 13.Huang SC, Everts B, Ivanova Y, O'Sullivan D, Nascimento M, Smith AM, Beatty W, Love-Gregory L, Lam WY, O'Neill CM, Yan C, Du H, Abumrad NA, Urban JF Jr, Artyomov MN, Pearce EL, Pearce EJ. 2014. Cell-intrinsic lysosomal lipolysis is essential for alternative activation of macrophages. Nature Immunol 15:846–855. doi: 10.1038/ni.2956. [DOI] [PMC free article] [PubMed] [Google Scholar]
- 14.Kleinbongard P, Rassaf T, Dejam A, Kerber S, Kelm M. 2002. Griess method for nitrite measurement of aqueous and protein-containing samples. Methods Enzymol 359:158–168. doi: 10.1016/S0076-6879(02)59180-1. [DOI] [PubMed] [Google Scholar]
- 15.Gupta S, Bhatia V, Wen JJ, Wu Y, Huang MH, Garg NJ. 2009. Trypanosoma cruzi infection disturbs mitochondrial membrane potential and ROS production rate in cardiomyocytes. Free Rad Biol Med 47:1414–1421. doi: 10.1016/j.freeradbiomed.2009.08.008. [DOI] [PMC free article] [PubMed] [Google Scholar]
- 16.Wen JJ, Garg NJ. 2008. Mitochondrial generation of reactive oxygen species is enhanced at the Q(o) site of the complex III in the myocardium of Trypanosoma cruzi-infected mice: beneficial effects of an antioxidant. J Bioenerg Biomembr 40:587–598. doi: 10.1007/s10863-008-9184-4. [DOI] [PMC free article] [PubMed] [Google Scholar]
- 17.Wan X, Gupta S, Zago MP, Davidson MM, Dousset P, Amoroso A, Garg NJ. 2012. Defects of mtDNA replication impaired mitochondrial biogenesis during Trypanosoma cruzi infection in human cardiomyocytes and chagasic patients: the role of Nrf1/2 and antioxidant response. J Am Heart Assoc 1:e003855. [DOI] [PMC free article] [PubMed] [Google Scholar]
- 18.Divakaruni AS, Paradyse A, Ferrick DA, Murphy AN, Jastroch M. 2014. Analysis and interpretation of microplate-based oxygen consumption and pH data. Methods Enzymol 547:309–354. doi: 10.1016/B978-0-12-801415-8.00016-3. [DOI] [PubMed] [Google Scholar]
- 19.Vander Heiden MG, Cantley LC, Thompson CB. 2009. Understanding the Warburg effect: the metabolic requirements of cell proliferation. Science 324:1029–1033. doi: 10.1126/science.1160809. [DOI] [PMC free article] [PubMed] [Google Scholar]
- 20.Covarrubias AJ, Aksoylar HI, Horng T. 2015. Control of macrophage metabolism and activation by mTOR and Akt signaling. Semin Immunol 27:286–296. doi: 10.1016/j.smim.2015.08.001. [DOI] [PMC free article] [PubMed] [Google Scholar]
- 21.Piacenza L, Zago MP, Peluffo G, Alvarez MN, Basombrio MA, Radi R. 2009. Enzymes of the antioxidant network as novel determiners of Trypanosoma cruzi virulence. Int J Parasitol 39:1455–1464. doi: 10.1016/j.ijpara.2009.05.010. [DOI] [PMC free article] [PubMed] [Google Scholar]
- 22.Gupta S, Silva TS, Osizugbo JE, Tucker L, Garg NJ. 2014. Serum-mediated activation of macrophages reflects TcVac2 vaccine efficacy against Chagas disease. Infect Immun 82:1382–1389. doi: 10.1128/IAI.01186-13. [DOI] [PMC free article] [PubMed] [Google Scholar]
- 23.Kuprash DV, Udalova IA, Turetskaya RL, Kwiatkowski D, Rice NR, Nedospasov SA. 1999. Similarities and differences between human and murine TNF promoters in their response to lipopolysaccharide. J Immunol 162:4045–4052. [PubMed] [Google Scholar]
- 24.Alvarez MN, Piacenza L, Irigoin F, Peluffo G, Radi R. 2004. Macrophage-derived peroxynitrite diffusion and toxicity to Trypanosoma cruzi. Arch Biochem Biophys 432:222–232. doi: 10.1016/j.abb.2004.09.015. [DOI] [PubMed] [Google Scholar]
- 25.Cardoni RL, Antunez MI, Morales C, Nantes IR. 1997. Release of reactive oxygen species by phagocytic cells in response to live parasites in mice infected with Trypanosoma cruzi. Am J Trop Med Hyg 56:329–334. [DOI] [PubMed] [Google Scholar]
- 26.Piacenza L, Alvarez MN, Peluffo G, Radi R. 2009. Fighting the oxidative assault: the Trypanosoma cruzi journey to infection. Curr Opin Microbiol 12:415–421. doi: 10.1016/j.mib.2009.06.011. [DOI] [PubMed] [Google Scholar]
- 27.Dhiman M, Garg NJ. 2011. NADPH oxidase inhibition ameliorates Trypanosoma cruzi-induced myocarditis during Chagas disease. J Pathol 225:583–596. doi: 10.1002/path.2975. [DOI] [PMC free article] [PubMed] [Google Scholar]
- 28.Dey N, Sinha M, Gupta S, Gonzalez MN, Fang R, Endsley JJ, Luxon BA, Garg NJ. 2014. Caspase-1/ASC inflammasome-mediated activation of IL-1beta-ROS-NF-kappaB pathway for control of Trypanosoma cruzi replication and survival is dispensable in NLRP3−/− macrophages. PLoS One 9:e111539. doi: 10.1371/journal.pone.0111539. [DOI] [PMC free article] [PubMed] [Google Scholar]
- 29.Dashty M. 2013. A quick look at biochemistry: carbohydrate metabolism. Clin Biochem 46:1339–1352. doi: 10.1016/j.clinbiochem.2013.04.027. [DOI] [PubMed] [Google Scholar]
- 30.Carpenter KL, Jalloh I, Hutchinson PJ. 2015. Glycolysis and the significance of lactate in traumatic brain injury. Front Neurosci 9:112. doi: 10.3389/fnins.2015.00112. [DOI] [PMC free article] [PubMed] [Google Scholar]
- 31.Cantó C, Auwerx J. 2011. Interference between PARPs and SIRT1: a novel approach to healthy ageing? Aging 3:543–547. doi: 10.18632/aging.100326. [DOI] [PMC free article] [PubMed] [Google Scholar]
- 32.Ba X, Garg NJ. 2011. Signaling mechanism of PARP-1 in inflammatory diseases. Am J Pathol 178:946–955. [DOI] [PMC free article] [PubMed] [Google Scholar]
- 33.Freemerman AJ, Johnson AR, Sacks GN, Milner JJ, Kirk EL, Troester MA, Macintyre AN, Goraksha-Hicks P, Rathmell JC, Makowski L. 2014. Metabolic reprogramming of macrophages: glucose transporter 1 (GLUT1)-mediated glucose metabolism drives a proinflammatory phenotype. J Biol Chem 289:7884–7896. doi: 10.1074/jbc.M113.522037. [DOI] [PMC free article] [PubMed] [Google Scholar]
- 34.Watanabe Costa R, da Silveira JF, Bahia D. 2016. Interactions between Trypanosoma cruzi secreted proteins and host cell signaling pathways. Front Microbiol 7:388. [DOI] [PMC free article] [PubMed] [Google Scholar]
- 35.Aoki MP, Guinazu NL, Pellegrini AV, Gotoh T, Masih DT, Gea S. 2004. Cruzipain, a major Trypanosoma cruzi antigen, promotes arginase-2 expression and survival of neonatal mouse cardiomyocytes. Am J Physiol Cell Physiol 286:C206–C212. doi: 10.1152/ajpcell.00282.2003. [DOI] [PubMed] [Google Scholar]
- 36.Belaunzarán ML, Wainszelbaum MJ, Lammel EM, Gimenez G, Aloise MM, Florin-Christensen J, Isola EL. 2007. Phospholipase A1 from Trypanosoma cruzi infective stages generates lipid messengers that activate host cell protein kinase C. Parasitology 134(Pt 4):491–502. doi: 10.1017/S0031182006001740. [DOI] [PubMed] [Google Scholar]
- 37.Blair D, Dufort FJ, Chiles TC. 2012. Protein kinase Cbeta is critical for the metabolic switch to glycolysis following B-cell antigen receptor engagement. Biochem J 448:165–169. doi: 10.1042/BJ20121225. [DOI] [PubMed] [Google Scholar]
- 38.Basombrío MA, Segura MA, Nasser JR. 2002. Relationship between long-term resistance to Trypanosoma cruzi and latent infection, examined by antibody production and polymerase chain reaction in mice. J Parasitol 88:1107–1112. doi: 10.1645/0022-3395(2002)088[1107:RBLTRT]2.0.CO;2. [DOI] [PubMed] [Google Scholar]
- 39.Zago MP, Hosakote YM, Koo SJ, Dhiman M, Pineyro MD, Parodi-Talice A, Basombrio MA, Robello C, Garg NJ. 2016. TcI isolates of Trypanosoma cruzi exploit antioxidant network for enhanced intracellular survival in macrophages and virulence in mice. Infect Immun 84:1842–1856. doi: 10.1128/IAI.00193-16. [DOI] [PMC free article] [PubMed] [Google Scholar]
- 40.Jones ML, Ganopolsky JG, Labbe A, Wahl C, Prakash S. 2010. Antimicrobial properties of nitric oxide and its application in antimicrobial formulations and medical devices. Appl Microbiol Biotechnol 88:401–407. doi: 10.1007/s00253-010-2733-x. [DOI] [PubMed] [Google Scholar]
- 41.Dahlgren C, Karlsson A. 1999. Respiratory burst in human neutrophils. J Immunol Methods 232:3–14. doi: 10.1016/S0022-1759(99)00146-5. [DOI] [PubMed] [Google Scholar]
- 42.Hartman ML, Shirihai OS, Holbrook M, Xu G, Kocherla M, Shah A, Fetterman JL, Kluge MA, Frame AA, Hamburg NM, Vita JA. 2014. Relation of mitochondrial oxygen consumption in peripheral blood mononuclear cells to vascular function in type 2 diabetes mellitus. Vasc Med 19:67–74. doi: 10.1177/1358863X14521315. [DOI] [PMC free article] [PubMed] [Google Scholar]
- 43.Gao YT, Roman LJ, Martasek P, Panda SP, Ishimura Y, Masters BS. 2007. Oxygen metabolism by endothelial nitric-oxide synthase. J Biol Chem 282:28557–28565. doi: 10.1074/jbc.M704890200. [DOI] [PubMed] [Google Scholar]
- 44.Norris KA, Schrimpf JE, Flynn JL, Morris SM Jr. 1995. Enhancement of macrophage microbicidal activity: supplemental arginine and citrulline augment nitric oxide production in murine peritoneal macrophages and promote intracellular killing of Trypanosoma cruzi. Infect Immun 63:2793–2796. [DOI] [PMC free article] [PubMed] [Google Scholar]
- 45.Giulivi C, Kato K, Cooper CE. 2006. Nitric oxide regulation of mitochondrial oxygen consumption I: cellular physiology. Am J Physiol Cell Physiol 291:C1225–C1231. doi: 10.1152/ajpcell.00307.2006. [DOI] [PubMed] [Google Scholar]
- 46.Cleeter MW, Cooper JM, Darley-Usmar VM, Moncada S, Schapira AH. 1994. Reversible inhibition of cytochrome c oxidase, the terminal enzyme of the mitochondrial respiratory chain, by nitric oxide. Implications for neurodegenerative diseases. FEBS Lett 345:50–54. [DOI] [PubMed] [Google Scholar]
- 47.Bonney KM, Taylor JM, Daniels MD, Epting CL, Engman DM. 2 February 2011. Heat-killed Trypanosoma cruzi induces acute cardiac damage and polyantigenic autoimmunity. PLoS One 6:e14571. doi: 10.1371/journal.pone.0014571. [DOI] [PMC free article] [PubMed] [Google Scholar]
Associated Data
This section collects any data citations, data availability statements, or supplementary materials included in this article.