

Abstract
Unravelling the main initial dynamics responsible for chiral recognition is a key step in the understanding of many biological processes. However, this challenging task requires a sensitive enantiospecific probe to investigate molecular dynamics on their natural femtosecond time scale. Here we show that, in the gas phase, the ultrafast relaxation dynamics of photoexcited chiral molecules can be tracked by recording time-resolved photoelectron circular dichroism (TR-PECD) resulting from the photoionization by a circularly polarized probe pulse. A large forward–backward asymmetry along the probe propagation axis is observed in the photoelectron angular distribution. Its evolution with pump–probe delay reveals ultrafast dynamics that are inaccessible in the angle-integrated photoelectron spectrum or via the usual electron emission anisotropy parameter (β). PECD, which originates from the electron scattering in the chiral molecular potential, appears as a new sensitive observable for ultrafast molecular dynamics in chiral systems.
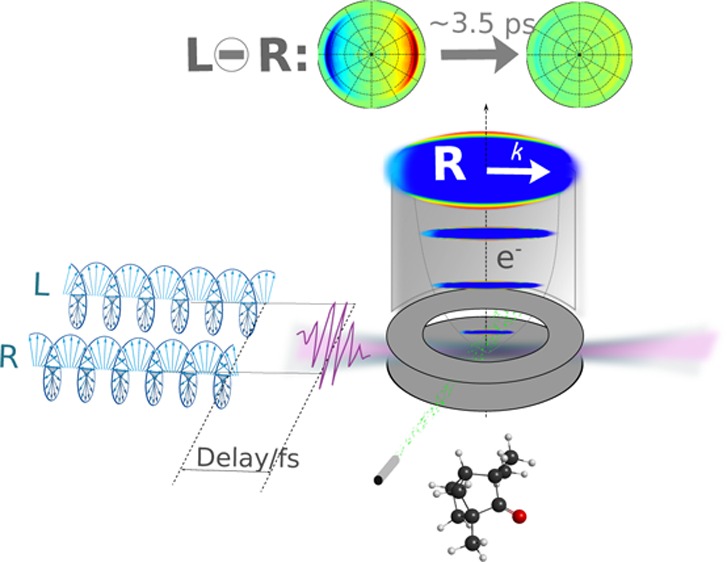
Chiral species exhibit enantio-specific properties when they are embedded into a chiral medium. For instance, chiral molecules interact with each other to form chiral complexes via the so-called chiral recognition process; this “molecular handshake” is at the basis of stereochemistry.1 Enantio-specific properties also arise from the interaction of chiral molecules with “chiral light”, such as circularly polarized light (CPL), leading to various types of circular dichroism (CD).2 As calculated3,4 and experimentally demonstrated,5 CPL-induced photoionization of randomly oriented pure enantiomers gives rise to a forward–backward asymmetry of photoelectron emission along the photon propagation axis k, referred to as photoelectron circular dichroism (PECD). Based upon a differential measurement, this chiroptical effect can be fully described in the pure electric dipole approximation, leading to very strong asymmetries. The outgoing electron scatters in the mean chiral molecular potential involving all the other electrons, mostly the valence ones, which are the main actors of chemical reactivity. This electron scattering occurs in a space whose orientation is referenced by the circularly polarized ionizing field. Despite the random orientation of the molecules, the resulting photoelectron angular distribution shows an intense forward–backward asymmetry. The magnitude of this asymmetry, determined by the interferences between the different partial waves describing the outgoing electron wavepacket, can reach the order of several percent. The sign of this asymmetry reverses with the handedness of the enantiomer (e) or the helicity of the ionizing light (p). PECD is an orbital-specific effect that also depends on the final state, i.e., the photoelectron continuum. It is very sensitive to permanent (isomers, conformers, clustering) and dynamical (vibrational excitation) molecular structures.6 As such, PECD is a useful observable to investigate dynamics in chiral molecules. To date, experiments, mostly synchrotron radiation-based, have focused on the photoionization of molecules from their ground electronic state (S0) in its equilibrium geometry. Recently, a laser-based one-color resonant enhanced multiphoton ionization (REMPI)-PECD scheme involving several intermediate states has been demonstrated; however, time resolution is not included.7−9 The possibility of observing PECD from excited states, for instance loosely bound electronic states, remains an open question. The present Letter focuses on the investigation of PECD from an electronic excited state to establish the sensitivity of PECD as a probe of the ultrafast relaxation taking place in this state. To record time-resolved PECD (TR-PECD), a linearly polarized femtosecond pump pulse photoexcites chiral molecules and a time-delayed circularly polarized femtosecond probe pulse photoionizes them. Key features of this two-color, two-photon experiment are schematized in Figure 1.
Figure 1.

(a) Schematic of the excitation scheme used to measure TR-PECD from the 3s Rydberg state of fenchone. The HOMO and the 3s orbitals are drawn to illustrate the difference in the initial wave function of the outgoing electron. (b) The photoelectron images recorded on (1R)-(−)-fenchone (e = −1) for each probe helicity (LCP-p = 1 or RCP-p = −1) are subtracted one from the other (LCP – RCP) to extract the unnormalized odd Legendre polynomial coefficients, while the sum of these images (LCP + RCP) provides the photoelectron spectrum (PES). These (LCP – RCP) and (LCP + RCP) images, called “difference” and “sum” images, respectively, are shown for three pump–probe delays. Note that the two photon beams are quasi copropagating with polarization axis parallel to the detector (see the Supporting Information).
The target molecule we investigate here is fenchone (C10H16O), a bicyclic ketone whose rigid structure ensures the existence of a single conformer. Fenchone has been extensively studied by vacuum ultraviolet (VUV)-PECD with and without coincidence detection,10,11 by multiphoton,12 above threshold or tunnel ionization9 PECD as well as by absorption circular dichroism.13 However, none of these experiments was time-resolved, and all of them probed a molecule in its ground electronic state defined by its equilibrium geometry, with a possible contribution from the excited states in the REMPI-PECD experiments. The absorption spectrum of fenchone is characterized by a weak valence band around 4.6 eV, followed by strong Rydberg bands starting around 6 eV.13 We chose to excite the molecules to their first Rydberg state (3s) in order to drastically change the initial orbital of the outgoing electron compared to the ground state, as illustrated in Figure 1. The pump pulse spectrum is centered at 6.17 eV with a 30 meV full width half-maximum bandwidth (201 nm, 80 fs duration if Fourier-transform-limited). The probe (403 nm, 35 meV with 70 fs duration) is chosen to photoionize the system ∼0.6 eV above the vertical ionization threshold (IPv = 8.72 eV), in the energy range where the largest VUV PECD has been measured (15%).10 Because the pump pulse is linearly polarized, the sensitivity to chirality comes into play only in the ionization step, via the helicity of the probe pulse.
The photoelectron images are collected by a velocity map imaging detector for alternating probe helicities at each pump–probe delay, as described in Experimental and Computational Methods and the Supporting Information. The momentum distribution of the photoelectrons (angular resolved photoemission spectrum, ARPES) for a probe helicity p = ± 1 (left/right) and one given enantiomer (e) is defined by a function ARPES(p,e)(φ, θ, Ekin) with θ the photoelectron ejection angle with respect to the probe propagation axis k, φ its azimuthal angle, and Ekin its kinetic energy. When a cylindrical symmetry in the emission angle φ of the photoelectron is achieved along an axis parallel to the detector, the ARPES(p,e)(θ,Ekin) distribution is a simple sum of Legendre polynomials [Bi(p,e)(Ekin)Pi(cos(θ))] and can be retrieved from its VMI 2D-projection PROJ(p,e)(θ, Ekin) by using, for instance, a p-Basex analysis.14
Because the Peven Legendre polynomials are symmetric along the optical axis k, the Beven coefficients encode the angular distribution of the standard photoelectron image: the PES is the angle-integrated photoelectron intensity B0(Ekin) and the anisotropy parameter b2(Ekin) = −β/2 (with β the usual anisotropy parameter retrieved for a linearly polarized photoionization). These even parameters do not depend on the laser helicity (p) or enantiomer (e). The Podd Legendre polynomials are antisymmetric along k; consequently, the Bodd(p,e)(Ekin) coefficients are nonzero only for chiral molecules photoionized by elliptically polarized light (p ≠ 0) and encode the PECD. In a two-photon ionization, the sum of Legendre polynomials is expected to go up to P4(cos(θ)), with a drastically reduced B4 in a (1 + 1′) resonant ionization.
In the present experiment, the linear pump polarization as well as the circular probe polarization are defined by quantification axes perpendicular to each other and both parallel to the detector axis. The pump excitation along a well-defined transition dipole induces a loss of isotropy in the molecular target that breaks the φ cylindrical symmetry required to retrieve the ARPES distribution from its VMI 2D-projection PROJ. Nevertheless this cylindrical symmetry is restored in the “difference”-image, defined as PROJ(+1,e)(θ, Ekin) – PROJ(−1,e)(θ, Ekin), obtained by subtracting the images measured with left and right probe polarizations and called (LCP – RCP) images in Figure 1. Fitting this (LCP – RCP) difference-image by p-Basex provides the Bodd(p,e)(Ekin) coefficients (see the Supporting Information).14
To extract PECD, which manifests
itself as an asymmetry in the
photoelectron yield emitted in the forward or backward hemisphere
along the optical axis k for a given
enantiomer and for a given light helicity, normalization by the PES
needs to be done. The normalization of Bi observables yields the bi coefficients (eq 1). As shown in the Supporting Information, the break of cylindrical symmetry prevents access to the “true” B0(Ekin) via a p-Basex
analysis of the “sum”-image, defined as PROJ(+1,e)(θ, Ekin) + PROJ(−1,e)(θ, Ekin) and called (LCP + RCP) images in Figure 1. Nevertheless, we will still use a p-Basex
analysis on this (LCP + RCP) sum-image to obtain B̃0(Ekin), and we use this coefficient
to normalize the Bodd(p,e)(Ekin) coefficients from which we calculate a
circular dichroism of the 2D photoelectron projection. The quantity
we calculate,  , is thus not strictly
the same as the PECD
usually defined in the literature and that has been all recorded without
a break of cylindrical symmetry. For (1R)-(−)-fenchone (e = −1), these definitions are
, is thus not strictly
the same as the PECD
usually defined in the literature and that has been all recorded without
a break of cylindrical symmetry. For (1R)-(−)-fenchone (e = −1), these definitions are
This yields, in terms of Legendre coefficients
with the cylindrical symmetry breaking
| 1 |
Figure 1 shows the difference- and sum-images measured at 1, 4, and 8 ps pump–probe delay. The time and energy dependences of the Bodd(−1) and B̃even coefficients are extracted from these images. A significant forward PECD, i.e., preferential emission of the photoelectron in the k direction, is observed on the difference-images, demonstrating that loosely bound electronic excited states in chiral molecules can lead to strong asymmetric photoionization when driven by CPL. We also see that the sum-images show a preferential emission along the pump polarization. To obtain a time dependence of this anisotropy, we use also the B̃2(Ekin) coefficient extracted from the p-Basex analysis of these sum-images. Similarly to the b̃odd coefficients, normalization of B̃2 by B̃0 is required to obtain b̃2. Note that the b̃2 coefficient cannot be quantitatively used to evaluate the anisotropy of the ARPES, but it will show the same temporal evolution. The B̃4 coefficient in these sum-images is zero, whatever the delay, as expected for a (1 + 1′) resonant photoionization.
Both enantiomers have been studied independently, and the sign of the Bodd(+1) of (1S)-(+) has been reversed to be compared to the (1R)-(−) ones. They are both positive for (1R)-(−) (negative for (1S)-(+)). Figure 2 shows the energy dependences of the Bodd and B̃even for different pump–probe delays. The photoelectrons are emitted with a kinetic energy of 0.52 eV irrespective of the pump–probe delay. This 0.52 eV corresponds to the energy expected at the vertical ionization threshold (hνpump + hνprobe – IPv = 9.24–8.72 eV; see the Supporting Information).
Figure 2.

Unnormalized Legendre coefficients Bodd(−1) and B̃even as a function of the photoelectron kinetic energy and the pump–probe delay in (1R)-(−)-fenchone.
Figure 3shows the time dependences
of b̃odd(−1) and b̃2 coefficients, extracted
from Figure 2 by averaging
the Bi(Ekin) around Ekin = 0.52 eV
over 30 meV and by normalizing these averages by B̃0(Ekin) treated the same way.
The B̃0 coefficient, proportional
to the total number of photoelectron, decays in 3.3 ps while the b̃2 anisotropy slightly increases in magnitude
with a faster rising time, around 2 ps. The asymmetric parameters b̃1 and b̃3(−1) show opposite trends,
with a slow increase of b̃1 over 3.2 ps while b̃3(−1) decreases faster in only 1.4 ps. Using eq 1, the  has the same sign and a magnitude similar
to that observed at that same total energy in single-photon VUV photoionization
(9.3 eV)10 even though the ionization process
is different. In the experiments of ref (10), the outgoing electron was scattered from the
highest occupied molecular orbital (HOMO) in the ground electronic
state potential, while here, the outgoing electron is emitted from
the 3s Rydberg wave function and scatters further from the ionic core.
has the same sign and a magnitude similar
to that observed at that same total energy in single-photon VUV photoionization
(9.3 eV)10 even though the ionization process
is different. In the experiments of ref (10), the outgoing electron was scattered from the
highest occupied molecular orbital (HOMO) in the ground electronic
state potential, while here, the outgoing electron is emitted from
the 3s Rydberg wave function and scatters further from the ionic core.
Figure 3.

Temporal
evolution of b̃odd(−1), b̃2, and b̃0 with empty
markers data recorded on (1R)-(−) enantiomer and filled ones
on (1S)-(+) enantiomer (with a sign inversion on the b̃odd): (a) b̃0 in black and b̃2 in green; (b) b̃1(−1) in blue, b̃3 in red, and  in black. Table 1 summarizes the time constants
extracted
from the fits (see the Supporting Information). When the population in the 3s state starts to be less than 10%
(delay ≥ 7 ps), the normalization by a small B̃0 increases the dispersion of the normalized coefficients.
in black. Table 1 summarizes the time constants
extracted
from the fits (see the Supporting Information). When the population in the 3s state starts to be less than 10%
(delay ≥ 7 ps), the normalization by a small B̃0 increases the dispersion of the normalized coefficients.
Table 1. Time Constants Extracted from the Fits of the Normalized Legendre Polynomial Coefficients b̃i(−1) and b̃2 Dependences Shown in Figure 3a.
| observable | time constant (ps) | converging value of the b̃i(−1) fit at long delay |
|---|---|---|
| B̃0 | 3.28 ± 0.05 | 0 |
| b̃1(−1) | 3.25 ± 0.5 | 0.073 ± 0.017 |
| b̃2 | 2.0 ± 0.3 | – |
| b̃3(−1) | 1.4 ± 0.3 | 0 |
The uncertainties correspond to 50% confidence bounds.
What are the dynamics revealed by these different time scales? The absorption of the pump pulse creates a vibrational wavepacket in the 3s Rydberg state. This wavepacket will undergo vibrational relaxation dynamics toward the equilibrium geometry of the 3s state as illustrated in Figure 4a. In addition, vibronic couplings may occur, leading to internal conversion toward either the lowest valence state (S1) or the ground state (S0), as shown in Figure 4c. Nothing is known about these two ultrafast processes. In the present excitation scheme, the vibrational energy in both S1 (∼1.6 eV) and S0 (∼6 eV) is too high to get significant Franck–Condon factors at only ∼0.5 eV above the IPv. The probe energy is thus not high enough to photoionize molecules vibrationally excited in S0 or in S1.
Figure 4.

(a) Change in the nuclear structure of fenchone from the ground electronic state to the equilibrium geometry of the 3s Rydberg state. The most important relative changes of bond lengths are indicated. The arrow shows the direction of the 3s–S0 transition dipole moment, and the orange axis shows the rotational axis with their rotational dephasing time for 30 K rotational temperature. (b) Different vibrational quantum of fenchone in the 3s state below 1000 cm–1. (c) Relaxation processes revealed in the TR-PECD. (d) Lowest vibrational mode with a quantum of 84 cm–1.
Consequently, the 3.28 ps B̃0 decay mirrors the lifetime of the 3s
Rydberg state and the internal
conversion time scale from 3s to the lower valence states. The b̃1 coefficient is mostly determined by
the Rydberg-electron continuum transition dipole moment, while b̃3, being a higher-order term, will depend
on the anisotropy of excitation created by the pump pulse. Similarly,
a β time dependence within a given electronic state is, in general,
also associated with a decay of the anisotropy of excitation created
by the pump.15,16 The calculations presented in
the Supporting Information predict that
the 3s–S0 transition dipole moment is aligned along
the C1–C3 axis, as shown in Figure 4a. The free rotations of the excited molecules
induce a loss of the anisotropy of excitation, over a time scale defined
by the moments of inertia of the molecules and the rotational temperature
of the gas.17 The moments of inertia of
the asymmetrical top fenchone have been calculated from the S0 geometry to Ix,y,z = 1159, 1555, and 1876 amu·bohr2 with the axis represented in Figure 4a. The decay time due to the anisotropy loss
is typically 1/3 of the dephasing time of the rotational periods  , i.e., between 1.4 and 2.4 ps for Trot ∼ 10–30 K as expected for
an Even–Lavie pulsed valve source.17,18 This is consistent with the 1.4 ps decay measured on b̃3(−1) and the 2 ps on b̃2, confirming
the sensitivity of these two observables to the average laboratory-frame
alignment created by the pump transition. Here, the 3s–S0 dipole moment is almost aligned along the Iy rotational axis. Assigning the time
dependence of b̃3 and b̃2 due to Ix and Iz rotations with
periods similar to that of Iy, is a challenging task beyond the scope of this Letter. This
would require a systematic study for different relative polarizations
of the pump and probe pulses to extract the spherical tensor components
of the photoionization matrix element.
, i.e., between 1.4 and 2.4 ps for Trot ∼ 10–30 K as expected for
an Even–Lavie pulsed valve source.17,18 This is consistent with the 1.4 ps decay measured on b̃3(−1) and the 2 ps on b̃2, confirming
the sensitivity of these two observables to the average laboratory-frame
alignment created by the pump transition. Here, the 3s–S0 dipole moment is almost aligned along the Iy rotational axis. Assigning the time
dependence of b̃3 and b̃2 due to Ix and Iz rotations with
periods similar to that of Iy, is a challenging task beyond the scope of this Letter. This
would require a systematic study for different relative polarizations
of the pump and probe pulses to extract the spherical tensor components
of the photoionization matrix element.
Beyond these global picosecond
dynamics, two different mechanisms
can be inferred from Figure 3: b̃1(−1) is found to reach a minimum, about
0.05 at 400 fs, and later attains a constant value of ∼0.073.
Because of the 3s resonance, this b̃1 coefficient,
appearing in eq 1, is
seen experimentally to be the dominant contribution to the  . Consequently the same
time dependence
is visible on
. Consequently the same
time dependence
is visible on  with a final value converging
to +14.6
± 3.3% for (1R)-(−) enantiomer (details in the Supporting Information). This asymmetry has the
same sign and amplitude as that measured with a single VUV photon
in this same energy range (+15.4%).10 More
relevantly, the
with a final value converging
to +14.6
± 3.3% for (1R)-(−) enantiomer (details in the Supporting Information). This asymmetry has the
same sign and amplitude as that measured with a single VUV photon
in this same energy range (+15.4%).10 More
relevantly, the  value at ∼0 fs
delay in this (1
+ 1′) ionization can be also compared to the (2 + 1) fs-CPL
one recorded on fenchone at 398 nm,7,9 while the b̃odd values can not be because the number
and polarizations of photons used to reach the resonance are different.
In both 0 fs-(1 + 1′) and (2 + 1) fs-CPL ionization, the PECD
observed is in the range of +10%. More experiments are required before
one can conclude whether or not intermediate resonances in REMPI fixes
quantitatively the PECD.
value at ∼0 fs
delay in this (1
+ 1′) ionization can be also compared to the (2 + 1) fs-CPL
one recorded on fenchone at 398 nm,7,9 while the b̃odd values can not be because the number
and polarizations of photons used to reach the resonance are different.
In both 0 fs-(1 + 1′) and (2 + 1) fs-CPL ionization, the PECD
observed is in the range of +10%. More experiments are required before
one can conclude whether or not intermediate resonances in REMPI fixes
quantitatively the PECD.
To come back to the 400 fs time transient
of b̃1(−1), both TD-DFT and SA6-CASSCF(4,7)/aug-cc-pVDZ
calculations predict
that the vibrational wavepacket created by the pump pulse will be
driven by the steepest descent path from the Franck–Condon
region to the minimum-energy region of the 3s potential mostly along
the stretching of the C1–C2 bond of the six carbon cycle, as
illustrated in Figure 4a. This complex vibrational dynamics is expected to take place with
energy flow between different vibrational modes, leading to a larger
diversity of populated vibrational modes. PECD measurements on static
molecules have revealed a high sensitivity to the vibrational excitation
of the cation, with even the possibility of sign inversion, i.e.,
a flipping of the recorded asymmetry, upon excitation of certain vibrational
modes.9,19 In this context, we suggest that the first
400 fs decay observed on b̃1 and  reflects a part of intramolecular
vibrational
relaxation (IVR) taking place in the 3s Rydberg state. Indeed, the
low degree of molecular symmetry does not restrain vibrational interaction
such that fast IVR can take place. A lowering of the
reflects a part of intramolecular
vibrational
relaxation (IVR) taking place in the 3s Rydberg state. Indeed, the
low degree of molecular symmetry does not restrain vibrational interaction
such that fast IVR can take place. A lowering of the  in this short 400 fs
window would result
from the increasing number of populated vibrational modes, with a
priori different contributions to b̃1(−1), both
in magnitude and sign, relative to the vibrational wavepacket created
at 0 fs and thus leading to a blurring of the overall photoelectron
asymmetry. This vibrational relaxation would involve, within the 0.25
eV kinetic energy available in the 3s state, principally the low frequency
vibrational modes, for example, the bending of bicyclic skeleton,
twisting modes, and methyl torsion, all of which are characterized
by large anharmonic couplings. Figure 4b shows the vibrational quanta lower than 1000 cm–1 (0.12 eV), while Figure 4d shows the vibrational mode with the lowest
frequency (at 84 cm–1). The 3s internal conversion
onto lower valence states occurs, however, in a subset of the available
degrees of freedom, meaning that all the vibrational modes populated
directly or by IVR in the 3s state during the first 400 fs do not
relax at the same time.20,21 At long delay, we expect
that only the less efficiently coupled vibrational modes, the spectator
modes of the radiationless transition, will remain populated. It seems
that in fenchone, these spectator modes are related to a larger PECD,
as shown by the rising of the b̃1 over
∼3.25 ps.
in this short 400 fs
window would result
from the increasing number of populated vibrational modes, with a
priori different contributions to b̃1(−1), both
in magnitude and sign, relative to the vibrational wavepacket created
at 0 fs and thus leading to a blurring of the overall photoelectron
asymmetry. This vibrational relaxation would involve, within the 0.25
eV kinetic energy available in the 3s state, principally the low frequency
vibrational modes, for example, the bending of bicyclic skeleton,
twisting modes, and methyl torsion, all of which are characterized
by large anharmonic couplings. Figure 4b shows the vibrational quanta lower than 1000 cm–1 (0.12 eV), while Figure 4d shows the vibrational mode with the lowest
frequency (at 84 cm–1). The 3s internal conversion
onto lower valence states occurs, however, in a subset of the available
degrees of freedom, meaning that all the vibrational modes populated
directly or by IVR in the 3s state during the first 400 fs do not
relax at the same time.20,21 At long delay, we expect
that only the less efficiently coupled vibrational modes, the spectator
modes of the radiationless transition, will remain populated. It seems
that in fenchone, these spectator modes are related to a larger PECD,
as shown by the rising of the b̃1 over
∼3.25 ps.
This interpretation requires theoretical support with calculations of TR-PECD that include vibrations; this is far beyond the present state-of-the-art. In particular, our results indicate that PECD would be very sensitive to the initial vibrational states, while previous investigations considered only the effect of vibrational excitation of the final cationic state.19,22
The  from the 3s Rydberg
state (∼14.6
± 3.3%) is as strong as the PECD recorded from the ground electronic
state (15.4%). The
from the 3s Rydberg
state (∼14.6
± 3.3%) is as strong as the PECD recorded from the ground electronic
state (15.4%). The  magnitude obtained at
large delays is rather
impressive, considering that the 3s outgoing Rydberg electron scatters
less often in the inner part of the molecular potential but more often
at distance further from the chiral carbons compared to an electron
outgoing from the HOMO ground-state orbital. This shows that the phases
of partial wave functions can be determined by their values far from
the ionic core and that PECD is thus a very long-range probe of the
whole molecular potential, as already observed in one-photon PECD,
for instance in clusters.23,24 At the same time, by
using a pump step, partial alignment is achieved, and when a Rydberg
state is excited, a smaller number of angular momentum components
are required to describe the photoelectron continuum. It would be
interesting to investigate these two latter conditions to determine
their respective impact on the large asymmetry that is observed here.
magnitude obtained at
large delays is rather
impressive, considering that the 3s outgoing Rydberg electron scatters
less often in the inner part of the molecular potential but more often
at distance further from the chiral carbons compared to an electron
outgoing from the HOMO ground-state orbital. This shows that the phases
of partial wave functions can be determined by their values far from
the ionic core and that PECD is thus a very long-range probe of the
whole molecular potential, as already observed in one-photon PECD,
for instance in clusters.23,24 At the same time, by
using a pump step, partial alignment is achieved, and when a Rydberg
state is excited, a smaller number of angular momentum components
are required to describe the photoelectron continuum. It would be
interesting to investigate these two latter conditions to determine
their respective impact on the large asymmetry that is observed here.
In conclusion, we have shown that a large  (>10%) could be observed in photoionization
from excited chiral molecules even if the outgoing electron is emitted
from an extended wave function such as a Rydberg state. Furthermore,
we have demonstrated that time-resolved PECD could be used as a sensitive
probe of ultrafast dynamics in chiral molecules with femtosecond resolution.
The different Legendre coefficients reveal dynamics related to alignment
(b̃3(−1)), vibrational relaxation (b̃1), as well as electronic conversion (B̃0); all behave independently with different time constants.
Only the b̃1(−1) observable appears here sensitive
to subpicosecond dynamics such as IVR.
(>10%) could be observed in photoionization
from excited chiral molecules even if the outgoing electron is emitted
from an extended wave function such as a Rydberg state. Furthermore,
we have demonstrated that time-resolved PECD could be used as a sensitive
probe of ultrafast dynamics in chiral molecules with femtosecond resolution.
The different Legendre coefficients reveal dynamics related to alignment
(b̃3(−1)), vibrational relaxation (b̃1), as well as electronic conversion (B̃0); all behave independently with different time constants.
Only the b̃1(−1) observable appears here sensitive
to subpicosecond dynamics such as IVR.
In particular, odd coefficients, such as b̃1 which is fully proportional to the sine of dephasing between adjacent outgoing waves,25 are much more sensitive to the whole molecular potential than even parameters such as B̃0. TR-PECD provides new and richer opportunities to template molecular dynamics in chiral systems in comparison to previous time-resolved angle-resolved PES on achiral samples involving only PES and the classical β anisotropy parameter. The ability to probe complex ultrafast relaxation in chiral systems opens up concrete possibilities for the investigation of molecular dynamics such as transient chirality or nuclear motions involved in chiral recognition. These results present a stepping stone for time-resolved chirality and more generally to establish a femtochemistry based on circular polarizations.
Experimental and Computational Methods
An Even–Lavie valve is used as a pulsed enantiopure fenchone source with helium as carrier gas to avoid cluster formation. The experiment was performed using the Aurore laser system at CELIA, which delivers 20 mJ, 25 fs, 800 nm pulses at 1 kHz. Only 2 mJ is used in the present experiment. The presented results are obtained by scanning the pump–probe delays typically 16 times, and at each delay, one helicity image is a record over 45 000 laser shots. For each scan, two background images corresponding to the probe pulse alone in each helicity are recorded and subtracted from each image of each delay for a given helicity. This background subtraction is required for the longest pump–probe delay when the signal reaches zero (see Figure S4 of the Supporting Information). High-level quantum chemistry calculations, using Gaussian 09, Molpro, and GAMESS-US quantum chemistry packages, have been performed on the ground and first five electronic excited states of fenchone to help in the interpretation of the experimental data. All the computational details and results can be found in the Supporting Information.
Acknowledgments
This work was financially supported by Agence Nationale de la Recherche (ANR) (ANR-14-CE32-0014 MISFITS) and Université of Bordeaux. This project has received funding from the European Research Council (ERC) under the European Union’s Horizon 2020 research and innovation programme no. 682978 - EXCITERS. The authors thank R. Bouillaud and L. Merzeau for their technical assistance, E. Mével and E. Constant for providing key apparatus to the experiment, and Gustavo Garcia for stimulating discussions. S.B. acknowledges the support of a NSERC Vanier Canada Graduate Scholarship.
Supporting Information Available
The Supporting Information is available free of charge on the ACS Publications website at DOI: 10.1021/acs.jpclett.6b02065.
The authors declare no competing financial interest.
Supplementary Material
References
- Zehnacker A.; Suhm M. Chirality recognition between neutral molecules in the gas phase. Angew. Chem., Int. Ed. 2008, 47, 6970–6992. 10.1002/anie.200800957. [DOI] [PubMed] [Google Scholar]
- Circular Dichroism: Principles and Applications, 2nd ed.; Berova N., Nakanishi K., Woody R., Eds.; Wiley-VCH: New York, 2000. [Google Scholar]
- Ritchie B. Theoretical studies in photoelectron spectroscopy. Molecular optical activity in the region of continuous absorption and its characterization by the angular distribution of photoelectrons. Phys. Rev. A: At., Mol., Opt. Phys. 1975, 12, 567–574. 10.1103/PhysRevA.12.567. [DOI] [Google Scholar]
- Powis I. Photoelectron circular dichroism of the randomly oriented chiral molecules glyceraldehyde and lactic acid. J. Chem. Phys. 2000, 112, 301–310. 10.1063/1.480581. [DOI] [Google Scholar]
- Böwering N.; Lischke T.; Schmidtke B.; Müller N.; Khalil T.; Heinzmann U. Asymmetry in photoelectron emission from chiral molecules induced by circularly polarized light. Phys. Rev. Lett. 2001, 86, 1187–1190. 10.1103/PhysRevLett.86.1187. [DOI] [PubMed] [Google Scholar]
- Nahon L.; Garcia G. A.; Powis I. Valence shell one-photon photoelectron circular dichroism in chiral systems. J. Electron Spectrosc. Relat. Phenom. 2015, 204, 322–334. 10.1016/j.elspec.2015.04.008. [DOI] [Google Scholar]
- Lux C.; Wollenhaupt M.; Bolze T.; Liang Q.; Köhler J.; Sarpe C.; Baumert T. Circular dichroism in the photoelectron angular distributions of camphor and fenchone from multiphoton ionization with femtosecond laser pulses. Angew. Chem., Int. Ed. 2012, 51, 5001–5005. 10.1002/anie.201109035. [DOI] [PubMed] [Google Scholar]
- Lehmann C. S.; Ram N. B.; Powis I.; Janssen M. H. M. Imaging photoelectron circular dichroism of chiral molecules by femtosecond multiphoton coincidence detection. J. Chem. Phys. 2013, 139, 234307. 10.1063/1.4844295. [DOI] [PubMed] [Google Scholar]
- Beaulieu S.; Ferré A.; Géneaux R.; Canonge R.; Descamps D.; Fabre B.; Fedorov N.; Légaré F.; Petit S.; Ruchon T.; et al. Universality of photoelectron circular dichroism in the photoionization of chiral molecules. New J. Phys. 2016, 18, 102002. 10.1088/1367-2630/18/10/102002. [DOI] [Google Scholar]
- Nahon L.; Nag L.; Garcia G.; Myrgorodska I.; Meierhenrich U. J.; Beaulieu S.; Wanie V.; Blanchet V.; Géneaux R.; Powis I. Determination of accurate electron chiral asymmetries in fenchone and camphor in the VUV range: sensitivity to isomerism and enantiomeric purity. Phys. Chem. Chem. Phys. 2016, 18, 12696–12706. 10.1039/C6CP01293K. [DOI] [PubMed] [Google Scholar]
- Ferré A.; Handschin C.; Dumergue M.; Burgy F.; Comby A.; Descamps D.; Fabre B.; Garcia G. A.; Géneaux R.; Merceron L.; et al. A table-top ultrashort light source in the extreme ultraviolet for circular dichroism experiments. Nat. Photonics 2015, 9, 93–98. 10.1038/nphoton.2014.314. [DOI] [Google Scholar]
- Lux C.; Wollenhaupt M.; Sarpe C.; Baumert T. Photoelectron circular dichroism of bicyclic ketones from multiphoton ionization with femtosecond lLaser pulses. ChemPhysChem 2015, 16, 115–137. 10.1002/cphc.201402643. [DOI] [PubMed] [Google Scholar]
- Pulm F.; Schramm J.; Hormes J.; Grimme S.; Peyerimhoff S. Theoretical and experimental investigations of the electronic circular dichroism and absorption spectra of bicyclic ketones. Chem. Phys. 1997, 224, 143–155. 10.1016/S0301-0104(97)00258-9. [DOI] [Google Scholar]
- Garcia G. A.; Nahon L.; Powis I. Two-dimensional charged particle image inversion using a polar basis function expansion. Rev. Sci. Instrum. 2004, 75, 4989–4996. 10.1063/1.1807578. [DOI] [Google Scholar]
- Tsubouchi M.; Whitaker B.; Wang L.; Kohguchi H.; Suzuki T. Photoelectron imaging on time-dependent molecular alignment created by a femtosecond laser pulse. Phys. Rev. Lett. 2001, 86, 4500–4503. 10.1103/PhysRevLett.86.4500. [DOI] [PubMed] [Google Scholar]
- Stolow A.; Underwood J. Time-resolved photoelectron spectroscopy of nonadiabatic dynamics in polyatomic molecules. Advances in Chemical Physics, Vol 139 2008, 139, 497–583. 10.1002/9780470259498.ch6. [DOI] [Google Scholar]
- Blokhin A.; Gelin M.; Khoroshilov E.; Kryukov I.; Sharkov A. Dynamics of optically induced anisotropy in an ensemble of asymmetric top molecules in the gas phase. Opt. Spectrosc. 2003, 95, 346–352. 10.1134/1.1612994. [DOI] [Google Scholar]
- Horke D. A.; Chatterley A. S.; Bull J. N.; Verlet J. R. R. Time-resolved photodetachment anisotropy: gas-phase rotational and vibrational dynamics of the fluorescein anion. J. Phys. Chem. Lett. 2015, 6, 189–194. 10.1021/jz5022526. [DOI] [PubMed] [Google Scholar]
- Garcia G. A.; Nahon L.; Daly S.; Powis I. Vibrationally induced inversion of photoelectron forward-backward asymmetry in chiral molecule photoionization by circularly polarized light. Nat. Commun. 2013, 4, 2132. 10.1038/ncomms3132. [DOI] [PMC free article] [PubMed] [Google Scholar]
- Sǒlling T. I.; Kuhlman T. S.; Stephansen A. B.; Klein L. B.; Mǒller K. B. The non-ergodic nature of internal conversion. ChemPhysChem 2014, 15, 249–259. 10.1002/cphc.201300926. [DOI] [PubMed] [Google Scholar]
- Wende T.; Liebel M.; Schnedermann C.; Pethick R. J.; Kukura P. Population-controlled impulsive vibrational spectroscopy: background- and baseline-free Raman spectroscopy of excited electronic states. J. Phys. Chem. A 2014, 118, 9976–9984. 10.1021/jp5075863. [DOI] [PubMed] [Google Scholar]
- Powis I. Communication: The influence of vibrational parity in chiral photoionization dynamics. J. Chem. Phys. 2014, 140, 111103. 10.1063/1.4869204. [DOI] [PubMed] [Google Scholar]
- Nahon L.; Garcia G. A.; Soldi-Lose H.; Daly S.; Powis I. Effects of dimerization on the photoelectron angular distribution parameters from chiral camphor enantiomers obtained with circularly polarized vacuum-ultraviolet radiation. Phys. Rev. A: At., Mol., Opt. Phys. 2010, 82, 032514. 10.1103/PhysRevA.82.032514. [DOI] [Google Scholar]
- Powis I.; Daly S.; Tia M.; Miranda B. C. d.; Garcia G. A.; Nahon L. A photoionization investigation of small, homochiral clusters of glycidol using circularly polarized radiation and velocity map electron-ion coincidence imaging. Phys. Chem. Chem. Phys. 2013, 16, 467–476. 10.1039/C3CP53248H. [DOI] [PubMed] [Google Scholar]
- Powis I. Photoelectron circular dichroism in chiral molecules. Advances in Chemical Physics 2008, 267–329. 10.1002/9780470259474.ch5. [DOI] [PubMed] [Google Scholar]
Associated Data
This section collects any data citations, data availability statements, or supplementary materials included in this article.