

Abstract
Background & objectives:
Despite the rising prevalence of non-communicable diseases (NCDs) in rural India, data on the dietary profile of the rural Indian population in relation to the recommendations for prevention of NCDs are scarce. This study was conducted to assess the dietary intake of a rural south Indian population in relation to the current dietary recommendations for the prevention of NCDs.
Methods:
The dietary profiles of 6907 adults aged ≥ 20 yr, from a cluster of 42 villages in Kancheepuram district of Tamil Nadu State in southern India, were assessed using a validated food frequency questionnaire.
Results:
The prevalence of general obesity was 27.4 per cent and that of abdominal obesity, 14.0 per cent among this rural population. The median daily energy intake of the population was 2034 (IQR 543) kcals. More than 3/4th of the calories (78.1%) were provided by carbohydrates. Refined cereals, mainly polished rice, was the major contributor to total calories. About 45 per cent of the population did not meet WHO recommendation for protein due to low intake of pulses, flesh foods and dairy products and more than half (57.1%) exceeded the limit of salt intake; 99 per cent of the population did not meet WHO recommendations for fruits and vegetables and 100 per cent did not meet the requirement of n-3 poly unsaturated fatty acids.
Interpretation & conclusions:
The dietary profile of this rural south Indian population reflected unhealthy choices, with the high consumption of refined cereals in the form of polished white rice and low intake of protective foods like fruits, vegetables, n-3 poly and monounsaturated fatty acids. This could potentially contribute to the increase in prevalence of NCDs like diabetes, hypertension and cardiovascular diseases in rural areas and calls for appropriate remedial action.
Keywords: Diabetes, dietary intake, non-communicable diseases, rural, south India
India is currently in the midst of rapid socio-economic, demographic, nutrition and health transition. Consequently, non-communicable diseases (NCDs) like diabetes, hypertension and cardiovascular disease have emerged as major public health problems, with wide differences in prevalence rates between urban and rural areas1. In the last two decades, the prevalence of diabetes has been rising rapidly among both urban and rural Indians2,3. In addition to a genetic predisposition, the increase in the prevalence of NCDs in developing countries has been attributed to the nutrition transition, characterized by changes in dietary habits, combined with a decrease in physical activity levels4.
In India, the National Sample Survey Organization (NSSO)5 collects large-scale data on food consumption based on consumer expenditure and the National Family Health Surveys (NFHSs)5 provide indicators of the populations’ health and nutritional status at the national and State levels. The National Nutrition Monitoring Bureau (NNMB) assesses the food and nutrient intake and the nutritional status of the rural/urban/tribal population in the country6. These surveys are massive exercises and have reported on the prevalence of diabetes, hypertension and obesity. However, these were not specifically designed to bring out the relation of diet to chronic diseases or to formulate dietary guidelines for prevention of NCDs such as diabetes. There are some studies from the urban Indian population which have shown that diets high in refined cereals and low in fruits and vegetables are associated with increased risk of metabolic syndrome, type 2 diabetes mellitus (T2DM) and coronary heart disease7,8. However, such data are sparse from rural populations in India. Therefore, the present study was undertaken to assess the dietary intake of a rural south Indian population in relation to the dietary recommendations for the prevention of NCDs laid down by both national and international authorities. It was also aimed to compare the dietary intake of rural subjects with our previously studied urban south Indian population from the same State9.
Material & Methods
The participants were recruited from the rural component of the Chennai Urban Rural Epidemiological Study (CURES), which was conducted in 42 villages in Kancheepuram district of Tamil Nadu State in Southern India during the period 2007-201010. Our rural centre was located in the centre of these 42 villages and the staff and villagers had good rapport. In these 42 villages, the total number of adults aged ≥20 yr was 27012. We invited every third participant (n = 9004) to participate in the study and of these, 7331 participants completed detailed dietary assessment (response rate 81.4%). As the present study was aimed to compare the dietary profile with dietary recommendations for prevention of NCDs, participants with a self-reported history of diabetes (n=363) and those with unrealistic reported energy intake [<500 and >3500 kcal/day for female and <800 and >4000 kcal/day for male; (n=61)] were excluded11. Thus, a total of 6907 participants were included for the final analysis.
For comparison with previously surveyed urban adults (urban component of CURES), the anthropometric measures and dietary intake of the previously studied urban population comprising 1882 individuals aged ≥20 yr from the Chennai Urban Rural Epidemiological Study was used (2005-2007)9. The WHO recommendations on dietary guidelines to prevent NCDs12 and the national dietary guidelines for a balanced Indian diet for the occupation based physical activity13,14 were considered to evaluate the dietary intake of the study population. The study protocol was approved by the institutional Ethics committee of the Madras Diabetes Research Foundation and written informed consent was obtained from all study participants.
Anthropometric measurements including height, weight and waist measurements were obtained using standardized techniques as described earlier15.
Development of the food frequency questionnaire (FFQ): The previously validated CURES food frequency questionnaire (FFQ) for urban population16 was modified to include all the additional rural food choices and to exclude foods which were not relevant in the rural areas, based on 24 h diet recalls collected from a pilot study on 100 rural participants from the study area. Related food items were grouped together to reduce the length of the questionnaire and nutrient intake was calculated with the in-house EpiNu database, which is based on Nutritive Value of Indian Foods (Indian Council of Medical Research, ICMR)14, U.S. Department of Agriculture (USDA)17 and other published sources. Data on the seasonal availability of fruits and vegetables were obtained from rural vendors and the values were used to convert reported seasonal intakes into average intakes throughout the year. The final meal based FFQ comprising 106 items, including alcohol intake was developed and used for the present study.
The respondents were asked how often over a 1-year period they ate or drank each food or beverage listed with the standard portion size, allowing the respondent to record their usual serving size (total quantity of each of the listed food item eaten at one occasion) and the frequency of eating (per day/week/month/year or never). Visual aids such as household cups, bowls, ladles, spoons, wedges (to estimate slices of cake and fruits) and circles of different diameters (to estimate the portion sizes of foods such as idly or dosa) were used. Added sugar and added salt refer to the sugar and salt added on the table and during food preparations. The interviewers were well trained for appropriate conversions if the respondent gave alternate portion sizes. An individual's average daily food and nutrient intake was further computed using the in-house EpiNu database. Glycaemic index (GI) was considered for those foods where the published values were available from the international GI table18. The GI of the foods was measured using the international protocol laid by FAO/WHO19 and also the GI derived for mixed meals using the same protocol. These GI values were added in the in-house EpiNu database and used in the FFQ for calculation of GI of each carbohydrate food being reported. The dietary GI was further calculated as: Weighted dietary glycaemic index (GI) for each participant =

The glycaemic load (GL) of the individual food was calculated by multiplying the dietary GI with the total amount of available carbohydrate intake and multiplied by the frequency of consumption. The value was summed to obtain average daily dietary GL.
Reproducibility and validity of food frequency questionnaire (FFQ): Prior to undertaking the study of the 42 villages, three villages were randomly selected; and from these three villages, 128 randomly selected participants completed the rural FFQ. FFQs were taken at 0, 6 and 12 (FFQ3) monthly intervals to assess the reproducibility. The unadjusted intra-class correlation (ICC) for all the three FFQs was in the range of 0.63 to 0.76 for macronutrients; 0.78 for energy and among the micronutrients, 0.66 for calcium and 0.47 for beta carotene.
To assess the validity of the questionnaire, six 24 h diet recalls at 2-monthly intervals over a period of one year were obtained and the mean daily intakes of food and nutrients were computed. Spearman correlation coefficient (r) and Wilcoxon signed rank paired t test were applied between the FFQ and the average of six 24 h recalls. All the nutrients and food groups were energy adjusted by using residual method11. For the macronutrients, the Spearman correlation for energy was 0.58, followed by 0.31 (P=0.62) for carbohydrate and 0.40 (P=0.38) for protein. The correlation for GI was 0.38 (P=0.05); GL 0.59 (P=0.50); total fat 0.28 (P=0.82) and dietary fibre 0.34 (P=0.54), respectively whereas for micronutrients it ranged from 0.20 (P=0.52) (iron) to 0.27 (P=0.39) (calcium). The correlation for food groups were 0.25 (P=0.25) for refined cereals; 0.65 (P=0.06) for whole cereals; 0.21 (P=0.29) for pulses and legumes; 0.54 (P=0.59) for fats and edible oil; 0.43 (P=0.57) for fruits and 0.23 (P=0.50) for vegetables, 0.40 (P=0.67) for meat and poultry, 0.15 (P=0.08) for added salt and 0.37 (P=0.14) for added sugar.
Statistical analysis: All analyses were conducted using the SPSS statistical package, (Version 17, Chicago, IL). The data were stratified by gender, rural and urban wherever appropriate. Normality was tested by Kolmogorov-Smirnov test. The present study data were not normally distributed and hence median and inter quartile range (IQR) were considered for continuous variables while for categorical variables, test of proportion was used. Mann-Whitney U test was used to compare continuous variables, and the Chi-square test was used to compare the proportion among the groups. All tests of significance were two-tailed and P<0.05 was considered significant.
Results
Table I shows the general characteristics and food consumption of rural population, of whom 58 per cent were women. The median age and BMI were 40 (IQR 20.0) years and 20.6 (IQR 4.9) kg/m2, respectively. Men were significantly older (P<0.001) than women. The prevalence of general obesity was 27.4 per cent and that of abdominal obesity, 14.0 per cent among this rural population. Women had significantly higher central abdominal obesity and generalized obesity compared to men. Fewer women consumed alcohol or smoked compared to men. Two thirds of women and half of men reported monthly income as <2000  . Total energy, carbohydrate, protein, fat and dietary fibre intake were significantly higher among men. On the whole, men reported higher amounts of all food groups compared to women. Refined cereal (443.6 g/day) emerged as the major contributor to total energy (73.3%) and total carbohydrate (86.2%) intake. Intake of whole cereals (whole wheat flour) (3.3 g/day), millets (3.3 g/day), fruits and vegetables (98.4 g/day), tubers (15.9 g/day) and sugars (3.7 g/day) was low.
Table I.
General characteristics and food consumption among rural men and women (n=6907)
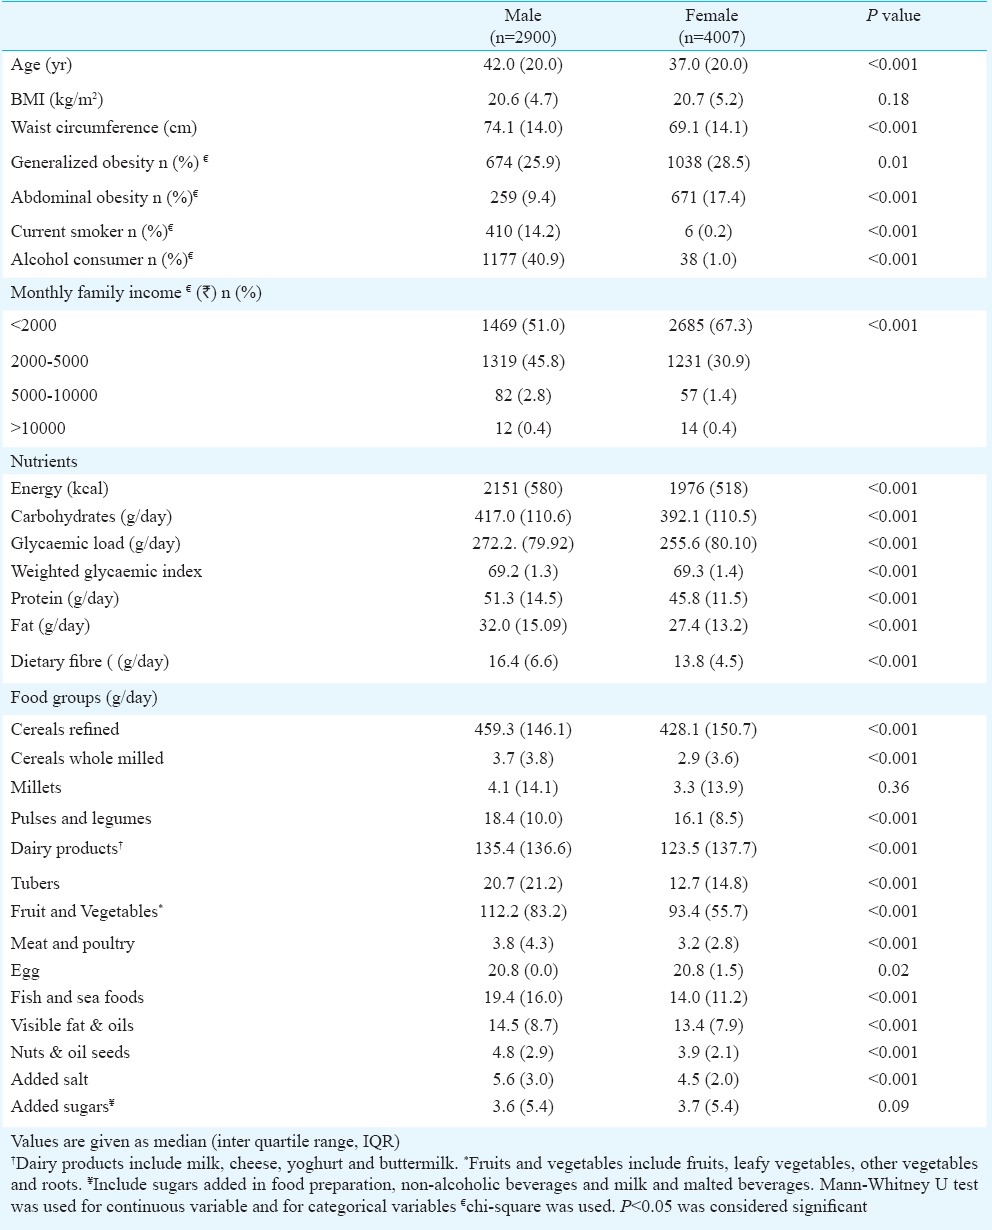
The gender wise dietary intake of rural population was compared with the earlier studied urban population9. Rural males were older compared to urban whereas the ages of females were similar. The BMI and waist circumference (WC) of urban population were significantly higher compared to rural population. Both generalized and abdominal obesity were significantly higher in urban participants compared to their rural counterparts. Both generalized and abdominal obesity were higher in females compared to males both in rural and urban areas. Refined cereal intake was significantly higher in rural population (459.4 g/day in males and 428.1 g/day in females) compared to percentage of their urban counterparts (363.4 g/day in males and 295.6 g/day in females) which contributed to higher (percentage of E energy) from carbohydrates in rural (77.9% E and 78.3%) E in rural males and females, respectively). However, the total daily energy intake and per cent E contributed by fat, protein and dietary fibre were significantly lower in the rural population. Intake of whole cereals, pulses, dairy products, meat, fruits and vegetables, fat and oils, added salt and sugars was significantly higher (P<0.001) in the urban population whereas millet consumption was very low in both urban and rural populations.
Table II shows the median dietary intakes of the study population compared with the WHO recommendations for the prevention of NCDs12; 74.7 per cent of the population exceeded the WHO recommendation for carbohydrates while 45.4 per cent did not meet the WHO recommendation for protein intake. More than half of the rural population (57.1%) exceeded the recommended salt intake and almost all (99.9%) did not meet the recommendations for fruits and vegetables intake and 100 per cent did not meet the recommended n-3 PUFA (polyunsaturated fatty acid) intake which results in higher n6/n3 ratios.
Table II.
Comparisons of dietary intakes of study population with WHO recommendations for the prevention of chronic diseases
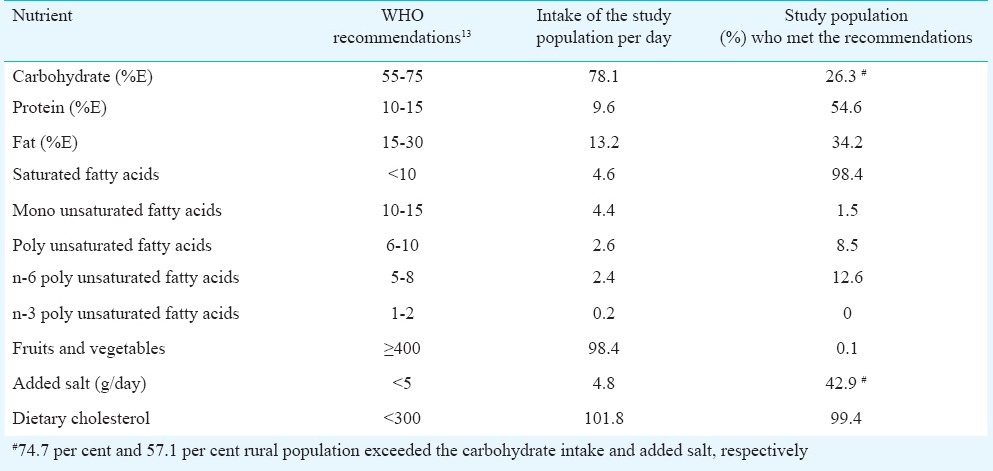
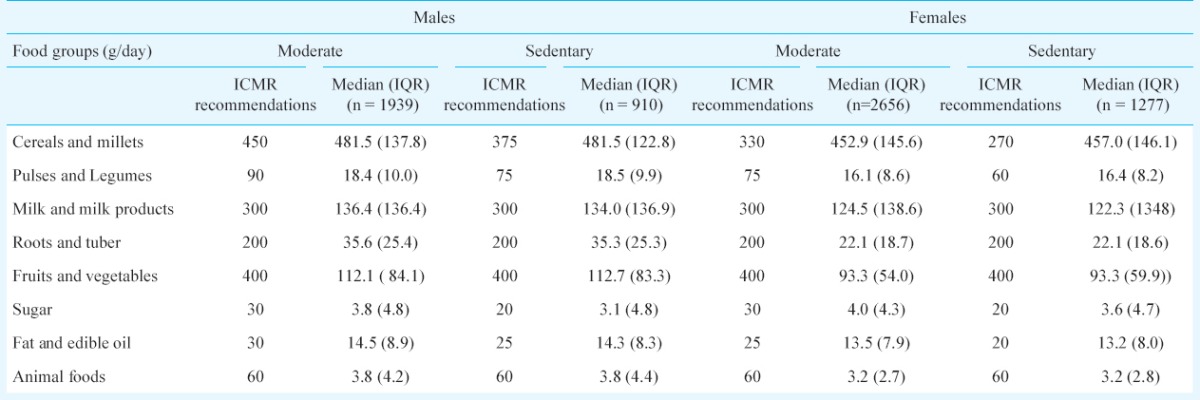
Table III compares the dietary intake according to the occupation based physical activity levels (sedentary or moderate) as recommended by the ICMR13,14. Almost 66 per cent of males and females were engaged in moderate physical activity and 32 per cent were sedentary. As only 2 per cent of rural adults were found to engage in vigorous physical activity, they were not included in the present analysis. The findings revealed unhealthy dietary trends, with excess refined cereal intake and low intake of pulses and legumes, dairy products and fruit and vegetables when stratified by gender and both among the sedentary and moderate physical activity groups.
Table III.
Food intake (g/day) of rural population according to their physical activity levels compared with ICMR recommendations14,15
Discussion
Overall, our study indicates that the dietary intake of this rural south Indian population was conducive to the development of metabolic NCDs such as diabetes, hypertension and heart disease because of high refined cereal intake and low intake of protein, fruits and vegetables, n-3 PUFA and mono unsaturated fatty acids (MUFA), compared to both international (WHO)12 and national (ICMR) recommendations13,14.
Similar trends of dietary intake have been reported by NNMB surveys20. However, NNMB and NSSO did not differentiate between refined and coarse cereals and millets. The main source of refined cereals in our study population was in the form of polished white rice. A similar trend was reported in China by Popkin4 who attributed the shift from coarse grains to refined grains to the nutrition transition. Refined cereals like rice and wheat have lower dietary fibre and higher glycaemic index21. The low dietary fibre intake showed a significant positive association with total cholesterol and LDL - cholesterol in the urban south Indian population22.
The consumption of pulses was lower than the recommended level and much less in the rural population compared to urban areas9. The NNMB surveys also showed a decline in pulse consumption in rural areas (34 g/day in 1975-79 to 28 g/day in 2004-05)20. Increasing the intake of pulses and legumes in the Indian diets would not only improve the protein intake and hence build muscle mass, but also possibly prevent NCDs like diabetes among the population at risk as the carbohydrate intake and thus the glycaemic load would decrease23.
The consumption of fruits and vegetables was much lower than the ICMR/WHO recommendations to prevent NCDs in India12,13. There was also a significantly lower consumption of fruit and vegetables in the rural, compared to urban population. The very low intake and seasonal variations may be responsible for the poor reproducibility of fruits and vegetable intake in the rural population which limits the assessment of micronutrient intake24. Kinra et al25 reported that 69 per cent of men and 75 per cent of women in rural India had a fruit and vegetable intake of <400 g/day. Studies have shown reduced risk of T2DM and cardiovascular diseases (CVD) with increase in fruit and vegetable intake7,26.
The consumption of dairy products was much lower than the ICMR recommendation of 300 ml/ day. Dietary calcium intake from dairy products is associated with decrease in systolic and diastolic blood pressure27, and lower incidence of T2DM28. Therefore, it would seem prudent to advocate an increase in dairy products among this population. Meat consumption was also low. However, perhaps due to the proximity of the selected villages to the sea coast, there was a relatively higher consumption of fish among this population, which was comparable to the ICMR recommendations of 100-200 g/wk.
The consumption of sugar was lower than the ICMR recommended intake of 30 g/day and also less than the NNMB reported rural intake of 14 g/day. This rural population reported very low consumption of sweets, tea, coffee and added sugar and thus direct sugar intake was not yet a cause of concern. In contrast, fat and sugar intake was higher among the urban population, due to higher consumption of processed foods, coffee and tea and higher visible fat intake9. Another cause for concern was that more than half the population had a salt intake higher than WHO recommendations. Visible fats and oils are the main source of essential fatty acids in the diet. However, the intake of healthier fatty acids such as n-3 PUFA and MUFA was grossly inadequate thus leading to high n6/n3 ratio in the diet of this population. It is known that n-3 PUFA and high MUFA intake are protective against both T2DM and CVD29,30. A recent study by Narsimhan et al31 in the same population revealed that use of sunflower oil (high in n6 PUFA) as the main cooking oil was associated with higher metabolic risk as compared to traditional oils such as groundnut and gingelly oil. Furthermore, Lakshmipriya et al reported on that the synergistic effect of sunflower oil (high in n6 PUFA) and refined grain consumption has been shown to have a significant association with metabolic syndrome among urban south Indians32.
More than one fourth of this rural population had generalized obesity and 14.0 per cent had abdominal obesity. This may be due to unhealthy dietary practices, such as higher intake of refined carbohydrates. In view of the rising prevalence of NCDs like diabetes in rural India3, the unhealthy dietary practices could fuel the epidemic of such metabolic NCDs in the future.
The strength of the present study was the validated interviewer administered FFQ which was used to assess the dietary profile. The findings of the present study were in line with previous reports on rural food consumption. Hence, the results could be reasonably extrapolated to other areas of rural India, despite the regional disparities in the type of foods consumed. The limitation of the present study was that being cross-sectional in nature and since, the dietary intakes were captured at one time, time trends could not be studied and no cause-effect conclusions could be drawn. The other limitation was that even though the r value was 0.58 for energy, the coefficient of determination r2, (a measure of how well the observed outcomes can be replicated) was low, and consequently a considerable proportion of the total variation was not explained. So, the results need to be interpreted carefully. The sources of error with FFQ could be due to restricted fixed list of foods, perception of portion sizes, interpretation of questions and long term recall bias.
In conclusion, the dietary profile of this south Indian rural population reflected unhealthy food choices, owing to the high intake of refined cereals in the form of polished white rice and low intake of whole cereals, pulses, legumes, dairy products, fruit and vegetables in both genders and both among the sedentary and moderate physical activity groups. National programmes to promote consumption of indigenous whole grains, fruits and vegetables and making them available and affordable are urgent steps that need to be undertaken to improve the health of the rural population in India to arrest the rising epidemic of NCDs such as diabetes, hypertension and cardiovascular diseases.
Conflicts of Interest: None.
Footnotes
Conflicts of Interest: None.
References
- 1.Patel V, Chatterji S, Chisholm D, Ebrahim S, Gopalakrishna G, Mathers C, et al. Non-communicable diseases and injuries in India. Lancet. 2011;377:413–28. doi: 10.1016/S0140-6736(10)61188-9. [DOI] [PubMed] [Google Scholar]
- 2.Srinath R, Shah B, Varghese C, Ramadoss A. Responding to the threat of non-communicable diseases in India. Lancet. 2005;366:1744–9. doi: 10.1016/S0140-6736(05)67343-6. [DOI] [PubMed] [Google Scholar]
- 3.Anjana RM, Pradeepa R, Deepa M, Datta M, Sudha V, Unnikrishnan R, et al. Prevalence of diabetes and pre diabetes (impaired fasting glucose and/or impaired glucose tolerance) in urban and rural India: Phase I results of the Indian Council of Medical Research-INdia DIABetes (ICMR-INDIAB) study. Diabetologia. 2011;54:3022–7. doi: 10.1007/s00125-011-2291-5. [DOI] [PubMed] [Google Scholar]
- 4.Popkin BM. The shift in stages of the nutrition transition in the developing world differs from past experiences! Pub Health Nutr. 2002;5:205–14. doi: 10.1079/PHN2001295. [DOI] [PubMed] [Google Scholar]
- 5.Ramachandran K. Nutrition monitoring and surveillance. NFI Bulletin. 2006;27:5–7. [Google Scholar]
- 6.Brahmam SNV. National nutrition monitoring bureau in India-An overview. Indian J Community Med. 2007;32:7–9. [Google Scholar]
- 7.Radhika G, Sudha V, Sathya RM, Ganesan A, Mohan V. Association of fruit and vegetable intake with cardiovascular risk factors in urban south Indians. Br J Nutr. 2008;99:398–405. doi: 10.1017/S0007114507803965. [DOI] [PubMed] [Google Scholar]
- 8.Radhika G, Van Dam RM, Sudha V, Ganesan A, Mohan V. Refined grain consumption and the metabolic syndrome in urban Asian Indians. Metabolism. 2009;58:675–81. doi: 10.1016/j.metabol.2009.01.008. [DOI] [PubMed] [Google Scholar]
- 9.Radhika G, Sathya RM, Ganesan A, Saroja R, Vijayalakshmi P, Sudha V, et al. Dietary profile of urban adult population in South India in the context of non-communicable disease epidemiology CURES-68. Pub Health Nutr. 2010;14:591–8. doi: 10.1017/S136898001000203X. [DOI] [PubMed] [Google Scholar]
- 10.Mohan V, Deepa M, Pradeepa R, Prathiba V, Datta M, Ravikumar S, et al. Prevention of diabetes in rural India with a telemedicine intervention. J Diabetes Sci Technol. 2012;6:355–64. doi: 10.1177/193229681200600614. [DOI] [PMC free article] [PubMed] [Google Scholar]
- 11.Willett WC. Nutritional Epidemiology. New York, NY: Oxford University Press; 1998. [Google Scholar]
- 12. [accessed on August 19, 2015];World Health Organization. Diet, nutrition and the prevention of non-communicable diseases: Report of a joint WHO/FAO expert consultation. 2003 916 Available from: http://www.who.int/dietphysicalactivity/publications/trs916/download/en/ [Google Scholar]
- 13.Dietary guidelines for Indians - A manual. 2nd ed. Hyderabad: National Institute of Nutrition; 2012. [Google Scholar]
- 14.Gopalan C, Sastri R, Balasubramaniyam SC. Nutritive value of Indian foods. Hyderabad: National Institute of Nutrition, ICMR; 2004. [Google Scholar]
- 15.Deepa M, Pradeepa R, Rema A, Mohan A, Deepa R, Shanthirani S, et al. The Chennai Urban Rural Epidemiology Study (CURES) - study design and methodology (urban component) (CURES-1) J Assoc Physians India. 2003;51:863–70. [PubMed] [Google Scholar]
- 16.Sudha V, Radhika G, Sathya RM, Ganesan A, Mohan V. Reproducibility and validity of an interviewer-administered semi-quantitative food frequency questionnaire to assess dietary intake of urban adults in southern India. Int J Food Sci Nutr. 2006;57:481–93. doi: 10.1080/09637480600969220. [DOI] [PubMed] [Google Scholar]
- 17.USDA National Nutrient database. [accessed on September 7, 2015]. Available from: https://ndb.nal.usda.gov/
- 18.Foster-Powell K, Holt SH, Brand-Miller JC. International table of glycemic index and glycemic load values. Am J Clin Nutr. 2002;76:5–56. doi: 10.1093/ajcn/76.1.5. [DOI] [PubMed] [Google Scholar]
- 19.Food and Agriculture Organization & World Health Organization (1998) Carbohydrates in Human Nutrition. Joint FAO/WHO Expert Consultation, Rome, 14-18 April 1997. Rome: FAO: Food and Nutrition paper no. 66; [Google Scholar]
- 20.National Institute of Nutrition- Indian Council of Medical Research. NNMB Technical Report No. 24 - Diet & Nutritional Status of Population and Prevalence of Hypertension Among Adults in Rural Areas. 2006. [accessed on May 11, 2013]. Available from: http://nnmbindia.org/nnmbreport06nov20.pdf .
- 21.Ruchi V, Mohan V, Ramyabai M, Sudha V. In: Glycemic index of Indian cereal staple foods and their relationship to diabetes and metabolic syndrome. Wheat and Rice in Disease Prevention and Health: Benefits, risks and mechanisms of whole grains in health promotion. Watson RR, Preedy V, Zibadi S, editors. London: Academic Press, Elsevier; 2014. pp. 333–46. [Google Scholar]
- 22.Narayan S, Lakshmipriya N, Vaidya R, Bai MR, Sudha V, Krishnaswamy K, et al. Association of dietary fiber intake with serum total cholesterol and low density lipoprotein cholesterol levels in Urban Asian-Indian adults with type 2 diabetes. Ind J Endocrinol Metab. 2014;18:624–30. doi: 10.4103/2230-8210.139215. [DOI] [PMC free article] [PubMed] [Google Scholar]
- 23.Agrawal S, Ebrahim S. Association between legume intake and self-reported diabetes among adult men and women in India. BMC Public Health. 2013;13:706. doi: 10.1186/1471-2458-13-706. [DOI] [PMC free article] [PubMed] [Google Scholar]
- 24.Ramachandran P. Nutrition transition in India 1947-2007. New Delhi: Nutrition Foundation of India; 2007. pp. 124–34. [Google Scholar]
- 25.Kinra S, Bowen LJ, Lyngdoh T, Prabhakaran D, Reddy KS, Ramakrishnan L, et al. Sociodemographic patterning of non-communicable disease risk factors in rural India: a cross sectional study. BMJ. 2010;341:c4974. doi: 10.1136/bmj.c4974. [DOI] [PMC free article] [PubMed] [Google Scholar]
- 26.Rastogi T, Reddy KS, Vaz M, Spiegelman D, Prabhakaran D, Willett WC, et al. Diet and risk of ischemic heart disease in India. Am J Clin Nutr. 2004;79:582–92. doi: 10.1093/ajcn/79.4.582. [DOI] [PubMed] [Google Scholar]
- 27.Jorde R, Bana KH. Calcium from dairy products, vitamin D intake, and blood pressure: the Tromsø study. Am J Clin Nutr. 2000;71:1530–5. doi: 10.1093/ajcn/71.6.1530. [DOI] [PubMed] [Google Scholar]
- 28.Choi HK, Willett WC, Stampfer MJ, Rimm E, Hu FB. Dairy consumption and risk of type 2 diabetes mellitus in men: a prospective study. Arch Intern Med. 2005;165:997–1003. doi: 10.1001/archinte.165.9.997. [DOI] [PubMed] [Google Scholar]
- 29.Salas-Salvadó J, Bulló M, Babio N, Martínez-González MÁ, Ibarrola-Jurado N, Basora J, et al. Reduction in the incidence of type 2 diabetes with the mediterranean diet. Results of the PREDIMED-Reus nutrition intervention randomized trial. Diabetes Care. 2011;34:14–9. doi: 10.2337/dc10-1288. [DOI] [PMC free article] [PubMed] [Google Scholar]
- 30.Elmadfa I, Kornsteiner M. Fats and fatty acid requirements for adults. Ann Nutr Metab. 2009;55:56–75. doi: 10.1159/000228996. [DOI] [PubMed] [Google Scholar]
- 31.Narasimhan S, Nagarajan L, Vaidya R, Gunasekaran G, Rajagopal G, Parthasarathy V, et al. Dietary fat intake and its association with risk of selected components of the metabolic syndrome among rural South Indians. Indian J Endocrinol Metab. 2016;20:47–54. doi: 10.4103/2230-8210.172248. [DOI] [PMC free article] [PubMed] [Google Scholar]
- 32.Lakshmipriya N, Gayathri R, Praseena K, Vijayalakshmi P, Geetha G, Sudha V, et al. Type of vegetable oils used in cooking and risk of metabolic syndrome among Asian Indians. Int J Food Sci Nutr. 2013;64:131–9. doi: 10.3109/09637486.2012.728197. [DOI] [PubMed] [Google Scholar]