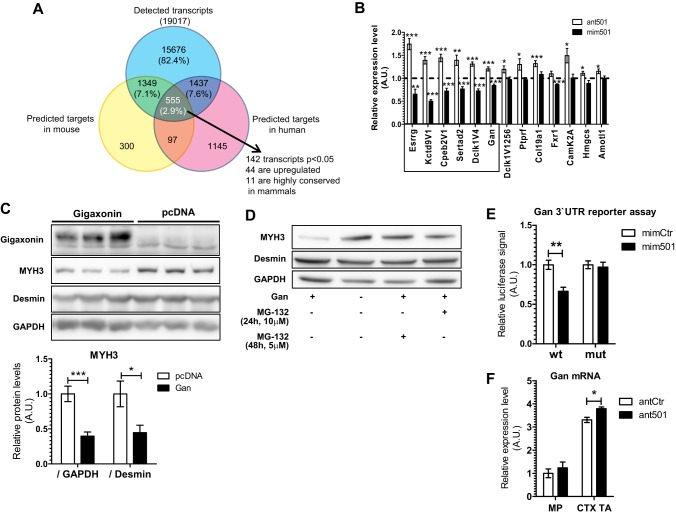
Fig. 6.
Identification and validation of gigaxonin as a miR-501 target decreasing MYH3 levels in primary muscle cells. Primary myoblasts were transfected with control antagomir or antagomir-501 and harvested after 48 h. RNA was extracted and used for cDNA synthesis and RNA-seq after DNase-treatment (n=3). (A) Venn diagram showing the overlap between predicted target genes for miR-501 in mouse and human, based on TargetScan v6.2. The 11 transcripts that were significantly upregulated, predicted as miR-501 targets in mouse and human, and conserved among mammals were considered for further analysis. (B) qRT-PCR confirmation of six out of the 11 selected genes as potential miR-501 targets based on inhibition or overexpression of miR-501 in primary myoblasts, respectively. Cells were harvested 48 h after transfection with the antagomirs or miRNA mimics. Values are shown relative to transfections with control mimic or antagomir as indicated by the dashed line. n=11-12. (C) Primary myoblasts were transfected with pcDNA3.1 vector encoding N-terminally FLAG-tagged gigaxonin or empty vector, and differentiation was induced by serum withdrawal for 2 days. Densitometry shows MYH3 protein normalized to GAPDH or desmin. n=6. (D) Effect of the proteasome inhibitor MG-132 on MYH3 levels after gigaxonin overexpression. MG-132 was added to the media at the indicated time points and concentrations before harvesting. (E) The human 3′ UTR of GAN was cloned into the pmirGLO vector with (mut) or without (wt) a mutation of three nucleotides in the miR-501-binding site. Constructs were transfected into HEK293 cells and luciferase activity was measured after 48 h. Firefly luciferase activity was normalized to Renilla luciferase activity. n=5. (F) qRT-PCR analysis of Gan expression in FACS-sorted MPs or regenerating muscle (CTX TA) 4 days after CTX injection. RNA derived from the same experiment shown in Fig. 5A. Data are presented as mean±s.e.m. All qRT-PCR data are normalized to 18S rRNA. *P<0.05, **P<0.1, ***P<0.001, Student's t-test.

