

Abstract
Little is known about how outer hair cell loss interacts with noise-induced and age-related auditory nerve degradation (i.e., cochlear synaptopathy) to affect auditory brainstem response (ABR) wave characteristics. Given that listeners with impaired audiograms likely suffer from mixtures of these hearing deficits and that ABR amplitudes have successfully been used to isolate synaptopathy in listeners with normal audiograms, an improved understanding of how different hearing pathologies affect the ABR source generators will improve their sensitivity in hearing diagnostics. We employed a functional model for human ABRs in which different combinations of hearing deficits were simulated and show that high-frequency cochlear gain loss steepens the slope of the ABR Wave-V latency versus intensity and amplitude versus intensity curves. We propose that grouping listeners according to a ratio of these slope metrics (i.e., the ABR growth ratio) might offer a way to factor out the outer hair cell loss deficit and maximally relate individual differences for constant ratios to other peripheral hearing deficits such as cochlear synaptopathy. We compared the model predictions to recorded click-ABRs from 30 participants with normal or high-frequency sloping audiograms and confirm the predicted relationship between the ABR latency growth curve and audiogram slope. Experimental ABR amplitude growth showed large individual differences and was compared with the Wave-I amplitude, Wave-V/I ratio, or the interwaveI–W latency in the same listeners. The model simulations along with the ABR recordings suggest that a hearing loss profile depicting the ABR growth ratio versus the Wave-I amplitude or Wave-V/I ratio might be able to differentiate outer hair cell deficits from cochlear synaptopathy in listeners with mixed pathologies.
Keywords: auditory brainstem responses, cochlear neuropathy, cochlear synaptopathy, hidden hearing loss, diagnostics, hearing loss
Introduction
Auditory brainstem responses (ABRs) are routinely adopted in clinics to provide a noninvasive correlate of hearing sensitivity. Additionally, ABR waveforms to transient stimuli are able to locate hearing deficits along the auditory pathway as abnormalities in the different waveform peaks stem from aggregate responses of populations of neurons at different ascending processing stages. Whereas Wave I captures the synchronous firing of numerous auditory nerve (AN) fibers in the spiral ganglion cells, Wave V is thought to be generated by medial superior olive primary cells projecting onto the lateralis lemniscus and inferior colliculus (IC; Melcher & Kiang, 1996). Specifically, reduced ABR Wave-I amplitudes have been associated with AN fiber reductions in subjects with intact preneural auditory function (Furman, Kujawa, & Liberman, 2013; Schaette & McAlpine, 2011; Sergeyenko, Lall, Liberman, & Kujawa, 2013; Stamper & Johnson, 2015) and might offer a measure that quantifies cochlear synaptopathy (also cochlear neuropathy or hidden hearing loss). Cochlear synaptopathy refers to a loss of the number of AN fibers after noise exposure (Kujawa & Liberman, 2009) or ageing (Sergeyenko et al., 2013) and can be selective for high-threshold low spontaneous rate (LSR) AN fibers (Furman et al., 2013). The latter, selective cochlear synaptopathy predominantly affects suprathreshold processing and has been associated with shallower ABR amplitude versus intensity growth in the presence of normal ABR thresholds (Furman et al., 2013). For humans, a significant correlation between high-intensity ABR Wave-I amplitude and noise exposure history was recently reported (Stamper & Johnson, 2015). Finally, listeners with reduced Wave-I amplitudes also showed degraded performance in suprathreshold interaural-time detection for stimulus envelopes (Mehraei et al., 2016), a task for which another study linked performance to cochlear synaptopathy (Bharadwaj, Masud, Mehraei, Verhulst, & Shinn-Cunningham, 2015).
Whereas the ABR wave I can be measured reliably in rodents, the human wave-I amplitude is often difficult to assess and is much smaller than that of the ABR wave V. Reduced human ABR wave amplitudes are not only caused by peripheral hearing deficits but are also reported for normal-hearing individuals with larger head diameters and males (Mitchell, Phillips, & Trune, 1989; Trune, Mitchell, & Phillips, 1988). These measurement drawbacks confound a direct interpretation of human ABR wave characteristics in terms of AN fiber loss and have led to the development of relative ABR metrics such as the Wave-V/I ratio (Gu, Herrmann, Levine, & Melcher, 2012; Hickox & Liberman, 2014; Schaette & McAlpine, 2011), the interwaveI–V latency (e.g., the age dependence of the metric has been reported in Elberling & Parbo, 1987), and Wave-I level growth functions (Furman et al., 2013; Lin, Furman, Kujawa, & Liberman, 2011). Also recently, smaller than normal ABR Wave-V latency changes in the presence of increasing levels of background noise have been associated with the loss of populations of high-threshold AN fibers in listeners with normal audiometric thresholds (Mehraei et al., 2016). This link is supported by physiological studies that show increased first-spike latencies for high-threshold AN fibers (Bourien et al., 2014; Rhode & Smith, 1985), as well as by model simulations that suggest increased Wave-V latencies as background noise increases and low-threshold AN fibers saturate (Verhulst, Bharadwaj, Mehraei, & Shinn-Cunningham, 2013). Relative ABR metrics based on changes in wave characteristics are thus very promising in increasing the sensitivity of this method while factoring out effects of electrode montage (King & Sininger, 1992), head size, and sex (Mitchell et al., 1989; Trune et al., 1988) that can influence the absolute ABR amplitude.
Even though big advances have been made in the development of sensitive ABR metrics for cochlear synaptopathy in listeners with normal audiograms, a clinical adoption of this technique will only be worthwhile if ABR metrics can differentially diagnose and quantify the cochlear synaptopathy component of hearing loss in listeners with intact or impaired preneural cochlear function. Little is known about how cochlear synaptopathy interacts with traditional outer hair cell (OHC) hearing deficits that are known to affect the ABR waveform. Additionally, it is not clear whether the more robust Wave-V amplitude can be used as a proxy for Wave-I amplitude and underlying AN fiber deficits because it has been suggested that homeostatic changes in the auditory pathway between the AN and IC can result in enhanced ABR Wave-V/I ratios in tinnitus patients with normal audiograms (Schaette & McAlpine, 2011).
In this study, we adopt a modeling approach to investigate which relative ABR metrics are most sensitive to either cochlear synaptopathy or OHC-related deficits in listeners who might have different combinations of these deficits present. Specifically, we focus on suprathreshold ABR Wave-I and V amplitude and latency growth as a function of stimulus intensity and show that high-frequency sloping audiograms are associated with steeper ABR latency and amplitude growth. Moreover, we suggest that a grouping of listeners according to their individual ratio of ABR latency and amplitude growth may be able to isolate the AN fiber population health aspect of hearing loss from OHC-related deficits. We compared our model predictions with measured ABR latency and amplitude growth curves in listeners with various degrees of sloping audiometric hearing loss to validate our model simulations and to study which relative ABR metrics are more promising at isolating hearing deficits in listeners with mixed pathologies.
Methods
Model Simulations
ABR Wave-I and -V amplitudes and latencies were simulated using a functional model of the auditory periphery and auditory brainstem (Figure 1; Verhulst, Bharadwaj, Mehraei, Shera, & Shinn-Cunningham, 2015). The cochlear mechanical part of the model was calibrated using cochlear filter tuning parameters derived from human otoacoustic emission measures (Altoè, Pulkki, & Verhulst, 2014; Shera, Guinan, & Oxenham, 2010; Verhulst, Dau, & Shera, 2012; Verhulst et al., 2015). In this model, the gain and associated width of the simulated cochlear filters was altered on a frequency-dependent basis to simulate different profiles of cochlear gain loss. We define cochlear gain loss as hearing deficits associated with the actual loss of the OHC bodies or a metabolic reduction of the gain properties of OHCs (e.g., due to presbycusis) that can both reduce the cochlear gain. Cochlear gain reductions were simulated by adjusting the position of the double pole α* of the basilar membrane (BM) admittance at each cochlear section (or characteristic frequency [CF]) that determines the filter gain and associated width of the simulated cochlear filter.
Figure 1.

Functional model of the auditory periphery that simulates ABR Wave-I and Wave-V amplitudes and latencies (Verhulst et al., 2015). ABR Wave I was obtained by summing same CF AN firing rates of multiple fibers across 500 simulated sections spanning the human frequency range (175 Hz–14 kHz). ABR Wave V was similarly obtained by adding up energy across 500 single-unit IC models (Nelson and Carney, 2004). Cochlear gain loss was introduced by increasing the double-pole α* of the BM admittance corresponding to frequency-specific cochlear gain loss profiles (see Figure 2). Cochlear synaptopathy was modeled by varying the number and types of AN fibers synapsing onto each IHC (see Table 1). Note. ABR = auditory brainstem response; CF = characteristic frequency; AN = auditory nerve; IC = inferior colliculus; BM = basilar membrane; IHC = inner hair cell.
Figure 2 shows the relationship between simulated cochlear gain loss hearing profiles (Panel a), and the corresponding values of the double-poles α* of the model for the low-level hearing range (Panel b). The poles of the normal-hearing model (light green curve) correspond to a frequency-dependent variation of cochlear filter tuning of . Cochlear gain loss was implemented by increasing α* such that the simulated filter had a filter gain reduction (i.e., from the peak of the magnitude spectra of local BM impulse responses) that corresponded to the hearing loss in dB HL. Hearing-impaired filter gain could not be reduced more than by the amount that was available in the normal-hearing cochlear filter.
Figure 2.

Simulated cochlear gain loss profiles. Panel a shows the applied gain reduction in the cochlear filters relative to the gain available in the normal-hearing cochlear filters. The gain reductions were calculated from the peak of simulated power spectra of normal-hearing basilar membrane impulse responses at CF. Sloping (red), flat (green), and flat + sloping (black) hearing losses were simulated. Panel b shows the double-pole α* of the local basilar membrane admittance functions corresponding to the gain loss profiles in Panel a. Note. CF = characteristic frequency.
Cochlear synaptopathy was simulated by changing the numbers and types of AN fibers that synapse onto each inner hair cell (IHC). In the normal-hearing model, 13 high spontaneous rate (HSR; 60 spikes/s), 3 medium SR (MSR; 5 spikes/s), and 3 low SR (LSR; 1 spike/s) fibers were simulated for each CF to follow the ratio observed in normal-hearing cats (i.e., 61%, 23%, and 16% for HSR, MSR, and LSR fibers, respectively; Liberman, 1978). In each model, a total of 500 CFs were simulated that spanned the human place frequency tonotopic map (Greenwood, 1990). Table 1 shows the number and types of nerve fibers synapsing onto a single IHC in each of the simulated cochlear synaptopathy profiles. All of the cochlear synaptopathy profiles were simulated for all simulated cochlear gain loss profiles in Figure 2. IHC loss was not specifically modeled, other than that a loss of all the synapses at one CF would correspond to a loss of the IHC body at that CF. Metabolic differences in the IHC transduction properties (e.g., caused by presbycusis) were not modeled.
Table 1.
Simulated Profiles of Cochlear Synaptopathy.
| CF < 1 kHz | CF = 4 kHz | CF = 8 kHz | CF = 16 kHz | |||||||||
|---|---|---|---|---|---|---|---|---|---|---|---|---|
| H | M | L | H | M | L | H | M | L | H | M | L | |
| NH | 13 | 3 | 3 | 13 | 3 | 3 | 13 | 3 | 3 | 13 | 3 | 3 |
| HF:LSMS | 13 | 3 | 3 | 13 | 0 | 0 | 13 | 0 | 0 | 13 | 0 | 0 |
| LSMS | 13 | 0 | 0 | 13 | 0 | 0 | 13 | 0 | 0 | 13 | 0 | 0 |
| Gradient HF:All | 13 | 3 | 3 | 7.17 | 1.66 | 1.66 | 4.15 | 0.96 | 0.96 | 0 | 0 | 0 |
| 50% HS + LSMS | 7 | 0 | 0 | 7 | 0 | 0 | 7 | 0 | 0 | 7 | 0 | 0 |
Note. CF = characteristic frequency; AN = auditory nerve; IHC = inner hair cell; NH = normal hearing; HF = high frequency; HS = high spontaneous rate; LSMS = low and medium spontaneous rate. The elements represent numbers of specific AN fiber types that synapse onto a single IHC for specific CF Regions. For example, the normal-hearing (NH) profile has a frequency-independent amount of 13 high spontaneous rate (H), 3 medium spontaneous-rate (M) and 3 low-spontaneous (L) rate AN fibers synapsing on to each of the 500 simulated inner-hair cells. Where the NH, LSMS, 50% HS + LSMS profiles have frequency independent degrees of cochlear synaptopathy, the gradient HF:All and HF:LSMS represent high-frequency sloping cochlear synaptopathy profiles.
The ABR Wave I was simulated by summing up instantaneous AN firing rates across all simulated CFs between 175 Hz and 14 kHz. At each CF, the AN activity of all fibers connected to the IHC at that CF was summed up before the population response Wave I was calculated. At each CF, the summed AN activity was fed into a functional model of the cochlear nucleus and IC (Nelson & Carney, 2004) after which the Wave V response was calculated by summing up all energy in the frequency regions between 175 and 14 kHz. The normal-hearing Wave V/I ratio was set on the basis of average human recordings and might not be physiologically realistic (Verhulst et al., 2015). However, because the model captures the frequency dependence of ABR source generators well (Verhulst et al., 2015; Verhulst & Shera, 2015), simulating how different peripheral sources of hearing loss change the normal-hearing Wave V/I ratio should still provide information about the impact of hearing loss on ABR wave characteristics.
Study Participants: Audiograms and Detection Thresholds
Pure-tone audiograms, ABRs, and distortion product otoacoustic emissions (DPOAEs) were measured in 30 study participants (18 females and 12 males) with varying degrees of high-frequency sloping audiograms. Audiograms were recorded between 125 Hz and 8 kHz using a clinical audiometer (Auritec AT900) and routine procedures. All study participants volunteered to take part and were informed about the experimental procedures according to the ethical procedures at the University of Oldenburg. Participants were grouped according to their audiogram shape and 12 listeners (mean age: 25.2 years) were identified as having normal and flat audiometric configurations (top panel in Figure 3). The other 18 listeners (mean age: 47.3) were subdivided according to the slope of their audiograms by calculating the difference in dB HL between the 1 and 8 kHz pure-tone threshold. As the bottom panel in Figure 3 illustrates, seven groups were identified according to this slope criterion with the dB value in the legend corresponding to the reported difference between the 1 and 8 kHz threshold.
Figure 3.
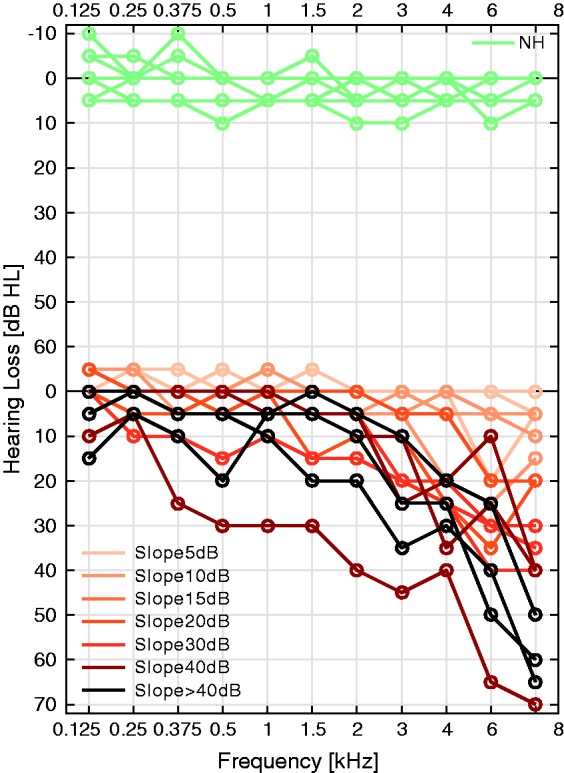
Top: audiograms of the 12 normal-hearing listeners with flat audiogram shapes. Bottom: Audiograms of the 18 study participants with sloping high-frequency hearing losses categorized by their slope (different colors). Audiogram slopes were calculated as the dB HL difference between 1 and 8 kHz.
Because pure-tone detection thresholds may not solely reflect OHC-related hearing deficits, we complemented our threshold metrics with DPOAE thresholds measured at 4 kHz. Two pure tones (primaries) were simultaneously presented via two ER2 (Etymotic Research) speakers coupled to the ER10B+ OAE microphone system (Etymotic Research). A custom-made Matlab-based software was adopted (Mauermann, 2013) that implements a primary frequency sweep method suggested by Long, Talmadge, and Lee (2008). The primary frequencies f1 and f2 were exponentially swept up (2 s/octave) at a fixed f2/f1 ratio of 1.2 over a 1/3 octave range around the geometric mean of 4 kHz. For a given primary level L2, the respective L1 levels were chosen according to the Scissors paradigm (Kummer, Janssen, & Arnold, 1998). Using a sufficiently sharp least squared fit filter of 2 Hz, the distortion component was extracted from the DPOAE sweep recordings (Long et al., 2008; Mauermann, 2013). This distortion component (i.e., LDC) is generated around the characteristic place of f2 along the BM and thus predominantly provides information about the f2 site without being influenced by DPOAE fine structure that is known to affect DPOAE growth functions and threshold predictions (Mauermann & Kollmeier, 2004). Growth functions of LDC were computed as the average over 34 distortion-source DPOAE functions across the measured frequency range. A cubic function of the form
| (1) |
was fit to the bootstrapped data points using a, b, and q parameters. DPOAE thresholds were determined as the level of L2 at which the extrapolated fitting curve LDC reached a level of −25 dB SPL (1.12 µPa; Boege and Janssen, 2002). The method is illustrated in the top panel of Figure 4 for two study participants and shows that the DPOAE threshold (triangles) is elevated for the subject with a 30-dB sloping audiogram (dark orange fit) compared to that of a listener with a 5-dB sloping audiogram. DPOAE thresholds roughly correlated with the pure-tone detection threshold measured at the same frequency using a two-alternative forced choice adaptive tracking procedure and insert earphones (Figure 4(b)), in general agreement with other studies (Boege & Janssen 2002). Finally, elevated DPOAE thresholds at 4 kHz corresponded well to steeper audiogram shapes for subjects with greater than 5 dB HL audiogram differences between 1 and 8 kHz (Figure 4(c)). The individual variability in DPOAE threshold per audiogram shape group was largest for subjects with near-normal audiogram shapes (Groups 1 and 2 in Figure 4(c)).
Figure 4.

(a) 4-kHz distortion-source DPOAE growth curves (LDC) as a function of f2 level along with cubic fits and DP thresholds (triangles) for a study participant with a 5 dB (bright curve) and 30 dB (dark curve) sloping high-frequency hearing loss. (b) Relation between the 4-kHz DPOAE threshold and the threshold of hearing determined using a behavioral adaptive procedure (AFC) for all study participants. (c) 4-kHz DPOAE thresholds of the participants in each audiogram slope group (see Figure 3). Note. DPOAE = distortion product otoacoustic emission; DP = distortion product; AFC = alternative forced choice.
ABR Recordings
100 -µs condensation clicks were presented over ER-2 insert earphones (Etymotic Research) attached to a TDT-HB7 headphone driver (Tucker-Davis) and a Fireface UCX sound card (RME). All stimuli were generated in Matlab and calibrated into peak-equivalent sound pressure level (peSPL) using an oscilloscope, a B&K type 4157 ear simulator and sound level meter (Brüel & Kjær). Seven thousand clicks were presented monaurally at a rate of 33.3 Hz with a 10% jitter on the recording window duration for each of the four levels tested: 70, 80, 90, and 100 dB peSPL. ABRs were recorded using a 32-channel Biosemi EEG amplifier and a custom built triggerbox. The common mode sense and driven right leg (CMS/DRL) electrodes were placed on top of the head near Cz and two reference electrodes were placed on the earlobes. The Cz-channel potentials were re-referenced to the mean of the two earlobe electrode potentials to yield the ABR waveform. Note that our setup differs from that adopted in clinical practice in which (a) we use the average of the two earlobe recordings as the reference, whereas clinical practice adopts one reference electrode placed on the mastoid of the measured ear and (b) the clinically adopted ground electrode is replaced by the CMS and DRL procedure adopted in the Biosemi hardware. ABR waveforms were filtered between 70 and 1500 Hz, then baseline corrected, averaged and epoched 10 ms before and 20 ms after the stimulus click using the Matlab software. ABR peak latency, amplitude, and peak-to-peak amplitudes were determined from the average waveforms for Wave I, III, and V using the auditory wave analysis python software package developed by B. Buran.
Figure 5 shows an example of this peak-picking procedure for a subject within the normal-hearing audiogram group (left panel) and for a subject with a sloping hearing loss (right panel). The locations of the peaks (indicated by the colored circles) and troughs (triangles) were adjusted manually starting from the highest sound intensity and Wave V. The other wave peaks for a specific stimulus level were manually guided by the mean latency differences listed in table 8.1 of Picton (2010). In several occasions, it was not possible to visually determine the peaks from the waveforms at the lowest stimulus levels for listeners with a hearing loss. In those cases, the values were reported as not measurable. The latencies in Figure 5 were not compensated for by the fixed recording delay of the sound delivery system (1.17 ms), meaning that Time 0 in the figure corresponds to 1.17 ms after the onset of the acoustic click. The ABR wave latencies reported in the remainder of this study were referenced such that Time 0 corresponded to the start of the acoustic click at the ear canal to allow for a comparison with other experimental studies. The reported ABR amplitudes were computed as the ABR peak amplitude from the baseline (not the peak-to-peak amplitude). This decision allows for a comparison to the model simulations that simulate ABR waveform peaks. The model has not been adjusted to capture the properties of the troughs of measured ABR waveforms. Furthermore, by using the ABR peak, confidence intervals can be generated by using an automatic peak-picking procedure that determines waveform maxima in a latency region around the wave peak of interest from a mean ABR waveform constructed from randomly permuting 7,000 recorded waveforms in each condition. Using this procedure, confidence intervals were calculated for the ABR wave peaks as well as for the derived ABR difference measures such as the ABR amplitude and latency growth slope. The latter confidence intervals were calculated by randomly picking values from normal distributions of ABR latency and amplitude that had the same standard deviation as those given by the confidence interval for each measured level condition. By only including picks for which responses from the four sampled level conditions grew monotonically up (for amplitude growth) or down (for latency growth) standard deviations on the ABR slope metrics were calculated. When ratio’s of different growth metrics were reported, or differences between ABR wave characteristics, standard deviations were calculated using the standard propagation of error equations.
Figure 5.

Example of the ABR peak-picking procedure for a participant with a normal audiogram (left) and a participant with a sloping high-frequency hearing loss (right). Peaks and troughs were adjusted manually starting from the highest intensity ABR waveforms and Wave V. The latencies in this figure were not compensated for by the 1.17 ms delay associated with the stimulus delivery. Note. ABR = auditory brainstem response.
Results
Model Predictions
Isolating cochlear gain loss
Figure 6 shows simulated ABR Wave-V amplitudes (top panels) and latencies (bottom panels) for different sound intensities and configurations of hearing loss. The amplitude growth functions are plotted in dB/dB following the idea that a loss in cochlear compression due to OHC loss would result in a steeper growth than for an intact cochlea. However, to make comparisons with experimental studies possible, the corresponding wave amplitudes are also indicated in μV. As shown in Figure 6(a), increasing degrees of high-frequency cochlear gain loss steepen the ABR amplitude growth functions. This steepening is predominantly due to a relatively greater ABR amplitude reduction in the 70 than 100 dB peSPL condition when cochlear gain loss is introduced. This level-dependent impact of cochlear gain loss is due to a combination of (a) a reduced contribution of high-frequency CFs to the population response as high-frequency cochlear gain loss is introduced (see figure 3(a) in Verhulst, Jagadeesh, Mauermann, & Ernst, 2016) along with (b) an overall stronger contribution of both low- and high-frequency channels as cochlear excitation patterns become broader after stimulus level increases (see figure 9(d) in Verhulst et al., 2015).
Figure 6.

Simulated ABR Wave-V amplitudes (a and b) and latencies (c and d) as a function of sound intensity for different configurations of cochlear gain loss (left panels) and cochlear synaptopathy (right panels). There was no cochlear gain loss for the synaptopathy simulations. Note. ABR = auditory brainstem response.
Figure 9.

Simulated hearing loss profiles that depict the relationship between the ABR growth ratio metric (RABRgrowth) that captures the cochlear gain loss aspect of hearing loss and other ABR metrics that have been associated with cochlear synaptopathy, that is, Wave-I amplitude (a), Wave V/I amplitude ratios (b) and interwaveI–V intervals (c) to a 100-dB-peSPL click. Note. ABR = auditory brainstem response; peSPL = peak-equivalent sound pressure level.
Stimulus intensity-dependent alterations in cochlear contributions to the ABR Wave V as stimulus level increases are also reflected in the wave-V latency growth functions shown in Figure 6(c). Whereas the normal-hearing model showed a 1 ms latency reduction per 30 dB stimulus level increase, the introduction of increasing degrees of cochlear gain loss resulted in a steepening of the latency growth curves. Longer latencies were observed at 70 dB peSPL for the hearing-impaired models than for the normal-hearing model, reflecting a more dominant contribution of low-frequency channels that are associated with delayed latencies on the basis of cochlear dispersion (Dau, Wegner, Mellert, & Kollmeier, 2000). Contrarily, at 100 dB peSPL, high-frequency cochlear gain loss tended to decrease the overall latency, a result that can be explained on the basis of added high-frequency contributions as excitation patterns broaden in response to a stimulus level increase.
Cochlear synaptopathy reduced ABR amplitudes almost equally for the simulated stimulus levels (Figure 6(b)). In contrast to the cochlear gain loss conditions in Figure 6(a), the slope of the amplitude growth functions is not substantially affected by the loss of various degrees of AN fibers in a model with intact OHCs. Correspondingly, the growth functions in Figure 6(b) resemble those of the normal-hearing model. The simulations in Figure 6 suggest that alterations in the slopes of both the amplitude and latency growth of ABR Wave V are associated with cochlear gain loss, whereas cochlear synaptopathy is expressed as an overall amplitude reduction while not substantially impacting the latency growth curves. It might thus be possible to use ABR growth slope metrics to isolate the cochlear gain loss aspect of peripheral hearing loss in listeners with sloping high-frequency hearing losses that have an unknown degree of cochlear synaptopathy.
Figure 7(a) and (b) show ABR amplitude and latency growth for all possible configurations of simulated cochlear gain loss (along the x-axis) and synaptopathy (different symbol shapes). In general, the ABR amplitude and latency growth curves become steeper as cochlear gain loss becomes more severe. Cochlear synaptopathy was seen to decrease the ABR amplitude growth slope slightly for any given cochlear gain loss configuration (Figure 7(a)). For the conditions where synaptopathy was introduced in a sloping high-frequency loss configuration (i.e., triangles and diamonds), the interactions between the two types of peripheral hearing loss became more complex as the steepening caused by cochlear gain loss was counteracted by the loss of high-frequency AN fibers. The general trend of shallower ABR amplitude growth for cochlear synaptopathy is in good agreement with physiology studies that have observed this relationship for suprathreshold ABRs in animals with synaptopathy (Furman et al., 2013; Lin et al., 2011). However, as the latency growth simulations in Figure 7(b) suggest, this amplitude growth reduction due to synaptopathy does not affect the latency growth functions, except for the case of high-frequency configurations of cochlear synaptopathy.
Figure 7.

Simulated ABR Wave-V amplitude growth in dB/dB (a) and latency growth in ms/dB (b) for different configurations of high-frequency sloping hearing loss (x-axis; see Figure 2(a)) and cochlear synaptopathy (different symbol shapes; Table 1). ABR growth ratios (RABRgrowth) as ms latency growth per dB amplitude growth for the different simulated hearing loss configurations. Note. ABR = auditory brainstem response.
Because cochlear gain loss affects both the ABR amplitude and latency growth curves as a consequence of altered contributions of various CFs to the summed population response, it is possible to derive a measure, the ABR growth ratio (RABRgrowth):
| (2) |
that capture this combined effect. As illustrated in Figure 7(c), RABRgrowth remains constant for increasing degrees of high-frequency cochlear gain loss. The only two cases that deviate from this relationship are the configurations were there is also a 5 dB cochlear gain loss introduced in the frequencies below 1 kHz (i.e., cochlear gain loss configuration: Flat5dB [1] and Slope5dB [8]) that result in slightly larger ratios. The value of the RABRgrowth for a specific listener thus provides a means to factor out the high-frequency cochlear gain loss aspect of hearing loss. Specifically, when RABRgrowth deviates from the expected value obtained for normal-hearing listeners, this would indicate that either (a) the amplitude growth slope is affected without alterations in the latency growth function (i.e., smaller RABRgrowth), as would be predicted for across CF configurations of AN fiber loss, or (b) the latency growth function is affected without the expected corresponding variation of the amplitude growth slope predicted by cochlear gain loss (i.e., larger RABRgrowth).
Isolating cochlear synaptopathy
To evaluate the applicability of the RABRgrowth metric, it should be tested how it relates to other ABR metrics that have been associated with synaptopathy or ageing. Figure 8(a)–(c) shows simulated Wave-I amplitudes, Wave-V/I amplitude ratios and interwaveI–V latency intervals for various degrees of cochlear gain loss (along the x-axis) and synaptopathy (different symbol shapes). In agreement with several experimental studies (Furman et al., 2013; Sergeyenko et al., 2013), Figure 8(a) shows overall reduced Wave-I amplitudes as synaptopathy is worsened. However, a comparably smaller degradation of Wave-I amplitude is also noticeable as high-frequency cochlear gain loss worsens. This loss is smaller than predicted for AN fiber loss, but it can confound a direct interpretation of the Wave-I amplitudes in terms of cochlear synaptopathy.
Figure 8.

Simulated ABR Wave-I amplitudes (a), Wave-V/I amplitude ratios (b) and interwaveI–V intervals (c) for the cochlear gain loss configurations in Figure 2(a; x-axis) and different degrees of cochlear synaptopathy (different symbol shapes; Table 1) for click intensities of 100 dB peSPL. Note. ABR = auditory brainstem response; peSPL = peak-equivalent sound pressure level.
Figure 10.

Recorded ABR Wave-V amplitudes (a and b) and latencies (c) as a function of click intensity for listeners grouped according to their audiogram slopes (see Figure 3). Results are plotted as the mean across the group and the error bars represents ± 1 SD. Wave-V amplitudes are both plotted in μV (a) and in dB re 1 μV (b). Note. ABR = auditory brainstem response.
Because ABR wave amplitudes can be smaller for males and people with larger head size diameters (Mitchell et al., 1989; Trune et al., 1988), several studies have instead focused on the relative Wave-V/I amplitude ratio (e.g., Musiek, Kibbe, Rackliffe, & Weider, 1984; Schaette & McAlpine, 2011). The simulation results in Figure 8(b) show that cochlear synaptopathy had a greater impact on the ABR Wave-V/I ratio than did cochlear gain loss. Because the ratio is only modestly affected by the degree of cochlear gain loss, it appears that the differential effects of high-frequency cochlear gain loss on the Wave-I versus the Wave-V generation are smaller than the effects of cochlear synaptopathy. Note that even though the absolute values of the simulated Wave-V/I ratios are not realistic, it remains possible to investigate how the metric changes as a function of hearing loss. High-frequency cochlear synaptopathy profiles (diamonds and triangles) tended to increase the Wave-V/I ratio as a consequence of smaller Wave-I amplitudes along with constant Wave-V amplitudes. In contrast, uniform cochlear synaptopathy profiles (squares and stars) decreased the ratio as both Wave-I and Wave-V ratio were decreased by different amounts compared with the normal response. The different amplitude reductions of the Waves I and V after uniform AN fiber loss are in the model attributed to the different CF regions that contribute to the responses (i.e., more high-frequency contributions to the Wave-I than Wave-V generation, resulting in a relatively larger reduction in Wave-I amplitude as synaptopathy is worsened).
Finally, the interwaveI–V latency interval has been suggested as a differential ABR metric to assess high-frequency sloping hearing loss (Coats & Martin, 1977; Elberling & Parbo, 1987; Watson, 1996). The simulations in Figure 8(c) for a 100 dB peSPL click show that increasing degrees of high-frequency cochlear gain loss yield decreased interwaveI–V latencies, similar to what has been observed experimentally (Coats & Martin, 1977; Elberling & Parbo, 1987). However, not all experimental studies report increased interwaveI–V latency intervals for sloping high-frequency hearing loss (Watson, 1996). These experimental discrepancies might be due to that increasing age tends to increase interwaveI–V latencies (Elberling & Parbo, 1987). Because ageing can cause synaptopathy (Sergeyenko et al., 2013), it is possible that parts of the experimentally observed ageing effects can be explained by differences in the degrees of cochlear synaptopathy for the different age groups. The simulations in Figure 8(c) show that cochlear synaptopathy also influences the interwaveI–V latency intervals with uniform degrees of synaptopathy yielding overall smaller intervals and high-frequency synaptopathy configurations resulting in larger intervals.
In summary, the simulated Wave-I amplitude and Wave-V/I amplitude ratios at 100 dB peSPL were not heavily impacted by the different degrees of cochlear gain loss, whereas they were more sensitive to differences in AN deficits. In contrast, synaptopathy and cochlear gain loss deficits interacted to impact the simulated interwaveI–V latency intervals in more complex ways, confounding a direct classification of hearing loss profiles from this metric.
Hearing loss profile maps
To improve the sensitivity of ABR metrics for patients with high-frequency sloping audiograms, hearing loss profile maps can be constructed that show the relation between the RABRgrowth metric that captures the cochlear gain loss aspect of hearing loss and other ABR metrics that might be more sensitive to cochlear synaptopathy. Figure 9 depicts such hearing loss profile maps for simulated Wave-I amplitudes, Wave-V/I amplitude ratios and interwaveI–V latency intervals and for various degrees of cochlear gain loss (colors) and synaptopathy (symbol shapes). Figure 9(a) and (b) shows a clustering of data points according to their cochlear synaptopathy degrees. Within each synaptopathy group, smaller degrees of cochlear gain loss yielded smaller RABRgrowth values.
Given the ABR Wave-I amplitude or ABR Wave-V/I ratio and the derived RABRgrowth ratio (see Figure 9(a)), these maps can thus help in quantifying hearing pathologies. According to our simulations, subjects with reduced Wave-I amplitudes and RABRgrowth ratios in the normal range (here −0.13 to −0.11), would suffer from larger degrees of cochlear synaptopathy (stars) than do subjects with the same degree of cochlear gain loss (and similar RABRgrowth ratios) but larger ABR Wave-I amplitudes (circles or squares). A high-frequency sloping cochlear synaptopathy profile yielded overall reduced RABRgrowth ratios because the ABR latency growth slope was not as affected as the ABR amplitude growth slope in this hearing loss profile. Similarly, for listeners with RABRgrowth ratios in the normal range (here −0.13 to −0.11), decreased Wave V/I ratios are indicative of across CF AN fiber loss, where increased wave V/I ratios reflect a sloping high-frequency synaptopathy profile (Figure 9(b)).
Experimental Validation
In the following sections, we study whether the suggested relationships between ABR Wave-V amplitude and latency growth hold in a group of study participants with different degrees of sloping high-frequency audiometric hearing loss (see Figure 3). An experimental confirmation of the model simulations would support the adoption of the RABRgrowth metric to factor out the cochlear gain loss aspect of hearing loss in the quantification of other aspects of peripheral hearing loss such as cochlear synaptopathy.
ABR wave-V growth and RABRgrowth
Figure 10 shows ABR Wave-V amplitudes in μV (Panel a) and dB re. 1 μV/dB (Panel b) as well as ABR Wave-V latencies (Panel c) plotted as mean across the participants in each audiogram slope group (different curves). Recorded ABR Wave-V levels (Panel a) were lower for the groups with audiogram slopes above 20 dB than for those with milder audiogram slopes, yielding significant differences at each of the tested stimulus levels (p ≤ .011; t-test in two groups: slopes above and below 20 dB). These results are in line with several clinical reports and a recent study that reports lower amplitude tone-burst ABRs for listeners with elevated hearing thresholds when the tone-burst CFs fell into the frequency region of hearing loss (i.e., equal SPL conditions; Lewis, Kopun, Neely, Schmid, & Gorga, 2015). Figure 10(c) shows that listeners with steeper audiogram slopes had longer Wave-V latencies than listeners with shallower audiogram slopes. This latency difference was significant for listeners with slopes above 20 dB at all of the tested levels (p ≤ .011), in good agreement with a study that reported longer overall Wave-V latencies as the 4 kHz hearing threshold worsened (Jerger & Johnson, 1988). Second, the slopes of the ABR Wave-V latency growth were significantly steeper (p = .001) for listeners with audiogram slopes above 20 dB. Our results are in line with the steeper click-ABR latency growth functions observed for sloping hearing losses (Gorga, Worthington, Reiland, Beauchaine, & Goldgar, 1985; Yamada, Kodera, & Yagi, 1979) and the increased latencies observed for 2-kHz derived band ABRs at moderate intensities (60–70 dB peSPL) in listeners with sloping hearing losses (Strelcyk, Christoforidis, & Dau, 2009). However, recent observations of equal-SPL tone-burst ABRs in listeners with normal and elevated hearing thresholds did not show significant differences in Wave-V latency growth (Lewis et al., 2015).
Individual differences in ABR Wave-V amplitude and latency growth are in more detail examined in Figure 11 that shows filled symbols for when four data points were measurable and open symbols when fewer data points were available. In the later case, slopes were calculated from the two highest sound intensities. ABR Wave-V amplitude growth showed large individual differences with no clear group trend (Figure 11(a)), even though the model simulations in Figure 7(a) suggested increased amplitude growth as high-frequency cochlear gain loss increased. As experimental studies have shown that synaptopathy can yield shallower suprathreshold ABR Wave-I growth (Furman et al., 2013), while cochlear gain loss leads to an overall linearization of the BM input/output function (Neely, Gorga, & Dorn, 2003), it is possible that the mixture of hearing deficits determines the final slope value. Trends are clearer for the ABR Wave-V latency growth results in Figure 11(b) where listeners with audiogram slopes above 20 dB clearly exhibited steeper ABR Wave-V latency growth than did listeners with shallower slopes. In general, it is expected that latency growth slopes are smaller when only the two highest stimulus intensities are used to compute the slope, as the ABR Wave-V latency differences between the hearing-loss groups were largest for the lowest sound intensities (see Figure 10(b)).
Figure 11.
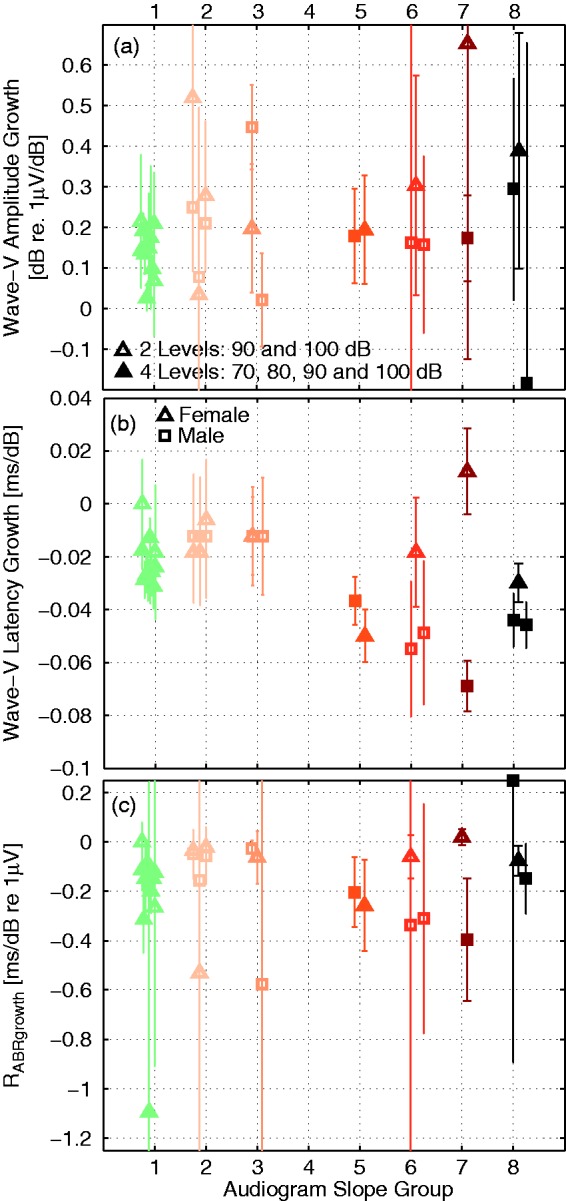
Recorded ABR Wave-V amplitude (a) and latency (b) growth for participants grouped according to their audiogram slope (along the x-axis; Figure 3). ABR slopes were calculated across the four intensities when all data points were measurable (filled symbols) or across the two highest intensities when fewer measurement points were available (open symbols). Data from female subjects were marked with triangles and male subjects were marked with squares. ABR wave growth ratios (c) were calculated according to Equation (2) and error bars reflect ± 1 SD. Note. ABR = auditory brainstem response; peSPL = peak-equivalent sound pressure level.
The model simulations suggested that the amount of variation of ABR amplitude growth associated with latency growth differences caused by the cochlear gain loss aspect of hearing loss could be captured by the RABRgrowth metric. Specifically, cochlear gain loss would affect both amplitude and latency growth such that the ratio between the two remains invariant as long as the only contributor to the hearing loss is of the high-frequency cochlear gain loss origin (see Figure 7(c)). Increased absolute RABRgrowth values suggest a smaller amplitude growth as suggested by cochlear gain loss alone and might be predictive of a component of cochlear synaptopathy that reduces suprathreshold ABR amplitudes as predicted in Figure 7(c). The experimental RABRgrowth ratios in Figure 11(c) show that both listeners with normal and steeply sloping audiograms can have the same RABRgrowth values supporting the modeling view that high-frequency cochlear gain loss yields constant RABRgrowth values. The RABRgrowth values for normal-hearing listeners with all data points available were approximately −0.1 and −0.025 for listeners with only two measurement points available. More negative RABRgrowth values than for a reference normal-hearing and nonsynaptopathic group could indicate cochlear synaptopathy problems. For example, the three listeners in the third audiogram slope group had identical latency shifts, but a large variability in amplitude growth. The male subject with an almost stable amplitude growth between 90 and 100 dB (i.e., square close to 0 in audiogram slope group 3 of Panel a) reached a much larger absolute RABRgrowth value (−0.6) because the amplitude growth was much more shallow than expected by cochlear gain loss alone. Compared to the other two subjects in this audiogram slope group, this subject may be suspect of a larger degree of cochlear synaptopathy where the steepening of ABR amplitude growth resulting from cochlear gain loss could have been counteracted by a shallower suprathreshold growth associated with synaptopathy. As seen in the simulations (Figure 7(b)), cochlear synaptopathy does not affect the latency growth curves as much as cochlear gain loss such that identical latency growth can occur for different degrees of cochlear synaptopathy. Similarly, the two males in Group 6 showed large ABR latency shifts associated with large degrees of cochlear gain loss, while their amplitude growth slopes were relatively mild, yielding larger absolute RABRgrowth values than expected from cochlear gain loss alone.
Hearing loss profile maps
Because there is no direct physiological evidence that listeners with larger absolute RABRgrowth values in fact suffered from cochlear synaptopathy, we can only compare our values to other metrics that have been associated with cochlear synaptopathy. The ABR Wave-I amplitudes to 100 dB peSPL clicks in Figure 12(a) did not show a relationship to the amount of high-frequency audiometric loss as both normal and listeners with steep audiogram slopes could have similar Wave-I amplitudes. If instead cochlear synaptopathy would explain the individual differences, our model simulations suggested that more negative RABRgrowth values would be associated with lower Wave-I amplitudes. This relationship is plotted in Figure 13(a), where it can be observed that some of the listeners with larger absolute RABRgrowth values indeed had smaller Wave-I amplitudes and that the largest Wave-I amplitudes were associated with small absolute RABRgrowth values. However, we did not find a systematic trend between the metrics. This was not due to a gender bias in the data as neither the wave-I amplitudes nor the RABRgrowth values were significantly different for both sex groups. Head size effects were not tested.
Figure 12.

Recorded ABR Wave-I amplitudes (a), Wave-V/I ratios (b), and interwaveI–V latencies (c) for individual listeners grouped according to their audiogram slopes. Male listeners were marked with squares while female listeners were marked with triangles. The stimulus level was 100 dB peSPL in all cases and the error bars show ± 1 SD. Note. ABR = auditory brainstem response; peSPL = peak-equivalent sound pressure level.
Figure 13.

Individual hearing loss profile maps showing the relationship between the ABR Wave-V growth ratio RABRgrowth and other ABR wave metrics associated with cochlear synaptopathy and aging (i.e., Wave-I amplitude (a), Wave-V/I ratio (b), and the interwaveI–V interval (c). Colors represent the different audiogram slope groups, open symbols represent cases where only the two highest intensities were included, whereas all four intensities were used for the solid symbols. Male subjects were marked with squares and female subjects with triangles. Note. ABR = auditory brainstem response.
Greater Wave-V/I ratios have been associated with tinnitus (Schaette & McAlpine, 2011) and hyperacusis (Hickox and Liberman 2014) and might result from cochlear synaptopathy (Möhrle et al., 2016). The expectation is that greater ratios are observed for listeners with weaker Wave-I amplitudes, which in small lab animals are indicative of synaptopathy (Bourien et al., 2014; Sergeyenko et al., 2013). The experimental relation in Figure 14(b) shows that increased Wave-V/I ratios indeed corresponded to smaller Wave-I amplitudes, a trend that was most pronounced in listeners with normal and flat audiograms. This behavior is in agreement with a recent physiology study that shows that middle-aged rats with normal thresholds were able to centrally compensate for the loss of AN fibers by showing near-normal Wave-IV amplitudes for reduced Wave-I amplitudes (Möhrle et al., 2016). However, at high stimulus levels, the same study shows that older rats with elevated hearing thresholds exhibit near-normal (i.e., not elevated) Wave-IV/I ratios along with reduced Wave-I ratios, concluding that central compensation is age dependent. In humans, age-dependent effects on Wave-V/I ratios were found to yield increased Wave-V/I ratios for normal-hearing young adults (22–36 years old) when compared with 5 - to 6-year olds (Jiang, Zheng, Sun, & Liu, 1991). Consequently, the experimental Wave-V/I difference between subjects in the same Wave-I amplitude and audiogram slope group in Figure 14(b) might be informative about the health of this central compensation mechanism.
Figure 14.

Relationship between ABR Wave-I amplitude and ABR Wave-V/I ratio. Panel a shows model simulations for different degrees of cochlear gain loss and synaptopathy. Panel b shows recordings of normal and sloping high-frequency hearing loss study participants grouped according to their audiogram shape. Note. ABR = auditory brainstem response.
In an alternative interpretation of the results of Möhrle et al. (2016), it is possible that reduced wave-V/I ratios in older rats are (partially) reflecting how elevated thresholds impact ears with synaptopathy. The simulation results in Figure 14(a) show that within a synaptopathy group (i.e., different clusters of similarly shaped data points), increasing degrees of high-frequency cochlear gain loss reduce the Wave-V/I ratio because high-frequency cochlear gain loss impacts the Wave-I amplitude relatively stronger than the Wave-V amplitude, as the former has a stronger contribution of high-frequency sources (see Figure 10 in Don & Eggermont, 1978; Verhulst et al., 2015). In another study, listeners with cochlear hearing loss were reported to have larger Wave V/I ratios suggestive of a larger difference between the Wave I and V levels than the normal-hearing 1.5 ratio (Musiek et al., 1984).
The analysis on the relationship between Wave-I amplitude and Wave-V/I ratios suggests that the wave-V/I ratio alone might not be sensitive to cochlear synaptopathy without taking into account the absolute Wave-I amplitude as well. Only in this format can differences between central gain (i.e., Wave V/I ratio for a fixed Wave-I level) and cochlear synaptopathy (i.e., Wave-I amplitude) be separated.
The model simulations in Figure 14(a) furthermore suggest that the frequency distribution of cochlear synaptopathy has an impact on the Wave-V/I ratio as high-frequency cochlear gain loss profiles (diamonds and triangles) yielded larger Wave-V/I ratios, while uniform losses across the cochlear partition yielded smaller than normal Wave-V/I ratios. However, the main difference between the present model simulations and those in the study of Schaette and McAlpine (2011) is that the present model does not include (age-related) central gain mechanisms that might yield increased Wave-V amplitudes for listeners with cochlear synaptopathy. Irrespective, the model can account for some degree of increased Wave-V/I ratios after high-frequency sloping degrees of cochlear synaptopathy. Under the assumption that the model is realistic, and cochlear synaptopathy is expressed in a frequency-specific manner similar to audiometric loss, a general trend of increased Wave-V/I ratios is seen to go along with smaller Wave-I amplitudes.
Finally, the experimental relationship between the interwaveI–V interval and RABRgrowth is shown in Figure 13(c). The absence of a clear trend between the interwaveI–V latency and the RABRgrowth metric is consistent with the absence of audiogram slope group differences in Figure 12(c). Additionally, the model simulations in Figure 8(c) already suggested that complex interactions between cochlear gain loss and synaptopathy impact the interwaveI–V interval metric.
Discussion
Relating individual differences in ABR wave characteristics to different aspects of peripheral hearing loss is complicated by that both AN deficits and cochlear gain loss due to OHC damage and metabolic changes can impact brainstem responses. Using a model-based approach in which parameters of peripheral hearing loss were modified independently identified which ABR-derived metrics are more sensitive to different aspects of peripheral hearing loss when mixtures of pathologies are present. The experimental observations confirm the model predictions in which high-frequency cochlear gain loss and threshold elevation steepen the ABR latency slope metric. The model simulations furthermore suggest that classifying listeners according to their ABR growth ratio (RABRgrowth), which takes into account both ABR latency and amplitude growth, can factor out the cochlear gain loss aspect of hearing loss to maximize other aspects of peripheral hearing loss that influence ABR level growth such as cochlear synaptopathy. The analysis performed in this study focused on high-frequency audiometric hearing losses that cover a large group of the clinical population. However, because it is unlikely that the ABR latency growth slope steepens for flat audiometric hearing loss configurations, it is not clear whether the RABRgrowth ratio can be generalized to other configurations of OHC loss.
Implications for the Diagnostic Use of ABR Wave Characteristics
The relations between ABR Wave-V latency growth and the high-frequency audiogram slope (Figure 11(a) and (b); see also Gorga et al., 1985) are important for the differential diagnostics of cochlear synaptopathy based on ABR amplitude growth functions.
Reference values and synaptopathy for intact OHCs
Individual differences in amplitude-based ABR metrics can only be linked to the degree of cochlear synaptopathy when ABR latency growth is ensured to be normal, and hence the cochlear gain loss component of hearing loss is factored out. Both the model simulations in Figure 7(b) and the experimental compound action potential results in Bourien et al. (2014) only describe a minor role for the delayed onset response of low and medium spontaneous rate AN fibers (Rhode & Smith, 1985) that are most vulnerable to noise damage (Furman et al., 2013) to the population response. It can thus be assumed that in studies where only listeners with normal thresholds are considered, ABR latency growth (or the proposed RABRgrowth metric) is normal. However, because normal-hearing ABR amplitudes are dominated by the synchronously firing high-frequency cochlear regions (Abdala & Folsom, 1995; Don & Eggermont, 1978), it is possible that even minor high-frequency cochlear gain losses impact the ABR Wave I and V growth metrics. Establishing the ABR latency growth metric and RABRgrowth ratio for the healthy and uncompromised cochlea should thus be established in young, non-noise exposed, normal-hearing listeners with perfect high-frequency thresholds up to 16 kHz. Additionally, the reference ABR latency growth and RABRgrowth values should be determined for male and female subjects separately because it has been shown that female subjects have overall shorter ABR latencies than males (Beagley & Sheldrake, 1978), presumably due to their overall shorter cochleae (Don, Ponton, Eggermont, & Masuda, 1993). In line with this, we found significantly steeper ABR Wave-V latency (but not amplitude) growth in the male study participants. Due to the small number of study participants, it is not clear whether this sex difference is due to shorter overall ABR latencies in the female listeners or due to the overall more severe hearing losses in the male study participants. Future population studies could shed light on this issue.
Note that high-frequency cochlear gain losses might show a larger impact on Wave-I than on Wave-V amplitudes. This means that for the same degree of high-frequency cochlear gain loss, the contribution of high-frequency channels to the Wave-I generation can be relatively stronger than to the Wave-V generation (Abdala & Folsom, 1995; Verhulst et al., 2015). Consequently, differences in Wave-V/I ratios for similar Wave-I amplitudes can also have a cochlear gain loss origin (see simulations in Figure 14(a)). A hearing profile map that evaluates the Wave-V/I amplitude growth along with the absolute Wave-I amplitude might (particularly in listeners with normal audiometric thresholds) be able to identify those listeners who have the ability to centrally or homeostatically compensate for the loss of AN fibers (Chambers et al., 2016; Möhrle et al., 2016; Schaette & McAlpine, 2011).
Synaptopathy in people with OHC damage
For listeners with impaired audiograms, cochlear synaptopathy or homeostatic compensation mechanisms can only be isolated after factoring out the cochlear gain loss contribution to the absolute wave amplitude or wave growth. As observed experimentally (Figure 11(a)) and in the model simulations (Figure 6(a)), cochlear gain loss can yield increased Wave-V amplitude growth as several listeners in the sloping audiometric loss groups (especially those with fewer measurable ABR responses at low levels) showed steeper ABR Wave-V amplitude growth. Steeper ABR amplitude growth due to cochlear gain loss can thus counteract shallower ABR growth associated with cochlear synaptopathy (Furman et al., 2013) and hence confound a direct interpretation of ABR amplitude growth in terms of either one of the underlying pathologies.
The proposed RABRgrowth metric describes how ABR amplitude and latency growth covary as a function of cochlear gain loss, that is, steep ABR Wave-V latency growth goes along with steep Wave-V level growth for sloping high-frequency hearing losses where no synaptopathy is present (Figure 6(a)). Deviations from the predicted constant RABRgrowth relationship or individual differences in other ABR metrics within an equal RABRgrowth ratio group could thus reflect aspects of peripheral hearing loss that are different from cochlear gain loss. Specifically, the model simulations in Figure 9(a) and (b) show that individual differences in Wave-I amplitude or Wave-V/I ratios for equal RABRgrowth groups can identify listeners with larger degrees of cochlear synaptopathy. Providing more experimental evidence for the validity of these relative ABR metrics should be done on the basis of a larger subject population for which multiple correlates of cochlear synaptopathy sensitive metrics are available: for example, interaural envelope detection thresholds (Bharadwaj et al., 2015; Mehraei et al., 2016) or envelope-following responses (Bharadwaj et al., 2015; Shaheen, Valero, & Liberman, 2015). Additionally, animal physiology studies that employ ABR and envelope-following response metrics in carefully controlled models of OHC loss and synaptopathy could further support the use of the RABRgrowth ratio metric.
Other experimental approaches have aimed at minimizing the contribution of cochlear gain loss to ABR wave characteristics to maximize potential synaptopathy-induced changes to the measured wave amplitude. In a common approach, the stimulus click level is adjusted on an individual basis to obtain equal sensitivity to the click and a comparable spread of cochlear excitation (i.e., calibration in terms of sensation level [SL]) for participants with differently shaped audiograms. For recorded tone-burst ABRs, this technique was successful in isolating the cochlear synaptopathy aspect of hearing loss when small amounts of cochlear gain loss were also present (Sergeyenko et al., 2013). Even though it is questionable whether a calibration into SL would fully remove differences in cochlear excitation across listeners, a recent study that reported tone-burst ABR latency growth functions in normal and elevated threshold listener groups for an equal SPL and equal SL paradigm showed that the steeper latency growth slopes for the elevated threshold group in the equal SPL paradigm returned to normal in the equal SL paradigm (Lewis et al., 2015, their figure 3). This result is promising in that it might be possible to interpret individual differences in suprathreshold level growth functions in terms of cochlear synaptopathy when growth is determined from the equal SL conditions. However, for broadband click stimuli, the success of increasing the stimulus level such that the cochlear excitation is comparable across different audiometric profiles might prove to be more difficult. In this case, the grouping of listeners according to the proposed RABRgrowth ratio could offer a way to isolate the cochlear synaptopathy aspect of peripheral hearing loss.
Experimental limitations
The proposed RABRgrowth metric was developed on the basis of Wave-V characteristics because this wave is strongest in humans. We often had measurable responses down to 70 dB peSPL and unlike Wave-I responses, suprathreshold Wave-V responses can also be reliably measured in listeners with elevated hearing thresholds. However, diagnostics metrics for cochlear synaptopathy have mostly focused on Wave-I amplitude and amplitude growth characteristics (Furman et al., 2013; Lin et al., 2011; Mehraei et al., 2016; Sergeyenko et al., 2013) as its generators are closer to the AN fibers where the deficits occur. There is a possibility that processing stages at the level of the cochlear nucleus, lateralis lemniscus, and IC might show alterations in their normal functioning due to the reduced input received from the AN. There are in fact several observations that point to differences in Wave-I and Wave-V growth: (a) the cochlear frequency ranges that contribute most strongly to the response are different for Wave I than Wave V (Abdala & Folsom, 1995; Don & Eggermont, 1978), (b) increased age yields shallower wave-I than wave-V amplitude growth (Jiang, 1991), and (c) homeostatic gain mechanisms could play a role in enhancing Wave V in cochlear synaptopathy-suspected rats (Möhrle et al., 2016) and human tinnitus patients (Schaette & McAlpine, 2011). Taken together, it might thus be more correct to direct the focus of future studies on ABR Wave-I growth for which more animal physiology data are available than on Wave-V growth to factor out the cochlear synaptopathy aspect of hearing loss. Note that in the present study, there was a good correlation between Wave-I and Wave-V latency growth suggesting that this metric can be used for both waves. However, there was no correlation between the Wave-I and Wave-V amplitude growth.
Unfortunately, there are experimental challenges in recording reliable Wave-I amplitudes at low sound intensities in listeners with impaired audiograms. We might need to adopt more sensitive electrodes placed in the ear canal (e.g., Burkard & Sims, 2002; Mehraei et al., 2016) to maximize the signal-to-noise ratio or optimize signal processing methodology over current clinical practice. As Figure 12(a) shows, standard deviations on Wave-I can be large even when including 7,000 averages. Relative ABR metrics such as the Wave-V/I ratio or growth metrics are furthermore troubled by that standard deviations on the ABR waves propagate into the standard deviations derived for the relative metrics. Consequently, it is not clear whether the developed metrics can be adequately sensitive to make it into clinical practice. The experimental variability for human ABR recordings is much larger than what is experimentally possible in animal physiology approaches that study relative ABR metrics using fixated head positions or sedation during the measurement. Future population studies should be designed to test the sensitivity of relative ABR metrics in clinical practice.
The Model Approach
Studying how different forms of peripheral hearing loss impact simulated ABR waves is fairly independent of the details of the cochlear mechanics and AN model as long as the simulated responses in the normal-hearing model show a resemblance to measured ABRs. The adopted normal-hearing ABR model shows a Wave-I (and V) stimulus-dependent latency decrease of 1.2 ms per 40 dB stimulus level increase, in agreement with various experimental reports (Dau, 2003; Elberling, Callø, & Don, 2010; Jiang et al., 1991). The model further captures a high-frequency CF dominated contribution to simulated Wave-I responses and a mid-frequency CF-dominated contribution to the Wave-V response (Verhulst et al., 2015). The differences in CF sources contributing to the population response at different levels of processing show a qualitative resemblance to those associated with Wave-I and V source generators studied in masked ABR measurements (Abdala & Folsom, 1995; Don & Eggermont, 1978). Any difference between how the simulated ABR Wave-I and Wave-V change after cochlear gain loss or synaptopathy is attributed to how the functional same-frequency inhibition-excitation cochlear nucleus and IC model of Nelson and Carney (2004) modifies the dominance of different frequency channels to the population Wave-V response. This approach is thus different from other ABR models that incorporate a homeostatic gain mechanism at the level of the dorsal cochlear nucleus (Schaette & McAlpine, 2011) to simulate differences between Wave-I and Wave-V amplitudes. In light of the recent experimental findings in Möhrle et al. (2016), it could be interesting to include homeostatic gain in future model development to show a better agreement between simulated and recorded Wave-V/I ratios.
Conclusion
The combined experimental and modeling approach is effective in explaining which relative ABR metrics are most sensitive to different aspects of peripheral hearing loss on the basis of a model that incorporates the known functional features of cochlear and AN processing. Whereas the ABR latency growth metric strongly depends on the high-frequency cochlear gain loss aspect of hearing loss, ABR level growth might reflect both a steepening due to cochlear gain loss and become more shallow due to a lack of high-threshold AN fibers contributing to the suprathreshold ABR amplitude. To separate these two sources of peripheral hearing loss, we suggest that ABR latency growth should not be treated independently from ABR amplitude growth and that individual differences in ABR level growth for listeners grouped according to their RABRgrowth might offer a way to emphasize the cochlear synaptopathy aspect of hearing loss in listeners with high-frequency sloping audiograms. We further suggest to evaluate ABR Wave-I amplitude along with the Wave-V/I ratio to isolate cochlear synaptopathy (i.e., reduced Wave-I amplitude) from potential homeostatic compensation mechanisms (i.e., increased Wave-V/I ratios) in listeners with otherwise normal audiograms.
Acknowledgments
The authors thank the reviewers (Bob Burkard and one anonymous reviewer) for their valuable feedback and Marvin Schmidt and Moritz Wächtler for help with peak-picking the ABR data.
Declaration of Conflicting Interests
The authors declared no potential conflicts of interest with respect to the research, authorship, and/or publication of this article.
Funding
The authors disclosed receipt of the following financial support for the research, authorship, and/or publication of this article: Work supported by DFG Cluster of Excellence EXC 1077 1 Hearing4all.
References
- Abdala C., Folsom R. C. (1995) The development of frequency resolution in humans as revealed by the auditory brain-stem response recorded with notched-noise masking. Journal of the Acoustical Society of America 98(2): 921–930. [DOI] [PubMed] [Google Scholar]
- Altoè A., Pulkki V., Verhulst S. (2014) Transmission line cochlear models: Improved accuracy and efficiency. Journal of the Acoustical Society of America 136(4): EL302–EL308. [DOI] [PubMed] [Google Scholar]
- Beagley H., Sheldrake J. (1978) Differences in brainstem response latency with age and sex. British Journal of Audiology 12(3): 69–77. [DOI] [PubMed] [Google Scholar]
- Bharadwaj H. M., Masud S., Mehraei G., Verhulst S., Shinn-Cunningham B. G. (2015) Individual differences reveal correlates of hidden hearing deficits. Journal of Neuroscience 35(5): 2161–2172. [DOI] [PMC free article] [PubMed] [Google Scholar]
- Boege P., Janssen T. (2002) Pure-tone threshold estimation from extrapolated distortion product otoacoustic emission i/o-functions in normal and cochlear hearing loss ears. Journal of the Acoustical Society of America 111(4): 1810–1818. [DOI] [PubMed] [Google Scholar]
- Bourien J., Tang Y., Batrel C., Huet A., Lenoir M., Ladrech S., Wang J. (2014) Contribution of auditory nerve fibers to compound action potential of the auditory nerve. Journal of Neurophysiology 112(5): 1025–1039. [DOI] [PubMed] [Google Scholar]
- Burkard R. F., Sims D. (2002) A comparison of the effects of broadband masking noise on the auditory brainstem response in young and older adults. American Journal of Audiology 11(1): 13–22. [DOI] [PubMed] [Google Scholar]
- Chambers A. R., Resnik J., Yuan Y., Whitton J. P., Edge A. S., Liberman M. C., Polley D. B. (2016) Central gain restores auditory processing following near-complete cochlear denervation. Neuron 89(4): 867–879. [DOI] [PMC free article] [PubMed] [Google Scholar]
- Coats A. C., Martin J. L. (1977) Human auditory nerve action potentials and brain stem evoked responses: Effects of audiogram shape and lesion location. Archives of Otolaryngology 103(10): 605–622. [DOI] [PubMed] [Google Scholar]
- Dau T. (2003) The importance of cochlear processing for the formation of auditory brainstem and frequency following responses. Journal of the Acoustical Society of America 113(2): 936–950. [DOI] [PubMed] [Google Scholar]
- Dau T., Wegner O., Mellert V., Kollmeier B. (2000) Auditory brainstem responses with optimized chirp signals compensating basilar-membrane dispersion. Journal of the Acoustical Society of America 107(3): 1530–1540. [DOI] [PubMed] [Google Scholar]
- Don M., Eggermont J. (1978) Analysis of the click-evoked brainstem potentials in man using high-pass noise masking. Journal of the Acoustical Society of America 63(4): 1084–1092. [DOI] [PubMed] [Google Scholar]
- Don M., Ponton C. W., Eggermont J. J., Masuda A. (1993) Gender differences in cochlear response time: An explanation for gender amplitude differences in the unmasked auditory brain-stem response. Journal of the Acoustical Society of America 94(4): 2135–2148. [DOI] [PubMed] [Google Scholar]
- Elberling C., Callø J., Don M. (2010) Evaluating auditory brainstem responses to different chirp stimuli at three levels of stimulation. Journal of the Acoustical Society of America 128(1): 215–223. [DOI] [PMC free article] [PubMed] [Google Scholar]
- Elberling C., Parbo J. (1987) Reference data for ABRs in retrocochlear diagnosis. Scandinavian Audiology 16(1): 49–55. [DOI] [PubMed] [Google Scholar]
- Furman A. C., Kujawa S. G., Liberman M. C. (2013) Noise-induced cochlear neuropathy is selective for fibers with low spontaneous rates. Journal of Neurophysiology 110(3): 577–586. [DOI] [PMC free article] [PubMed] [Google Scholar]
- Gorga M. P., Worthington D. W., Reiland J. K., Beauchaine K. A., Goldgar D. E. (1985) Some comparisons between auditory brain stem response thresholds, latencies, and the pure-tone audiogram. Ear and Hearing 6(2): 105–112. [DOI] [PubMed] [Google Scholar]
- Greenwood D. D. (1990) A cochlear frequency-position function for several species 29 years later. Journal of the Acoustical Society of America 87(6): 2592–2605. [DOI] [PubMed] [Google Scholar]
- Gu J. W., Herrmann B. S., Levine R. A., Melcher J. R. (2012) Brainstem auditory evoked potentials suggest a role for the ventral cochlear nucleus in tinnitus. Journal of the Association for Research in Otolaryngology 13(6): 819–833. [DOI] [PMC free article] [PubMed] [Google Scholar]
- Hickox A. E., Liberman M. C. (2014) Is noise-induced cochlear neuropathy key to the generation of hyperacusis or tinnitus? Journal of Neurophysiology 111(3): 552–564. [DOI] [PMC free article] [PubMed] [Google Scholar]
- Jerger J., Johnson K. (1988) Interactions of age, gender, and sensorineural hearing loss on ABR latency. Ear and Hearing 9(4): 168–176. [DOI] [PubMed] [Google Scholar]
- Jiang Z. D. (1991) Intensity effect on amplitude of auditory brainstem responses in human. Scandinavian Audiology 20(1): 41–47. [DOI] [PubMed] [Google Scholar]
- Jiang Z. D., Zheng M. S., Sun D. K., Liu X. Y. (1991) Brainstem auditory evoked responses from birth to adulthood: Normative data of latency and interval. Hearing Research 54(1): 67–74. [DOI] [PubMed] [Google Scholar]
- King A. J., Sininger Y. S. (1992) Electrode configuration for auditory brainstem response audiometry. American Journal of Audiology 1(2): 63–67. [DOI] [PubMed] [Google Scholar]
- Kujawa S. G., Liberman M. C. (2009) Adding insult to injury: Cochlear nerve degeneration after temporary noise-induced hearing loss. Journal of Neuroscience 29(45): 14077–14085. [DOI] [PMC free article] [PubMed] [Google Scholar]
- Kummer P., Janssen T., Arnold W. (1998) The level and growth behavior of the 2 f1-f2 distortion product otoacoustic emission and its relationship to auditory sensitivity in normal hearing and cochlear hearing loss. Journal of the Acoustical Society of America 103(6): 3431–3444. [DOI] [PubMed] [Google Scholar]
- Lewis J. D., Kopun J., Neely S. T., Schmid K. K., Gorga M. P. (2015) Tone-burst auditory brainstem response wave V latencies in normal-hearing and hearing-impaired ears). Journal of the Acoustical Society of America 138(5): 3210–3219. [DOI] [PMC free article] [PubMed] [Google Scholar]
- Liberman M. C. (1978) Auditory-nerve response from cats raised in a low-noise chamber. Journal of the Acoustical Society of America 63(2): 442–455. [DOI] [PubMed] [Google Scholar]
- Lin H. W., Furman A. C., Kujawa S. G., Liberman M. C. (2011) Primary neural degeneration in the guinea pig cochlea after reversible noise-induced threshold shift. Journal of the Association for Research in Otolaryngology 12(5): 605–616. [DOI] [PMC free article] [PubMed] [Google Scholar]
- Long G. R., Talmadge C. L., Lee J. (2008) Measuring distortion product otoacoustic emissions using continuously sweeping primaries. Journal of the Acoustical Society of America 124(3): 1613–1626. [DOI] [PMC free article] [PubMed] [Google Scholar]
- Mauermann, M. (2013). Improving the usability of the distortion product otoacoustic emisssions (DPOAE)-sweep method: An alternative artifact rejection and noise-floor estimation. In Proceedings of Meetings on Acoustics, volume 19 (p. 050054). Acoustical Society of America, Melville, NY.
- Mauermann M., Kollmeier B. (2004) Distortion product otoacoustic emission (DPOAE) input/output functions and the influence of the second DPOAE source. Journal of the Acoustical Society of America 116(4): 2199–2212. [DOI] [PubMed] [Google Scholar]
- Mehraei G., Hickox A. E., Bharadwaj H. M., Goldberg H., Verhulst S., Liberman M. C., Shinn-Cunningham B. G. (2016) Auditory brainstem response latency in noise as a marker of cochlear synaptopathy. Journal of Neuroscience 36(13): 3755–3764. [DOI] [PMC free article] [PubMed] [Google Scholar]
- Melcher J. R., Kiang N. Y. (1996) Generators of the brainstem auditory evoked potential in cat III: Identified cell populations. Hearing Research 93(1): 52–71. [DOI] [PubMed] [Google Scholar]
- Mitchell C., Phillips D. S., Trune D. R. (1989) Variables affecting the auditory brainstem response: Audiogram, age, gender and head size. Hearing Research 40(1): 75–85. [DOI] [PubMed] [Google Scholar]
- Möhrle D., Ni K., Varakina K., Bing D., Lee S. C., Zimmermann U., Rüttiger L. (2016) Loss of auditory sensitivity from inner hair cell synaptopathy can be centrally compensated in the young but not old brain. Neurobiology of Aging 44: 173–184. [DOI] [PubMed] [Google Scholar]
- Musiek F. E., Kibbe K., Rackliffe L., Weider D. J. (1984) The auditory brain stem response IV amplitude ratio in normal, cochlear, and retrocochlear ears. Ear and Hearing 5(1): 52–55. [DOI] [PubMed] [Google Scholar]
- Neely S. T., Gorga M. P., Dorn P. A. (2003) Cochlear compression estimates from measurements of distortion-product otoacoustic emissions. Journal of the Acoustical Society of America 114(3): 1499–1507. [DOI] [PubMed] [Google Scholar]
- Nelson P. C., Carney L. H. (2004) A phenomenological model of peripheral and central neural responses to amplitude-modulated tones. Journal of the Acoustical Society of America 116(4): 2173–2186. [DOI] [PMC free article] [PubMed] [Google Scholar]
- Picton T. W. (2010) Human auditory evoked potentials, San Diego, CA: Plural Publishing. [Google Scholar]
- Rhode W. S., Smith P. H. (1985) Characteristics of tone-pip response patterns in relationship to spontaneous rate in cat auditory nerve fibers. Hearing Research 18(2): 159–168. [DOI] [PubMed] [Google Scholar]
- Schaette R., McAlpine D. (2011) Tinnitus with a normal audiogram: Physiological evidence for hidden hearing loss and computational model. Journal of Neuroscience 31(38): 13452–13457. [DOI] [PMC free article] [PubMed] [Google Scholar]
- Sergeyenko Y., Lall K., Liberman M. C., Kujawa S. G. (2013) Age-related cochlear synaptopathy: An early-onset contributor to auditory functional decline. Journal of Neuroscience 33(34): 13686–13694. [DOI] [PMC free article] [PubMed] [Google Scholar]
- Shaheen L. A., Valero M. D., Liberman M. C. (2015) Towards a diagnosis of cochlear neuropathy with envelope following responses. Journal of the Association for Research in Otolaryngology 16(6): 727–745. [DOI] [PMC free article] [PubMed] [Google Scholar]
- Shera C. A., Guinan J. J., Jr, Oxenham A. J. (2010) Otoacoustic estimation of cochlear tuning: Validation in the chinchilla. Journal of the Association for Research in Otolaryngology 11(3): 343–365. [DOI] [PMC free article] [PubMed] [Google Scholar]
- Stamper G. C., Johnson T. A. (2015) Auditory function in normal-hearing, noise-exposed human ears. Ear and Hearing 36(2): 172–184. [DOI] [PMC free article] [PubMed] [Google Scholar]
- Strelcyk O., Christoforidis D., Dau T. (2009) Relation between derived-band auditory brainstem response latencies and behavioral frequency selectivity. Journal of the Acoustical Society of America 126(4): 1878–1888. [DOI] [PubMed] [Google Scholar]
- Trune D. R., Mitchell C., Phillips D. S. (1988) The relative importance of head size, gender and age on the auditory brainstem response. Hearing Research 32(2): 165–174. [DOI] [PubMed] [Google Scholar]
- Verhulst S., Bharadwaj H. M., Mehraei G., Shera C. A., Shinn-Cunningham B. G. (2015) Functional modeling of the human auditory brainstem response to broadband stimulation. Journal of the Acoustical Society of America 138(3): 1637–1659. [DOI] [PMC free article] [PubMed] [Google Scholar]
- Verhulst, S., Bharadwaj, H., Mehraei, G., & Shinn-Cunningham, B. (2013). Understanding hearing impairment through model predictions of brainstem responses. In Proceedings of Meetings on Acoustics, volume 19 (p. 050182), Acoustical Society of America, Melville, NY.
- Verhulst S., Dau T., Shera C. A. (2012) Nonlinear time-domain cochlear model for transient stimulation and human otoacoustic emission. Journal of the Acoustical Society of America 132(6): 3842–3848. [DOI] [PMC free article] [PubMed] [Google Scholar]
- Verhulst, S., Jagadeesh, A., Mauermann, M., & Ernst F. (2016). Relations between auditory brainstem response and threshold metrics in normal and hearing-impaired listeners. In S. Santurette, T. Dau, J. C. Dalsgaard, L. Tranebjærg, & T. Andersen (Eds.), Proceedings of ISAAR 2015: Individual Hearing Loss – Characterization, Modelling, Compensation Strategies. 5th symposium on Auditory and Audiological Research (pp. 35–42), Nyborg, Denmark, August 2015, ISBN: 978-87-990013-5-4. The Danavox Jubilee Foundation.
- Verhulst, S., & Shera, C. A. (2015). Relating the variability of tone-burst otoacoustic emission and auditory brainstem response latencies to the underlying cochlear mechanics. In K. D. Karavitaki & D. I. Corey (Eds.), Mechanics of hearing: Protein to perception, Proceedings of the 12th international workshop on the mechanics of hearing, volume 1703 (p. 090003). AIP Publishing, Melville, NY. [DOI] [PMC free article] [PubMed]
- Watson D. R. (1996) The effects of cochlear hearing loss, age and sex on the auditory brainstem response. Audiology 35(5): 246–258. [DOI] [PubMed] [Google Scholar]
- Yamada O., Kodera K., Yagi T. (1979) Cochlear processes affecting wave V latency of the auditory evoked brain stem response: A study of patients with sensory hearing loss. Scandinavian Audiology 8(2): 67–70. [DOI] [PubMed] [Google Scholar]