

Abstract
Metabolic imaging enhances understanding of disease metabolisms and holds great potential as a measurement tool for evaluating disease prognosis and treatment effectiveness. Advancement of techniques, such as magnetic resonance spectroscopy (MRS), positron emission tomography (PET), and mass spectrometry (MS), allow for improved accuracy for quantification of metabolites and present unique possibilities for use in clinic. This article reviews and discusses literature reports of metabolic imaging in humans published since 2010 according to disease type, including cancer, degenerative disorders, psychiatric disorders, and others, as well as the current application of the various related techniques.
Keywords: metabolic imaging, magnetic resonance spectroscopy imaging (MRSI), humans
Metabolites are the small molecule intermediates and products associated with metabolic pathways. Physiological and pathological processes in an organism, such as diseases, activate or deactivate these pathways and result in changes of metabolite concentrations. At present, metabolic imaging uses techniques including magnetic resonance spectroscopy (MRS), positron emission tomography (PET), and mass spectrometry (MS) imaging to visualize and quantify metabolites, and provide a unique perspective to assist disease diagnosis, evaluate patient prognostication, and monitor treatment effectiveness.
MRS is a radiation free technique that can be used in tandem with MR imaging (MRI) to noninvasively characterize tissue with signals from hydrogen protons (1H) and other nuclei, such as carbon-13. PET detects pairs of gamma rays emitted by an injected positron-emitting radiotracer that is retained at disease foci through characteristic pathological processes. Depending on the radiotracer injected, different metabolic pathways can be observed and probed. MS imaging (MSI), a newly developed imaging modality, follows the traditional MS concept of ionizing chemicals with electrons and sorting them by mass-to-charge (m/z) ratio to identify the presence of molecules, but accomplishes these processes on the surfaces of tissue, rather than in the traditional gas or liquid phases. While still in its infancy and can suit only for ex vivo analyses, MSI presents the potential of quantifying tissue molecules and metabolites at a dimension close to single-cell metabolite measurements.
Compared with PET, which allows only for observation of metabolites related to the chosen radiotracer, and MSI, which permits only ex vivo measurements, MRS allows for both ex vivo and in vivo measurements of a complete spectrum of measurable metabolites and, therefore, occupies a prominent place in metabolic imaging. Furthermore, for in vivo evaluations, since the brain is the most suitable organ for MR evaluation, due to its relative homogeneity in magnetic susceptibility and its relative lack of respiratory and cardiac movements compared with other organs, most in vivo metabolic imaging researches involve applications of MRS with brain as the organ of interest. As a result, the majority of in vivo metabolic imaging research has been focused on diseases such as neurodegenerative diseases, psychiatric disorders, and brain cancer, the major topics reviewed in this article.
We review literature data published since 2010 and discuss research studies of metabolic imaging applications for disease diagnosis and prognosis in humans with techniques including MRS, PET, and MSI. Readers interested in earlier related topics are referred to review articles seen in literature1,2.
Degenerative Disorders
Aging is an inevitable biological process that brings with it an increase in incidence of degenerative disorders. Aging related metabolite levels vary differently for different brain regions3–5. The pons is an important part of the brainstem containing various motor and sensory nuclei and bundles. Many neurodegenerative diseases, such as Parkinson’s disease, are associated with the pons. Proton MRS data of in vivo metabolite levels for normal pons has been developed to investigate pontine lesions6. Seventy-eight healthy subjects with ages from 5 days to 78 years underwent the MR measurements of turbo spectroscopic imaging (TSI), in which a fast spin-echo is applied to obtain MRSI data rapidly without the loss of spatial resolution. The metabolite ratios measured showed variations with age. N-acetyl-aspartate (NAA) to creatine (Cr) ratio was low at birth but rose rapidly between 0–5 years, and reached a peak between 10–20 years before the start of a gradual decrease. No significant NAA/Cr difference was found within the groups of 0–5 years or those older than 50 years, but the differences within the 6–20 and 21–50 age groups were significant. The choline (Cho)/Cr ratio decreased rapidly during the first five years, and continuing to decline until 20 years, when it remained stable, leading to significant differences between 0–5 and other age groups. The Cho/NAA ratio also decreased rapidly during the first five years, and continued to decline until 20 years when a reversal was observed. These TSI measured metabolite changes caution the importance of considering age factors when using metabolite levels to characterize disease. Another example of the importance of considering patient age is seen with the investigation of possible metabolic changes in the central nervous system of patients with Fabry (n = 7) and Gaucher (n = 8) diseases using MRS at 3T. Both diseases are rare progressive inherited disorders of glycosphingolipid metabolism affecting multiple organ systems7. While no significant differences were identified between the two patient groups and age-matched healthy volunteers, there were significant age-related differences observed. A significant correlation of myo-Inositol (m-Ino) (p < 0.01) was found for all three groups. NAA/Cho significantly decreased with age (p < 0.01) by 6, 5 and 8% per decade in Gaucher patients, Fabry patients, and healthy volunteers respectively. Therefore, it is extremely important to consider the use of age-matched controls when evaluating disease-related metabolic changes.
Metabolite changes across a large volume of the brain in patients with Parkinson’s disease (PD), a neurodegenerative disorder, were studied in connection with neurological testing8. MRS data showed that in grey matter within the right temporal lobe, Cr was significantly elevated in PD patients compared with healthy volunteers (p = 0.027), likely due to greater neuronal energy expenditure as compensation early in the course of PD. There were also significant decreases bilaterally in the temporal lobes for NAA/Cr (right: p = 0.019; left: p = 0.001) and Cho/Cr (right: p = 0.001; left: p = 0.007), as well as in the right occipital grey matter for NAA (p = 0.032) and NAA/Cr (p = 0.016). Overall in the total cerebrum grey matter, NAA/Cr was significantly reduced in PD patients (p = 0.029). The feasibility of 3D MRSI of the substantia nigra (SN) region for differentiation between idiopathic PD (iPD) and atypical parkinsonian syndrome (aPS) has also been investigated9. Significant differences were observed from rostral to caudal NAA/Cr ratios between iPD patients and healthy volunteers and between iPD and aPS patients (p < 0.001). For healthy volunteers and aPS patients, rostral NAA/Cr was greater than caudal, and this trend was reversed in iPD patients, suggesting that MRSI could enhance diagnostic capabilities for patients with unclassifiable parkinsonian type symptoms, as well as increase understanding of metabolic changes associated with disease progression.
MRS has also showed diagnostic capabilities for other neurological disorders. Through quantification of metabolite levels in the occipital lobe and posterior cingulate gyrus (PCG), MRS was used to differentiate between dementia with Lewy bodies (DLB) and Alzheimer’s disease (AD)10. DLB is a common form of dementia with pathological features and symptoms similar to AD and characterized by a severe sensitivity to antipsychotic medication but a clinically favorable response to cholinesterase inhibitors. In the PCG, both AD and DLB patients showed significantly lower concentrations of NAA, glutamate (Glu), and combined glutamate and glutamine (Glx) (p < 0.05) when compared with healthy volunteers. In the occipital lobe, however, DLB patients showed significantly decreased NAA (p < 0.001), Cr (p < 0.01), Glu (p < 0.001), and Glx (p < 0.001) compared with healthy volunteers, whereas AD patients only showed decreases in Glu (p < 0.01) and Glx (p < 0.05). Therefore, NAA, Cr, and Glu concentrations in the occipital lobe were significantly reduced in DLB patients compared with AD patients (p < 0.05), and Glu concentrations, as well as NAA+Glu+Cr concentrations, had good in vivo diagnostic efficiency, with both showing 84.2% specificity and 66.7% sensitivity.
Likewise, metabolites measured with MRS have been found to correlate with pain-rating index and cognitive disorder in patients with idiopathic trigeminal neuralgia (ITN), a disorder characterized by severe unilateral pain with recurrent episodes, spontaneous or triggered by stimulation to the affected region11. Across the thalamic subregions, NAA/Cr ratios in the affected side (contralateral to the side with pain) of the posterior lateral thalamus and the posterior medial thalamus of ITN patients were significantly decreased compared with age-matched healthy volunteers (p < 0.05), with the NAA/Cr ratio in the posterior medical thalamus negatively associating with the visual analogue score (p < 0.01) and the disease duration (p < 0.05). Significant decreases in the NAA/Cr and Cho/Cr ratios in the intralaminar portion of the thalamus were also seen in ITN patients when compared with age-matched volunteers (p < 0.05); and the Cho/Cr ratio positively correlating with the Montreal Cognitive Assessment score of patients with ITN (p < 0.01).
For progressively degenerative disorders, MRS presents an additional and powerful clinical tool of monitor disease progression with metabolite changes. Changes in NAA, Cho, and Cr concentrations in the entire intracranial corticospinal tract (CST) in patients with amyotrophic lateral sclerosis (ALS) showed that MRS measurable metabolites correlate with disease severity and upper motor neuron function12. Metabolite levels of NAA, Cho, and Cho/NAA in both the right and left intracranial CST were significantly different between ALS patients and healthy volunteers. NAA was reduced 8.9% on the left side and 6.2% on the right side, while Cho was elevated 8.1% on the left side and 7.5% on the right side, and Cho/NAA was elevated 20.0% on the left side and 15.7% on the right side in ALS patients. Cho/NAA was significantly correlated with various measured of upper motor neuron function: in the left precentral gyrus for maximum forced vital capacity (p = 0.010) and right finger tap rate (p = 0.001), in the left centrum semiovale for maximum forced vital capacity (p = 0.023) and right finger tap rate (p = 0.002), and in the left posterior limb of internal capsule for maximum forced vital capacity (p = 0.045) and right foot tap rate (p = 0.0046). These results show a clear bilateral neurological asymmetry in metabolites along the intracranial CST in ALS patients quantifiable with MRS.
The increase of MR field strength presents increased spectral resolution, that translates into the improved capabilities of detecting and distinguishing metabolites in vivo. An exploratory in vivo 7T MRS study characterized metabolite changes with respect to disease stage and pathophysiological changes in Huntington’s disease (HD) in three tested groups: premanifest gene carriers, manifest HD patients, and healthy volunteers (Figure 1)13. In the caudate nucleus and the putamen, manifest HD patients showed significantly reduced NAA (p = 0.009 and 0.024) and Cr (p = 0.001 and 0.027), compared with healthy volunteers. However, no significant differences were found in the other three measured regions: hypothalamus, thalamus, or prefrontal region. Although there was no significant difference found between premanifest gene carriers and healthy volunteers, absolute values of NAA, Cr, and Glu were lower in the caudate nucleus and putamen in premanifest gene carriers. The lower concentrations of NAA and Cr could indicate deficits in neuron integrity and energy metabolism in both manifest and premanifest HD patients; and MRS, thus, can be used as a tool to monitor disease progression and treatment effectiveness.
Figure 1.

Localized proton MR spectra from different regions of the brain. On the left side, the voxel is displayed in the transverse direction, a typical spectrum of that structure is shown on the right side for the three groups. Five different regions are displayed: hypothalamus, thalamus, caudate nucleus, putamen, prefrontal region. A Gaussian filter of 4 Hz was applied13.
MRSI allows the collection of spectral data from many voxels. Multiple sclerosis (MS) disease was studied with such a localized MRSI with a coronal slice passing through the CST to investigate metabolic changes along the entire motor pathway from the internal capsule to the corona radiata14. Relapsing-remitting MS patients had significantly higher Cho concentrations in the CST than healthy volunteers (p = 0.039) and, although not statistically significant, trended towards higher Cho concentrations than primary-progressive MS patients (p = 0.081). Across all MS patients, lower CST Cho concentrations were correlated with worsened walking ability measured by timed walk test scores, with a mean increase in Cho concentration of 1.538 mmol/l [Regression coefficient (95% CI) 1.538 (0.064, 3.011), p = 0.041] per unit of higher inverse timed walk test (in 1 per second). For primary-progressive MS patients, lower concentrations of CST Cho and Cr were associated with higher expanded disability status scale; with each expanded disability status scale point increase, there was a decrease of Cho concentration by 0.348 mmol/l [regression coefficient (95% CI) −0.348 (−0.602, −0.094), p = 0.007] and a decrease in Cr concentration by 0.990 mmol/l [regression coefficient (95% CI) −0.990 (−1.841, −0.138), p = 0.023]. Relapsing-remitting MS patients also had significantly higher CST inositol (Ino) concentrations than primary-progressive MS patients (p = 0.037) and a trend towards elevated Ino concentrations compared with healthy volunteers (p = 0.087). In relapsing-remitting MS patients, these higher Ino concentrations were associated with worsened walking ability, with an increase in Ino concentration of 17.08 mmol/l per unit of lower inverse timed walking test score (in 1/s) [regression coefficient (95% CI) −17.08 (−31.95, −2.22), p = 0.024]. A combination of MRS with diffusion tensor imaging (DTI) is used for evaluation of tumefactive demyelination (TD) lesions in the brain15. TD lesions, presented in MRI as a large single lesion with marked edema, can be difficult to differentiate from other brain pathologies such as neoplasm. MRS data alone can also be uncertain. For instance, among eight patients with typical morphology on MRI, seven lesions showed higher Cho, NAA, and Cr at the periphery of the lesion compared to the center, while for other two cases with atypical morphology observed on MRI, higher peripheral NAA, but varied Cho between the center and periphery were observed on MRS. Nevertheless, DTI revealed three distinct zones with varying diffusion characteristics in 15 patients. There was a well-defined outer zone of restricted diffusion, with a gradual increase in diffusion moving inwards towards the center, where facilitated diffusion was observed. The combination of MRI, MRS and DTI revealed distinct features at different depths of lesions.
Psychiatric Disorders
Many MR-measurable metabolites are active neurotransmitters, known to play important roles in psychiatric disorders. Post-traumatic stress disorder (PTSD) patients were found to have lower concentrations of γ-aminobutyric acid (GABA) in the lateral temporal and parieto-occipital cortices, lower NAA in the prefrontal cortex, and higher Glu in the lateral temporal cortex16. Since alcohol use disorder is frequently linked with PTSD, MRS was used to investigate the effects of heavy drinking on brain metabolite concentrations in PTSD patients with current alcohol-use-disorder (n = 10), and compared with PTSD-only patients (n = 28), as well as with non-PTSD volunteers (n = 20)17. PTSD patients with alcohol-use-disorder had normal GABA and Glu levels on both the lateral temporal and parieto-occipital cortices, while PTSD-only patients showed higher Glu in the lateral temporal cortex (p = 0.009) and lower GABA in the parieto-occipital cortex (p = 0.026). The normal lateral temporal GABA level in PTSD patients with alcohol-use-disorder was positively associated with processing speed (Trail Making Test-A: r = 0.87, p = 0.019), suggesting that alcohol use could serve as a self medication to partially neutralize neurotransmitter imbalance. In the anterior cingulate cortex, PTSD patients with alcohol-use-disorder have lower Glu (p ≤ 0.001) and higher GABA levels than both PTSD only patients and non-PTSD volunteers (p ≤ 0.027), while PTSD only patients had normal Glu and GABA levels. The lower concentration of Glu in PTSD patients with alcohol-use-disorder was strongly related to divided attention (Trail Making Test-B: r = 0.73, p = 0.025) while the higher GABA concentration was strongly related to auditory-verbal learning/memory (Hopkins Verbal Learning Test-Revised-Total Recall: r = 0.69, p = 0.040; Hopkins Verbal Learning Test-Revised-Delay Recall: r = 0.89, p = 0.002). These results emphasize the potential impact of metabolite imaging on understanding, monitoring, and managing psychiatric disorders in clinic.
To monitor and manage psychiatric disorders, it is important to evaluate risk factors of patients before serious symptoms emerge that can pose a threat to themselves and others. Adolescents and young adults of schizophrenia patients are considered of having high familial risks of developing schizophrenia. The 23 high-risk subjects and 24 age and sex matched healthy volunteers were studied with MRS18. In comparison to healthy volunteers, NAA levels in the high-risk subjects were reduced in the thalamus, caudate, and anterior cingulate gyrus, with thalamic and anterior cingulate NAA levels inversely correlating with schizotypy. The anterior cingulate NAA concentrations also inversely correlated with attenuated psychosis and perseverative errors on the Wisconsin Card Sorting test. Glx concentrations in high-risk subjects were elevated in the thalamus and caudate and positively correlated with schizotypy and attenuated psychosis, with caudate Glx concentrations also correlated with perseverative errors in the Wisconsin Card Sorting test. Glycerophosphocholine (GPC) and phosphocholine (PC) levels were increased in the anterior cingulate cortex compared with healthy volunteers, which positively correlated with schizotypy and attenuated psychosis. These results suggest that reduced NAA and increased Glx and Cho in the thalamus might represent vulnerability for developing schizophrenia.
Various studies have attempted to characterize bipolar disorder through metabolite imaging. One such study used MRSI to measure NAA, Cho, and m-Ino in the hippocampal complexes and brainstem of 19 patients with euthymic biopolar I disorder medicated with mood stabilizers and compared them with eight healthy volunteers19. Statistical analysis with Mann-Whitney U tests showed significantly increased Cho concentration in the thalamus (left: p = 0.003; right: p = 0.02), as well as significantly increase NAA concentrations in the left hippocampus (p = 0.01) in bipolar patients. Further analyses using one-way analysis of variance (ANOVA) revealed similar results, with significantly increased Cho concentration in the thalamus (left: p = 0.006; right: p = 0.007), as well as significantly increase NAA concentrations in the left hippocampus (p = 0.014) in bipolar patients compared with healthy controls. Proton MRSI study has also been used to investigate metabolic changes in both unmedicated bipolar depression (n = 12) and mania (n = 12), as well as 20 healthy volunteers20. Compared with healthy volunteers, bipolar disorder patients had significantly higher Lac/Cr ratio (p = 0.03). Post-hoc pair-wise analysis showed that bipolar manic patients had lower Glx/Cr levels in the posterior cingulate cortex (p = 0.013) and bipolar depressive patients had higher Glx/Cr levels in the left thalamus (p = 0.023) when compared with healthy volunteers. Bipolar manic patients had significantly decreased Glu/Cr levels in the posterior cingulate cortex compared with both bipolar depressive patients (p = 0.022) and healthy volunteers (p = 0.0002). Therefore, glutamate metabolism may likely play a significant role in bipolar disorder as revealed by MRSI. MRSI has also been employed to evaluate metabolite changes in psychiatric disorders by comparisons of metabolite concentrations between 16 patients with methamphetamine dependence and 10 patients with methamphetamine induced psychosis using voxels in the anterior cingulate cortex, dorsolateral prefrontal cortex, and frontal white matter (Figure 2)21. Both patient groups had significantly decreased NAA levels in the right anterior cingulate corted (p < 0.005) and right dorsolateral prefrontal cortex (p < 0.05) compared to healthy volunteers. In patients with methamphetamine induced psychosis, the relative NAA concentrations were significantly correlated with the patient’s age at initial substance use, with a positive correlation in the right anterior cingulate cortex (p < 0.005) and a negative correlation in the left frontal white matter (p < 0.01). The methamphetamine dependent group also had decreased Cho metabolites in the right dorsolateral prefrontal cortex (p < 0.05) compared with healthy volunteers.
Figure 2.

Representative 1H-MRS 2D chemical shift imaging brain slice orientation on the 3D planes (a — axial, b — coronal, c — sagittal) and spectra of VOIswhich included: (d & g) bilateral anterior cingulate cortices (ACC), (f & i) bilateral dorsolateral prefrontal cortices (DLPFC), and (e & h) bilateral frontal white matter voxels located between ACC and DLFPC21.
2D multivoxel MRS was also used to evaluate metabolite concentrations in the prefrontal lobe, anterior cingulate cortex, and the hippocampus of 26 patients with first-episode, treatment-naive, non-late-life major depressive disorder (MDD) together with 13 healthy volunteers22. Patients with major depressive disorder had significantly reduced NAA/Cr ratio in the left prefrontal lobe (p = 0.033) and significantly reduced NAA/Cr and Cho/Cr in the right prefrontal lobe (p < 0.05) compared with healthy volunteers. Patients with major depressive disorder also had significantly decreased thyroid-stimulating hormone levels compared to healthy volunteers, which positively correlated with the NAA/Cr ratio (p = 0.045), suggesting that biochemical abnormalities and thyroid dysfunction may begin early in major depressive disorder.
Evaluation of the effects of treatment on psychiatric disorders can also be monitored with metabolic imaging. Effects of cognitive-behavioral therapy, a highly effective therapy for pediatric obsessive-compulsive disorder (OCD), were evaluated with MRSI at 1.5T for metabolite levels in the brain23. Five unmedicated OCD patients and nine healthy volunteers underwent MRSI of the bilateral putamen, thalamus, and pregenual anterior cingulate cortex. OCD patients were also rescanned after 12 weeks of cognitive-behavioral therapy. At baseline, NAA levels in the pregenual anterior cingulate cortex of OCD patients were 55.5% higher (p < 0.05), while the Cr in the right putamen was 31.8% lower than healthy volunteers (15.0%; p < 0.01), all after Bonferroni correction. After cognitive-behavioral therapy, the NAA (p < 0.05) and Cr (23.9%; p < 0.05) in the left pregenual anterior cingulate cortex decreased in all five patients. An increase of 10.6% was also observed in the right thalamus (p < 0.01) in all five patients.
Additional researches have applied various metabolic imaging techniques to investigate brain metabolic changes in patients with amnestic mild cognitive impairment (aMCI). Multi-voxel proton MRS measurements using a PRESS pulse sequence at 1.5T for 14 aMCI patients and 15 healthy volunteers were reported24. aMCI patients showed significant decreases in NAA (p < 0.01), NAA/Cr (p < 0.01), and NAA/m-Ino (p < 0.01) in the left posterior cingulate gyrus compared with healthy volunteers. A decrease in NAA (p < 0.05) was also found in the left inferior precuneus and posterior paratrigonal white matter, and there was a significant decrease in the NAA/m-Ino (p < 0.05) ratio in the left posterior paratrigonal white matter. Another aMCI study compared the metabolic imaging techniques of fluorodeoxyglucose-PET (FDG-PET) with advanced MR techniques, including MRS, perfusion weighted imaging (PWI) and diffusion tensor imaging (DTI), within the posterior cingulate region of the brain in 55 aMCI patients and 20 age-matched controls. The z-scores, values of standard deviations, was used to reflect the degree of abnormalities of patients compared to the healthy volunteers, with higher z-scores representing more pronounced alterations25. DTI had significantly higher z-scores (2.1; p < 0.0001) compared with FDG-PET (0.9) and PWI (1.0) and the lowest MRS z-scores (NAA/Cr: 0.3; Cho/Cr: 0.1; m-Ino: 0.2). FDG-PET and PWI measurements showed significant positive correlations (r = 0.44; p = 0.001). Compared with healthy volunteers, aMCI patients showed significant glucose hypometabolism (p < 0.05). FDG-PET and PWI techniques showed similar accuracy in distinguishing between aMCI patients and healthy volunteers, while DTI had increased accuracy. Based on FDG-PET data, aMCI patients were divided into two groups: those expressing lower glucose uptake and those with normal glucose uptake. Both groups did not show any significant differences in MRS-measured metabolite levels, but did show significantly lower DTI values. Those with lower glucose uptake also had lower values of PWI cerebral blood volume.
Other Neurological Disorders
Metabolic imaging has also been utilized to understand the metabolic changes associated with other disorders. Multi-voxel MRS was used to investigate possible differences in metabolite ratios between mild (n = 17) and severe (n = 14) obstructive sleep apnea patients26. Compared with patients with mild obstructive sleep apnea, patients categorized as severe had significantly elevated NAA/Cr (p = 0.004) and Cho/Cr (p = 0.003) ratios in the hippocampus. In the putamen, Cho/Cr (p = 0.004) was again elevated while NAA/Cho (p = 0.032) was decreased in patients with severe obstructive sleep apnea. Metabolic differences in the hippocampi of patients with juvenile myoclonic epilepsy (n = 17) versus age and sex matched healthy volunteers (n = 19) were also studied with MRS at 1.5T27. Statistical analysis with ANOVA (p < 0.05) revealed significant differences between groups for Cho/Cr in the head of the hippocampus, NAA/Cr in the head, body, and tail of the hippocampus, and NAA/Cho+Cr in the body and tail of the left and right hippocampus. However, none of the significant metabolite differences correlated with duration of epilepsy. These results suggest the metabolite changes are a part of disease pathology and further investigation could help improve understanding of disease and enhance treatment.
Additional research has used imaging to evaluate the effects of environment on metabolite levels. MRS was used to examine the association between mean childhood blood lead levels and in vivo brain metabolite concentrations as adults28. Participants came from the Cincinnati Lead Study (n = 159) and had a mean childhood blood lead values of 13.3 ± 6.1 micrograms per deciliter (µg/dL), ranging from 4.7 to 37.2 µg/dL. Using a model, an increase in mean childhood blood lead level concentration was associated with a decrease in NAA and Cr in the basal ganglia, a decrease in NAA and Cho in the cerebellum, a decrease in Glx in the vermis and parietal white matter, and a decrease in Cho in the parietal and frontal white matter. MRS also detected rf changes in metabolite levels in the cerebellum after heat stroke29. In patients (n=8) after heat stroke, NAA/Cr (p = 0.004) and Cho/Cr (p = 0.032) ratios were significantly decreased compared with healthy volunteers. The NAA/Cr ratio was also significantly correlated with the patient’s Glasgow Coma Scale score (r = 0.748; p = 0.033), suggesting that the severity of heat stroke can be effectively evaluated in clinic by NAA/Cr ratios measured in vivo with MRS.
Brain Cancer
Cancer is a major public health threat worldwide with 14.4 million new cases and 8.2 million deaths in 201230. With the increased emphasis on the clinical value of early detection and treatment, imaging diagnostic efforts have focused extensively on the biological characterization of cancer, assisted by genomics, proteomics, and metabolomics. Evaluations of disease-related alterations in metabolite levels can provide valuable insight into individual cancer metabolism and present the potential to inform diagnosis and treatment management in the clinic, all align with the goals of individualized precision medicine.
Most brain tumors are detected using MR imaging and diagnosed with histopathological evaluation of surgically removed tissue to confirm cancer type and grade. Major cancer metabolite imaging developments have occurred with in vivo MRS studies of brain cancer. While brain cancer is not the most prevalent cancer in adults, with 256,000 new cases and 189,000 deaths in 2012, the highest incidence and mortality rates are found in more developed regions such as Australia/ New Zealand, Europe, and North America, likely reflecting the importance of available diagnostic imaging facilities for accurate diagnosis and treatment30.
Metabolite imaging of brain tumors aims at developing non-invasive diagnostic and treatment evaluation protocols and has been used to acquire both MRS measurements of single anatomic locations and in two or three physical dimensional MRS maps. As a major type of human brain tumors, gliomas have been extensively studied by in vivo MRS for characterizations. One such study evaluated the usefulness of MRS in differentiating brain metastases (n = 14), from primary high-grade (HGG; n = 32), and low-grade (LGG; n = 14) gliomas in 60 histologically confirmed patients31. Statistical analyses compared the metabolite ratios within these tumors and their peritumoral edema using the Wilcoxon tests at a significance level of 5%. The metabolite ratios of Cho/Cr, Cho/NAA, and NAA/Cr measured from the tumoral cores showed statistically significant (p < 0.05) differences for HGG versus metastases, LGG versus metastases, and LGG versus HGG. However, for peritumoral edema, the mean ratios of Cho/Cr, Cho/NAA, and NAA/Cr were only able to significantly differentiate between LGG and HGG. Lipid levels were also found to be significantly higher in LGG and HGG compared with metastases. Lactate levels could also be used to differentiate HGG from LGG and metastases. These data suggest that MRS could be used as a non-invasive diagnostic tool for patients who cannot undergo biopsy and for all patients suspected of harboring brain tumors as preliminary investigative procedures. Evaluations of the efficiency of the combination of three dimensional (3D) MRI textural features and MRS metabolite ratios using pattern recognition methods has been carried out to distinguish between meningiomas (n = 19) and metastatic brain tumors (n = 21)32. Brain MR images with corresponding spectral data for Cho, NAA, and Cr, as well as the ratios Cho/NAA, Cho/Cr, and NAA/Cr for these patients were investigated against their MRI textural features, such as kurtosis, entropy, difference entropy, run length nonuniformity, and long run emphasis. The results presented a high classification accuracy of 95% in discriminating between meningiomas and metastases, with individual accuracies classifying meningiomas at 94.74% and metastatic brain tumors at 95.24%. Analyzing only metabolites observed during spectroscopy led to a slightly lower classification accuracy of 90 % for distinguishing between meningioma and metastases, with individual accuracies classifying meningioma at 89.47% and metastatic tumors at 90.48%. When both features were combined, the overall classification accuracy was 100%. This suggests that supplementing MRI data with metabolite information might increase the discrimination accuracy of pattern recognition systems and function as a useful tool for clinicians.
Additional research investigated the characteristics of gliomas presented with a genetic mutation of arginine 132 in the enzyme isocitrate dehydrogenase-1 (IDH1). This mutation produces an excess of the metabolite 2-hydroxyglutarate (2HG) and is seen in up to 86% of grade II and III gliomas33. Since patients with IDH1 mutations, after correcting for the age factor, have a greater 5-year survival than those without the mutation, identifying patients with this mutation could help inform diagnosis and treatment in the clinic. 2HG can be measured with in vivo MRS. 3T MRS 2HG measurements for two glioma and four primary glioblastoma (IV) patients, all with known IDH1 mutations, and four healthy volunteers were shown in Figure 3. In patients with IDH1 mutations, the Hα-Hβ cross-peaks of 2HG were present at 4.02/1.91 ppm in a two-dimensional (2D) spectrum, providing clear evidence of elevated 2HG levels that, due to chemical shift overlap, is hard to identify within 1D spectra. As expected, 2HG cross-peaks do not appear in 2D spectra from tumor patients without IDH1 mutations and healthy volunteers. Since the acquisition time for an in vivo 2D spectrum with a voxel size of 3×3×3 cm3, a concentration of 2mM, and a signal-to-noise ratio of 5 was about 13 minutes, it is conceivable that translation of such a 2D MRS into the clinic could advance diagnosis and inform treatment. 2HG levels can also been rapidly detected in tissue samples from surgically resected gliomas to immediately identify IDH1 mutations, using desorption electrospray ionization (DESI) MS. It has been demonstrated that during two surgical resections, by applying miniscule amounts of biopsy material onto a standard glass slide with either a swab and by smearing the tissue between two glass slides. Within minutes, mass spectrometry data revealed peaks corresponding to 2HG (m/z 147.0), which was confirmed later after surgery with immunohistochemistry (Figure 4)34. These results show that 2HG can be rapidly detected using DESI MS during surgery without complex tissue preparation, allowing for rapid molecular characterization. With real-time characterization, DESI MS could help define surgical margins, leading to more balanced surgical strategy and potentially longer patient survival.
Figure 3.

HR-MAS spectra recorded at 14 T ex vivo on biopsy tissue from patients with and without IDH1 mutations. 1H-1H 2D TOBSY spectra are shown for all biopsies (the minimum contour levels were set five times the noise level). (A) For anaplastic astrocytoma biopsy tissue with IDH1R132 mutation (n=1), the spectra are shown in green-blue contours. The phantom is shown in red-yellow. Projections along δ1 and δ2 show the 2HG crosspeaks, outlined by a red rectangle. (B and C) Spectra for wt-IDH1 patients: primary glioblastoma (B; n=1) and non-tumor (C; n=1). The region where 2HG crosspeaks would be expected is outlined by a red rectangle. For all 2D TOBSY brain spectra, several other metabolites can be identified. Amino acids: alanine (Ala), aspartate (Asp), glutamate (Glu), glutamine (Gln), histidine (His), isoleucine (Ile), leucine (Leu), lysine (Lys), proline (Pro), serine (Ser), threonine (Thr). Membrane phospholipid-related compounds: choline (Cho), ethanolamine (Etn), glycerol (Glr), glycerophosphocholine (GPC), glycerophosphoethanolamine (GPE), phosphocholine (PC), phosphoethanolamine (PE). Sugars: l-fucose (lFuc), β-glucose (bGlc), myo-inositol (Myo). Miscellaneous: glutathione (GSH), lactate (Lac), lipids (Lip), N-acetylaspartate (NAA), and taurine (Tau)33.
Figure 4.

(A) Time course and work flow of patient care associated with a typical 5-h neurosurgery in the AMIGO, MRI-equipped, operative suite at Brigham and Women’s Hospital. (B) Negative ion mode DESI mass spectra obtained using an amaZon Speed ion trap from m/z 130–165 (Bruker Daltonics) from a swab (Left), a smear (Center), and a section (Right) for sample S72. (C) Normalized 2-HG signal is represented with a warm color scale as indicated by the scale bar, set from the lowest (yellow) to highest (orange) levels detected from this individual case. Stereotactic positions were digitally registered to the preoperative MRI using neuronavigation (BrainLab system) in a standard operating room. The 3D tumor volume is shown (Upper). Classification results of samples S74, S72, S73, and S71 are further visualized on axial sections (Lower)34.
MRSI has also been used to evaluate the effectiveness of radiotherapy for brain tumors, as well as the possible radiation damage to the brain tissue. Metabolite changes in the brain before and after radiotherapy for nasopharyngeal cancer have been compared to reveal the outcome of brain radiation injury and possible repair mechanisms35. Forty-seven nasopharyngeal cancer patients underwent MRI and MRS at 1.5T before radiotherapy and at each dose of 20, 40, and 60 Gy, and with MRS follow-up at 6 and 12 months post completion of radiotherapy. Compared with metabolite levels prior to radiotherapy, the three measured metabolite concentration ratios of NAA/Cr, Cho/Cr, and NAA/Cho were all reduced at the end of radiotherapy. However, these ratios steadily rebounded from the fourth through twelfth month post radiotherapy. At month 12, the Cho/Cr and NAA/Cho ratios were only slightly lower than their pre-radiotherapy values and, when compared with levels immediately after the completion of radiotherapy, all three ratios were significantly increased by 24.46%, 13.39%, and 30.39%, respectively.
In vivo MRS metabolic imaging can be achieved with various techniques; and the utilization of an appropriate approach is critical for a particular clinical application. Among all the available approaches, the use of single voxel spectroscopy (SVS) or multi-voxel MRS imaging (MRSI) are the two most fundamental elections that need to be determined. A comparative study of SVS and MRSI at 1.5T for 36 pediatric patients with diffuse intrinsic pontine glioma between 1 and 21 years of age was conducted36. SVS is faster with less than five minutes of acquisition time and provides an assessment of all the measurable metabolites of tumor within a selected volume. MRSI, on the other hand, requires longer acquisition and processing times, but produces metabolic profiles from multiple voxels containing tumor and surrounding tissue. For the two metabolite ratios evaluated, Cho/NAA and Cho/Cr, there were strong linear correlations between SVS and MRSI data of r = 0.67 and r = 0.76, respectively (p < 0.0001 for each). Overall, SVS is most suitable for assessments of tumor metabolism before and after therapy, while MRSI could be best applied to evaluate targeted therapies and monitor surrounding areas for possible tumor invasion.
The utility of combining functional MR methods of diffusion tensor imaging (DTI) and MRS has also been compared with evaluations of the peritumoral area of cerebral gliomas in 45 histology-confirmed patients37. A gradual increase in the DTI measurements of fractional anisotropy (FA), an assessment of white matter organization, and NAA/Cr ratios and a gradual decrease in the Cho/Cr and lactate/lipids (LL)/Cr ratios were observed from the tumor center to the peritumoral zone for the four regions of interest measured (tumor center, perifocal edema, distant normal-appearing white matter, and contralateral normal-appearing white matter). The differences were significant when comparing mean FA (p < 0.001) and mean LL/Cr values for all regions (p < 0.05). The Cho/Cr ratio was significantly different between tumor center and both distant and contralateral normal-appearing white matter (p < 0.001), between perifocal edema and distant normal-appearing white matter (p = 0.013), and between perifocal edema and contralateral normal-appearing white matter (p = 0.011). Differences in NAA/Cr ratios between regions were not significant. The measured repeatability index r was measured with a single factor ANOVA and showed high repeatability for FA values and LL/Cr and Cho/Cr ratios. The LL/Cr ratio and FA value may present the best option for detecting the extent of glial tumors in vivo with high repeatability, and the Cho/Cr ratio could be best utilized in presenting additional information about the perifocal edema zone, where there is a high concentration of tumor cells. Thus, varying techniques used in concert can provide complementary information that could be useful in diagnosing and monitor disease in clinic.
In addition to utilizing MR approaches alone, recently, the feasibility of simultaneous acquisition of MRS and PET for the purposes of grading tumors and examining spatial distributions of metabolic changes in glioma in vivo has been tested using MR-compatible PET detectors mounted on modified 3T whole-body MRI scanners38. Twenty-eight patients with histologically confirmed gliomas (16 LGG and 12 HGG) underwent simultaneous methionine (Met) MR-PET to identify the most malignant tumor part before surgical interventions. Tumor to normal brain (T/N) Met uptake ratios and the metabolite peaks, Cho, Cr, and NAA, were measured. The median Met uptake was significantly different between LGG and HGG (p = 0.01), with values of 1.4 (range, 1–2.0) and 2.3 (range, 1.7–3), respectively. The Spearman rank correlations of metabolic markers in LGG showed a significant correlation between Met uptake and Cr/NAA (p = 0.015), as well as between Cho/NAA and Cr/NAA ratios (p = 0.0002). High expression of amino acid transporters was showed in two patients with LGG through the T/N Met uptake ratio, indicative of proliferating cell populations, but didn’t spatially correlate with neuronal cell loss and cell membrane proliferation, measured via Cho/NAA with MRS. Increased Cr/NAA was associated with increased Met uptake in LGG. Combined MR-PET imaging presented itself as a useful clinical tool in diagnosis and pre- surgical planning.
Metabolic Imaging Beyond the Brain
As MR methodologies improve, including increases in field strength, designs of new coils, and implementation of advanced pulse sequences, organs other than the brain have entered the focuses of MRS-based metabolic imaging. Most noticeably, the development of internal endorectal receiving coils used in combination with external phased-array coils has led to increased signal intensity and spatial resolution seen with in vivo MRS for patients with prostate cancer (PCa). Since the early 2000’s, the combination of quantitative dynamic contrast-enhanced (DCE) MRI with 2D MRSI39 and creation of pulse sequences to control J-modulation and allow citrate to remain in phase in spectra with a reasonable echo time40 have allowed the use of MR spectroscopic imaging (MRSI) to study PCa in vivo, with particular emphasis on evaluation of disease aggressiveness and stage41–43 and treatment response44–46. Multi-voxel MRSI in conjunction with MRI has also showed better correlations with patient pathological Gleason grade than results from biopsy, MRI, or MRSI alone47. Fifty-two patients underwent MRI and multi-voxel MRSI 6–8 weeks post biopsy and subsequent prostatectomy. A total of 86 cancer locations were identified from step-section pathological evaluations of the entire prostates after prostatectomies. Biopsy identified 74 locations with 12 false-negative and six false positive (sensitivity of 86%, specificity of 67%, and accuracy of 83%). MRI detected 72 locations (sensitivity of 84%, specificity of 89%, and accuracy of 85%) and multi-voxel MRSI detected 72 locations (sensitivity of 84%, specificity of 78%, and accuracy of 83%). However, multi-voxel MRSI in conjunction with MRI detected 78 locations with eight false-negative and four false-positive (sensitivity of 91%, specificity of 78%, and accuracy of 88%). Cohen’s test confirmed that biopsy had a lower level of agreement with histology than multi-voxel MRSI with MRI (0.559, moderate agreement, versus 0.735, good agreement). These results suggest the possible role of MRSI as a non-invasive measure of predicting PCa aggressiveness.
Recently, MRSI was used to assess PCa aggressiveness by measuring ratios of metabolites in 43 patients with biopsy-proven PCa48. With in vivo MRSI, a larger (Cho+Cr)/citrate (Cit) ratio was determined to significantly correlate to high grade PCa (p = 0.02; r = 0.27), as defined by containing a Gleason grade of 4 as the primary and/or 5 as a primary/secondary or tertiary grade. There was also a significant difference between low grade, defined as containing only Gleason grade 2 and/or 3, and high grade tumors for the median Cho/Cr ratio (p < 0.01; r = 0.31), with higher grades showing a larger ratio. When measured by both in vivo MRSI and ex vivo high resolution magic angle spinning (HRMAS) MRS, a strong positive correlation between higher Gleason score and increased metabolic ratio of (Cho+Cr+spermine (Spm))/Cit also was found using Spearman’s rank correlations (ρ = 0.77 and ρ = 0.69, respectively; p < 0.001)49. Due to the higher resolution achieved using ex vivo HRMAS MRS in comparison with in vivo MRSI, the Spm peak, which is located between Cho and Cr, could be differentiated from the Cho and Cr peaks and is therefore included in the ratio calculations, to mimic the (Cho+Cr) values measured in vivo.
MRSI has also been used to evaluate the effectiveness of various PCa treatments. One such study used a combination of DCEMR and MRSI to measure changes in metabolite levels at baseline and regular time intervals thereafter (4, 12, and 24 weeks) during hormone therapy50. At baseline measurements, healthy prostate tissue showed higher levels of Cit and intermediate levels of Cho and Cr, on the other hand, PCa tissue showed a reduction in Cit and an increase in Cho+Cr. During hormone therapy, while there were no significant correlations between MRSI/DCEMR variations and patient age, pretreatment serum prostate specific antigen (PSA) levels, or Gleason score, there was a significant time-dependent loss of all prostate metabolites in both healthy and PCa tissue during hormone therapy (p < 0.01), resulting in complete metabolic atrophy after 24 weeks of hormone therapy for 30% of patients. In PCa tissue, the loss of metabolites was delayed compared with healthy tissue, with no variation observed after four weeks and higher variation from healthy tissue observed after 24 weeks than after 12 weeks. In addition to the presence of metabolic atrophy, Cit decreased the fastest and correlated significantly (r = 0.4530; p < 0.01) with serum PSA levels. Patients with detectable Cit had significantly (p < 0.05) higher mean PSA levels (at 24 weeks, mean: 3.5 ± 0.5 ng/mL) than those without detectable Cit (at 24 weeks, mean: 0.85 ± 0.9 ng/mL). With DCEMR, the parameters of onset-time of signal enhancement and time-to-peak significantly (p < 0.05) increased at 12 and 24 weeks. These results suggest that MRSI and DCEMR could be used adjuvantly with PSA levels as a noninvasive method for monitoring time-dependent efficacy of hormone therapy. Similarly, MRSI has also been used to measure metabolic atrophy (defined as Cho, Cr, and Cit peak area to noise ratio < 5:1) in 109 patients after hormone and external beam irradiation therapies51. Patients were divided into three groups by time elapses between external beam irradiation and the time of MRSI tests after irradiations while continuing receiving hormone therapy in the duration to achieve complete clinical response. MRSI detected metabolic atrophy in 20 out of 37 patients less than one year after irradiation (54.1%); in 32 out of 36 patients one to two years post irradiation (88.9%); and in 34 out of 36 patients greater than two years post irradiation (94.5%). Since metabolic atrophy is indicative of successful treatment, as cancer growth cannot occur without metabolite activities, the results support the continued use of hormone therapy after external beam irradiation, as well as the use of MRSI to measure response status. Additionally, MRSI measured metabolic atrophy has been investigated to correlate biochemical relapse represented by increases in serum PSA levels after treatments52. Out of 50 patients measured after external beam radiation therapy, 13 patients (27%) showed complete metabolic atrophy (Cho + Cr/ Cit ratio < 0.2) at three months post therapy, which was maintained throughout subsequent follow ups at six, 12, 18, and 24 months. 35 patients showed partial response to therapy, with a Cho + Cr/Cit ratio between 0.2 and 0.8 at both 3 and 6 months. Metabolic atrophy was reached at 12 months for 30 of these patients. Five patients developed a recurrence (Cho + Cr/Cit ratio > 0.8) at 12 months, which led to a biochemical relapse at 18 months for three patients and 24 months for two patients. MRSI characterized metabolic changes was also used to evaluate the temporary PSA increase also known as the PSA “bounce” period, which can occur in 30–40% of patients after 125I brachytherapy53. A definitive decrease in the Cho + Cr/Cit ratio was observed post therapy (Figure 5). For 21 out of 24 patients, the PSA “bounce” was benign and did not lead to recurrence. For two patients with local recurrence, a continued increase in Cho + Cr/Cit ratio and PSA levels were observed over time. The one patient with serum PSA increase but no residual cancer showed decreasing in Cho + Cr/Cit ratio. Thus, MRSI measurable metabolic activity in conjunction with PSA levels monitoring may provide more complete evaluations of treatment response for patients.
Figure 5.

Example of the relationship between prostate-specific antigen (PSA) and metabolic activity during a PSA bounce for one patient. Magnetic resonance spectroscopy (MRSI) index is *[Cho+Cr]/Cit _ (signal/noise)choline53.
Further technology developments have also been reported by recent studies. Application of a PRESS sequence with the conformal voxel MRS (CV-MRS), a technique which automatically optimizes the placement of numerous spatial saturation planes to adapt the excitation volume to the shape of the prostate, was combined with a spectral-spatial 90° radiofrequency (RF) excitation pulse. This was tested at 1.5T, for the effect of CV-MRS, on 10 healthy volunteers using the standard disposable endorectal coil inflated with approximately 75 mL of FC-77 FLUORINERT, a perfluocarbon compound, to ensure that the coil remained pressed against the prostate54. By decreasing the TE from 130 ms to 40 ms, the full citrate multiplet was observed, as well as the peaks for m-Ino, scyllo-inositol, taurine, and Glx, with a 35% improvement in the number of peaks. Cit detection improved 42 ± 24% over the entire prostate volume, with a range of improvements from 16% to 100%. With CV-MRS, metabolites with a short TE were consistently measured while the signal-to-noise and baseline improved.
Another promising area of advancement seen with MRSI relates to the recent developments in hyperpolarization technologies. Hyperpolarized [1-13C]pyruvate has been used for in vivo 13C MRSI as a noninvasive tool for characterizing changes in tumor metabolism for patients with PCa55. This methodology explores the well-known Warburg effect of cancer cells’ ability of converting pyruvate to lactate and evaluates the potential relationship between this conversion and the aggressiveness of cancer. 31 patients with biopsy-proven PCa were injected with hyperpolarized [1-13C]pyruvate and scanned with 13C MRSI (Figure 6). No dose-limiting toxicities were observed and the best signal-to-noise ratio was observed with the highest dose used (0.43 ml/kg of 230 mM agent). Elevated [1-13C]lactate/[1-13C]pyruvate ratios were observed in regions of biopsy-proven PCa, emphasizing the promising potentials of hyperpolarized 13C agents in combination with MRSI to enhance prostate cancer diagnosis and monitor treatment effectiveness.
Figure 6.
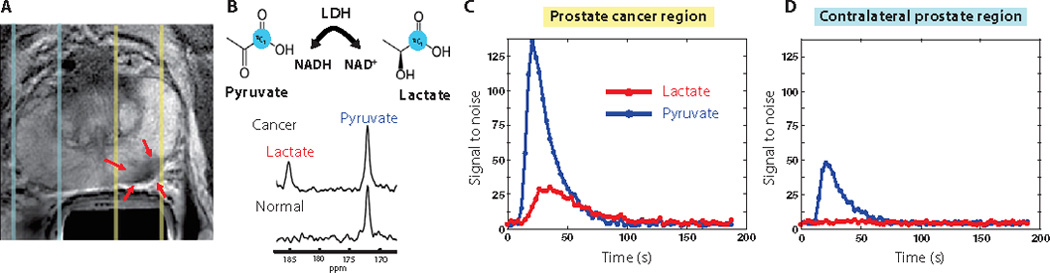
Images are from a representative patient with a current PSA od 12.2 ng/ml, a small volume of biopsy-proven Gleason grade 4 + 3 PCa in the left midgland, and who received the lowest dose (0.14 ml/kg) of hyperpolarized [1-13C]pyruvate. (A) Axial T2-weighted image showing slices (dashed lines) obtained from 1D spectral localization. The slice that overlaps the left prostatic peropheral zone (right side of image) contained a small focus of reduced T2 signal intensity corresponding to the region of biopsy-proven PCa (red arrows). The slice overlapping the right peripheral zone (left side of image) contains only normal prostate tissue. (B) Flux of [1-13C]pyruvate to [1-13C]lactate catalyzed by LDH (top) Dynamic 13C spectra were obtained from the same patient in (A) at 36 s after injection of hyperpolarized [1-13C]pyruvate (bottom). The cancer spectrum demonstrated a lactate SNR of 25 owing to the high flux of hyperpolarized [1-13C]pyruvate to [1-13C]lactate. (C) Plot of 1D localized dynamic hyperpolarized pyruvate and lactate data from the slice that overlapped a contralateral region of the prostate55.
Methodology Development
Developments in MRS techniques and data acquisition paradigms are continually being designed and tested mostly achieved with human volunteers. As field strength of MR clinical scanner increases, optimization of in vivo MRS at 7T for future clinical use has been attended. Optimized 7T-stimulated echo-acquisition mode (STEAM) method with variable-rate selective excitation pulses has been tested for investigating regional variations in GABA, Gln, and Glu compared with metabolite distribution along cingulate subregions in healthy volunteers56. All three metabolites could be measured accurately with mean signal-to-noise ratios >30 and mean full width at half the maximum values <10 Hertz for all regions except pregenual anterior cingulate cortex (14.6 Hertz). Retest reliability was quantified and assured by intraclass correlation coefficient of >0.75 in all cases for all spectra completing the minimum testing concentrations for two measurements on two separate testing days. Repeated-measured ANOVA showed a significant main effect for regional metabolite concentrations without correction for grey matter content (p < 0.001), as well as a significant interaction effect for metabolite by brain regions (p = 0.001). GABA was found in significantly higher concentrations in pregenual anterior cingulate cortex than other regions (p < 0.008). Gln concentrations were significantly higher in the pregenual anterior cingulate cortex than in the anterior mid-cingulate cortex (p = 0.003), rostral posterior cingulate cortex (p = 0.001), and caudal posterior cingulate cortex (p = 0.001). Glu concentrations were also significantly higher in the pregenual anterior cingulate cortex than in the anterior mid-cingulate cortex (p = 0.001) and rostral posterior cingulate cortex (p = 0.010). Modified point resolved spectroscopy pulse (PRESS) at 7T in vivo has also been optimized for detection of GABA, Glu, and Gln, which overlapped in short TE MRS and made precise quantifications of these metabolites difficult57. Numerical simulations led to a PRESS sub-echo times set (TE1, TE2) = (31,61) ms for detection of GABA and Glu, where TE1 and TE2 are the sub-echo times of the first and second slice-selective 180° RF pulses, respectively. Applying the resulting PRESS TE = 92 ms, the linewidths for both GABA and Glu multiplets between 2.2 and 2.4 ppm were narrowed and separated. GABA concentration was estimated to be approximately seven times higher in grey matter than in white matter, with overall higher concentrations in the frontal compared with the occipital brain. Glu was approximately two times higher in grey matter than in white matter in both the fontal and occipital brain. Gln was significantly different between frontal grey matter and white matter, but no significant difference was observed between occipital grey and white matter. These result indicate that the PRESS TE = 92 ms methods is effective for measuring GABA and nearby metabolites in vivo at 7T.
On the other hand, metabolic differences between white matter and grey matter have also been estimated to account for partial volumes effects when the other matter is diffused into the matter of interest58. After studying with 18 volunteers, it was found that NAA, Cr, Cho, and myo-Ino concentrations in grey matter were 8.5 ± 0.7, 6.9 ± 0.6, 1.2 ± 0.2, and 5.3 ± 06 mM, while those in white matter were 7.7 ± 0.6, 4.9 ± 0.5, 1.4 ± 0.1, and 4.4 ± 0.6 mM, respectively. Thus grey and white matter absolute quantification can vary by 5–10% when mixtures are studied.
Research work at 7T also investigated whether metabolite changes in the cortex during prolonged visual stimulation correlate to blood oxygenation level-dependent functional MRI (BOLD-fMRI) with 12 healthy volunteers59. During stimulation, the changes in Asp, glucose, Gly, and Lac concentrations with a range of ± 0.2 to 0.3 µmol/g were highly significant, suggesting their use as biomarkers of neuronal activation in the visual cortex. The BOLD-fMRI amplitudes during stimulation were significantly correlated positively with relative concentration changes in glucose (r = 0.73; p = 0.01) and Lac (r = 0.65; p = 0.003) (Figure 7). There was also a significant inverse correlation between BOLD-fMRI amplitude and the resting-state concentration of GABA (r = −0.65; p = 0.043).
Figure 7.

(A) Time courses of glutamate and lactate concentrations during the visual stimulation paradigm (number of scans= 32, 2.7 minutes resolution) in individual subjects (N=12). The MRS data acquired in the second halves of the STIM and REST periods (black points) were used to calculate concentration differences between the STIM and REST conditions and for statistical analysis of fMRS data. (B) Time courses of glutamate and lactate concentrations with high temporal resolution. The fMRS data of four scans (20 seconds) were summed across all subjects (N =12). The resulting spectra (4 scans × 12 subjects =48 scans per time point) were quantified by LCModel. The error bars indicate CRLBs. CRLBs, Cramèr-Rao lower bounds; fMRS, functional magnetic resonance spectroscopy; REST, resting condition; STIM, stimulation period59.
In addition to in vivo metabolic imaging, advances have occurred in metabolomic imaging as well. While metabolic imaging measures metabolites, metabolomics evaluates all of the measurable metabolites and their changes within a metabolome, providing a more comprehensive understanding of physiological and pathological processes, and therefore valuable insight into disease progression, than can be achieved through examinations of any one metabolite or pathway. One study examined the metabolomic profiles of PCa as measured at 7T from whole prostates removed during prostatectomy60. First, metabolic regions and corresponding principal component analysis (PCA) loading factors for each region were determined by measuring human prostate biopsy cores ex vivo at 14T using HRMAS MRS. Introduced in 199661, HRMAS MRS borrows from the solid-state MRS line-narrowing concept of magic angle spinning applying a mechanical rotation of the tissue sample at a 54.7° angle from the magnetic field to allow for high resolution observation of metabolites from intact tissue, which is preserved for subsequent histopathology. These loading factors for each region between 0.5 and 4.5 ppm were applied to metabolic intensities already normalized by the spectral intensity for each voxel, which served as a malignancy index. This malignancy index, linearly correlated with lesion size, has a 93 to 97% overall accuracy for detecting PCa lesions. This technique demonstrates the importance of better understanding metabolomic profiles ex vivo to improve biochemical understanding and applications to diagnostic technology, as well as the utility of measuring and analyzing the complete metabolomic profile to understand disease physiology.
Conclusions
Metabolic imaging can significantly contribute to understanding and characterizing different diseases, as well as natural processes such as aging. As techniques improve, MRS and PET show great potential for enhancing diagnosis in clinic, as well as monitoring treating and prognosis, while MS has already been successfully used to complement pathology for diagnosis and margin evaluation during surgery, and could be used to help inform surgical treatment.
Acknowledgments
We thank the Massachusetts General Hospital Athinoula A. Martinos Center for Biomedical Imaging for research support. Funding: This work was funded by PHS NIH grants CA115746, CA115746S2, and CA162959.
Abbreviations
- 2HG
2-hydroxyglutarate
- 3D
three-dimensional
- AD
Alzheimer’s disease
- ALS
amyotrophic lateral sclerosis
- aMCI
amnestic mild cognitive impairment
- ANOVA
analysis of variance
- aPS
atypical parkinsonian syndrome (aPS)
- BOLD-fMRI
blood oxygenation level-dependent functional MRI
- Cho
choline
- Cit
citrate
- Cr
creatine
- CST
corticospinal tract
- CV-MRS
conformal voxel MRS
- DCE
dynamic contrast-enhanced
- DESI
desorption electrospray ionization
- DLB
dementia with Lewy bodies
- DTI
diffusion tensor imaging
- FA
fractional anisotropy
- FDG-PET
fluorodeoxyglucose-PET
- GABA
γ-aminobutyric acid
- Glu
glutamate
- Glx
combined glutamate and glutamine
- GPC
glycerophosphocholine
- Gy
gray
- HD
Huntington’s disease
- HGG
high-grade gliomas
- HRMAS
high resolution magic angle spinning
- IDH1
isocitrate dehydrogenase-1
- Ino
inositol
- ITN
idiopathic trigeminal neuralgia
- iPD
idiopathic Parkinson’s disease
- LGG
low-grade gliomas
- LL
lactate/lipids
- Met
methionine
- m-Ino
myo-Inositol
- mM
millimolar
- MR
magnetic resonance
- MRI
magnetic resonance imaging
- MRS
magnetic resonance spectroscopy
- MRSI
magnetic resonance spectroscopic imaging
- MS
mass spectrometry
- MS
multiple sclerosis
- m/z
mass to charge ratio
- NAA
N-acetyl aspartate
- NMDA
N-methyl D-aspartate
- OCD
obsessive-compulsive disorder
- PC
phosphocholine
- PCa
prostate cancer
- PCG
posterior cingulate gyrus
- PD
Parkinson’s disease
- PET
positron emission tomography
- PRESS
modified point resolved spectroscopy pulse
- PSA
prostate specific antigen
- PTSD
posttraumatic stress disorder
- PWI
perfusion weighted imaging
- RF
radiofrequency
- SN
substantia nigra
- Spm
spermine
- STEAM
stimulated echo-acquisition mode
- SUV
standardized uptake value
- SVS
single voxel spectroscopy
- T
tesla
- TD
tumefactive demyelination
- T/N
tumor to normal brain
- TSI
turbo spectroscopic imaging
Footnotes
Competing Interests: The authors acknowledge no competing financial interests.
Author Contributions: Fuss: research, writing; Cheng: research, writing, funding.
References
- 1.Kudo T. Metabolic imaging using PET. European journal of nuclear medicine and molecular imaging. 2007 Jun;34(Suppl 1):S49–S61. doi: 10.1007/s00259-007-0440-3. [DOI] [PubMed] [Google Scholar]
- 2.Horska A, Barker PB. Imaging of brain tumors: MR spectroscopy and metabolic imaging. Neuroimaging clinics of North America. 2010 Aug;20(3):293–310. doi: 10.1016/j.nic.2010.04.003. [DOI] [PMC free article] [PubMed] [Google Scholar]
- 3.Haga KK, Khor YP, Farrall A, Wardlaw JM. A systematic review of brain metabolite changes, measured with 1H magnetic resonance spectroscopy, in healthy aging. Neurobiology of aging. 2009 Mar;30(3):353–363. doi: 10.1016/j.neurobiolaging.2007.07.005. [DOI] [PubMed] [Google Scholar]
- 4.Saunders DE, Howe FA, van den Boogaart A, Griffiths JR, Brown MM. Aging of the adult human brain: in vivo quantitation of metabolite content with proton magnetic resonance spectroscopy. Journal of magnetic resonance imaging : JMRI. 1999 May;9(5):711–716. doi: 10.1002/(sici)1522-2586(199905)9:5<711::aid-jmri14>3.0.co;2-3. [DOI] [PubMed] [Google Scholar]
- 5.Chang L, Ernst T, Poland RE, Jenden DJ. In vivo proton magnetic resonance spectroscopy of the normal aging human brain. Life sciences. 1996;58(22):2049–2056. doi: 10.1016/0024-3205(96)00197-x. [DOI] [PubMed] [Google Scholar]
- 6.Yang A, Xiao X, Wang Z. Evaluation of normal changes in pons metabolites due to aging using turbo spectroscopic imaging. AJNR. American journal of neuroradiology. 2014 Nov-Dec;35(11):2099–2105. doi: 10.3174/ajnr.A4031. [DOI] [PMC free article] [PubMed] [Google Scholar]
- 7.Gruber S, Bogner W, Stadlbauer A, Krssak M, Bodamer O. Magnetic resonance spectroscopy in patients with Fabry and Gaucher disease. European journal of radiology. 2011 Aug;79(2):295–298. doi: 10.1016/j.ejrad.2010.01.002. [DOI] [PubMed] [Google Scholar]
- 8.Levin BE, Katzen HL, Maudsley A, et al. Whole-brain proton MR spectroscopic imaging in Parkinson's disease. Journal of neuroimaging : official journal of the American Society of Neuroimaging. 2014 Jan-Feb;24(1):39–44. doi: 10.1111/j.1552-6569.2012.00733.x. [DOI] [PMC free article] [PubMed] [Google Scholar]
- 9.Groger A, Bender B, Wurster I, Chadzynski GL, Klose U, Berg D. Differentiation between idiopathic and atypical parkinsonian syndromes using three-dimensional magnetic resonance spectroscopic imaging. Journal of neurology, neurosurgery, and psychiatry. 2013 Jun;84(6):644–649. doi: 10.1136/jnnp-2012-302699. [DOI] [PubMed] [Google Scholar]
- 10.Zhong X, Shi H, Shen Z, et al. 1H-proton magnetic resonance spectroscopy differentiates dementia with Lewy bodies from Alzheimer's disease. Journal o Alzheimer's disease : JAD. 2014;40(4):953–966. doi: 10.3233/JAD-131517. [DOI] [PubMed] [Google Scholar]
- 11.Wang Y, Li D, Bao F, et al. Thalamic metabolic alterations with cognitive dysfunction in idiopathic trigeminal neuralgia: a multivoxel spectroscopy study. Neuroradiology. 2014 Aug;56(8):685–693. doi: 10.1007/s00234-014-1376-5. [DOI] [PubMed] [Google Scholar]
- 12.Govind V, Sharma KR, Maudsley AA, Arheart KL, Saigal G, Sheriff S. Comprehensive evaluation of corticospinal tract metabolites in amyotrophic lateral sclerosis using whole-brain 1H MR spectroscopy. PloS one. 2012;7(4):e35607. doi: 10.1371/journal.pone.0035607. [DOI] [PMC free article] [PubMed] [Google Scholar]
- 13.van den Bogaard SJ, Dumas EM, Teeuwisse WM, et al. Exploratory 7-Tesla magnetic resonance spectroscopy in Huntington's disease provides in vivo evidence for impaired energy metabolism. Journal of neurology. 2011 Dec;258(12):2230–2239. doi: 10.1007/s00415-011-6099-5. [DOI] [PMC free article] [PubMed] [Google Scholar]
- 14.Tur C, Wheeler-Kingshott CA, Altmann DR, Miller DH, Thompson AJ, Ciccarelli O. Spatial variability and changes of metabolite concentrations in the cortico-spinal tract in multiple sclerosis using coronal CSI. Human brain mapping. 2014 Mar;35(3):993–1003. doi: 10.1002/hbm.22229. [DOI] [PMC free article] [PubMed] [Google Scholar]
- 15.Saini J, Chatterjee S, Thomas B, Kesavadas C. Conventional and advanced magnetic resonance imaging in tumefactive demyelination. Acta radiologica (Stockholm, Sweden: 1987) 2011 Dec 1;52(10):1159–1168. doi: 10.1258/ar.2011.110007. [DOI] [PubMed] [Google Scholar]
- 16.Meyerhoff DJ, Mon A, Metzler T, Neylan TC. Cortical gamma-aminobutyric acid and glutamate in posttraumatic stress disorder and their relationships to self-reported sleep quality. Sleep. 2014 May;37(5):893–900. doi: 10.5665/sleep.3654. [DOI] [PMC free article] [PubMed] [Google Scholar]
- 17.Pennington DL, Abe C, Batki SL, Meyerhoff DJ. A preliminary examination of cortical neurotransmitter levels associated with heavy drinking in posttraumatic stress disorder. Psychiatry research. 2014 Dec 30;224(3):281–287. doi: 10.1016/j.pscychresns.2014.09.004. [DOI] [PMC free article] [PubMed] [Google Scholar]
- 18.Tandon N, Bolo NR, Sanghavi K, et al. Brain metabolite alterations in young adults at familial high risk for schizophrenia using proton magnetic resonance spectroscopy. Schizophrenia research. 2013 Aug;148(1–3):59–66. doi: 10.1016/j.schres.2013.05.024. [DOI] [PubMed] [Google Scholar]
- 19.Howells FM, Ives-Deliperi VL, Horn NR, Stein DJ. Increased thalamic phospholipid concentration evident in bipolar I disorder. Progress in neuro-psychopharmacology & biological psychiatry. 2013 Mar 5;41:1–5. doi: 10.1016/j.pnpbp.2012.10.026. [DOI] [PubMed] [Google Scholar]
- 20.Xu J, Dydak U, Harezlak J, et al. Neurochemical abnormalities in unmedicated bipolar depression and mania: a 2D 1H MRS investigation. Psychiatry research. 2013 Sep 30;213(3):235–241. doi: 10.1016/j.pscychresns.2013.02.008. [DOI] [PMC free article] [PubMed] [Google Scholar]
- 21.Howells FM, Uhlmann A, Temmingh H, et al. (1)H-magnetic resonance spectroscopy ((1)H-MRS) in methamphetamine dependence and methamphetamine induced psychosis. Schizophrenia research. 2014 Mar;153(1–3):122–128. doi: 10.1016/j.schres.2014.01.029. [DOI] [PubMed] [Google Scholar]
- 22.Jia Y, Zhong S, Wang Y, Liu T, Liao X, Huang L. The correlation between biochemical abnormalities in frontal white matter, hippocampus and serum thyroid hormone levels in first-episode patients with major depressive disorder. Journal of affective disorders. 2015 Jul 15;180:162–169. doi: 10.1016/j.jad.2015.04.005. [DOI] [PubMed] [Google Scholar]
- 23.O'Neill J, Piacentini JC, Chang S, et al. MRSI correlates of cognitive-behavioral therapy in pediatric obsessive-compulsive disorder. Progress in neuro-psychopharmacology & biological psychiatry. 2012 Jan 10;36(1):161–168. doi: 10.1016/j.pnpbp.2011.09.007. [DOI] [PMC free article] [PubMed] [Google Scholar]
- 24.Yang ZX, Huo SS, Cheng XF, et al. Quantitative multivoxel proton MR spectroscopy study of brain metabolites in patients with amnestic mild cognitive impairment: a pilot study. Neuroradiology. 2012 May;54(5):451–458. doi: 10.1007/s00234-011-0900-0. [DOI] [PubMed] [Google Scholar]
- 25.Zimny A, Bladowska J, Macioszek A, et al. Evaluation of the posterior cingulate region with FDG-PET and advanced MR techniques in patients with amnestic mild cognitive impairment: comparison of the methods. Journal of Alzheimer's disease : JAD. 2015;44(1):329–338. doi: 10.3233/JAD-132138. [DOI] [PubMed] [Google Scholar]
- 26.Alkan A, Sharifov R, Akkoyunlu ME, et al. MR spectroscopy features of brain in patients with mild and severe obstructive sleep apnea syndrome. Clinical imaging. 2013 Nov-Dec;37(6):989–992. doi: 10.1016/j.clinimag.2013.07.010. [DOI] [PubMed] [Google Scholar]
- 27.Ristic AJ, Ostojic J, Kozic D, et al. Hippocampal metabolic dysfunction in juvenile myoclonic epilepsy: 3D multivoxel spectroscopy study. Journal of the neurological sciences. 2011 Jun 15;305(1–2):139–142. doi: 10.1016/j.jns.2010.12.022. [DOI] [PubMed] [Google Scholar]
- 28.Cecil KM, Dietrich KN, Altaye M, et al. Proton magnetic resonance spectroscopy in adults with childhood lead exposure. Environmental health perspectives. 2011 Mar;119(3):403–408. doi: 10.1289/ehp.1002176. [DOI] [PMC free article] [PubMed] [Google Scholar]
- 29.Li J, Zhang XY, Wang B, et al. Multivoxel proton magnetic resonance spectroscopy in heat stroke. Clinical radiology. 2015 Jan;70(1):37–41. doi: 10.1016/j.crad.2014.09.004. [DOI] [PubMed] [Google Scholar]
- 30.Ferlay J, Soerjomataram I, Dikshit R, et al. Cancer incidence and mortality worldwide: Sources, methods and major patterns in GLOBOCAN 2012. International Journal of Cancer. 2015;136(5):E359–E386. doi: 10.1002/ijc.29210. [DOI] [PubMed] [Google Scholar]
- 31.Caivano R, Lotumolo A, Rabasco P, et al. 3 Tesla magnetic resonance spectroscopy: cerebral gliomas vs. metastatic brain tumors. Our experience and review of the literature. The International journal of neuroscience. 2013 Aug;123(8):537–543. doi: 10.3109/00207454.2013.774395. [DOI] [PubMed] [Google Scholar]
- 32.Georgiadis P, Kostopoulos S, Cavouras D, et al. Quantitative combination of volumetric MR imaging and MR spectroscopy data for the discrimination of meningiomas from metastatic brain tumors by means of pattern recognition. Magnetic resonance imaging. 2011 May;29(4):525–535. doi: 10.1016/j.mri.2010.11.006. [DOI] [PubMed] [Google Scholar]
- 33.Andronesi OC, Kim GS, Gerstner E, et al. Detection of 2-hydroxyglutarate in IDH-mutated glioma patients by in vivo spectral-editing and 2D correlation magnetic resonance spectroscopy. Science translational medicine. 2012 Jan 11;4(116):116ra114. doi: 10.1126/scitranslmed.3002693. [DOI] [PMC free article] [PubMed] [Google Scholar]
- 34.Santagata S, Eberlin LS, Norton I, et al. Intraoperative mass spectrometry mapping of an onco-metabolite to guide brain tumor surgery. Proceedings of the National Academy of Sciences of the United States of America. 2014 Jul 29;111(30):11121–11126. doi: 10.1073/pnas.1404724111. [DOI] [PMC free article] [PubMed] [Google Scholar]
- 35.Chen WS, Li JJ, Zhang JH, et al. Magnetic resonance spectroscopic imaging of brain injury after nasopharyngeal cancer radiation in early delayed reaction. Genetics and molecular research : GMR. 2014;13(3):6848–6854. doi: 10.4238/2014.August.29.6. [DOI] [PubMed] [Google Scholar]
- 36.Steffen-Smith EA, Venzon DJ, Bent RS, Hipp SJ, Warren KE. Single- and multivoxel proton spectroscopy in pediatric patients with diffuse intrinsic pontine glioma. International journal of radiation oncology, biology, physics. 2012 Nov 1;84(3):774–779. doi: 10.1016/j.ijrobp.2012.01.032. [DOI] [PMC free article] [PubMed] [Google Scholar]
- 37.Bieza A, Krumina G. Magnetic resonance study on fractional anisotropy and neuronal metabolite ratios in peritumoral area of cerebral gliomas. Medicina (Kaunas, Lithuania) 2012;48(10):497–506. [PubMed] [Google Scholar]
- 38.Bisdas S, Ritz R, Bender B, et al. Metabolic mapping of gliomas using hybrid MR-PET imaging: feasibility of the method and spatial distribution of metabolic changes. Investigative radiology. 2013 May;48(5):295–301. doi: 10.1097/RLI.0b013e31827188d6. [DOI] [PubMed] [Google Scholar]
- 39.van Dorsten FA, van der Graaf M, Engelbrecht MR, et al. Combined quantitative dynamic contrast-enhanced MR imaging and (1)H MR spectroscopic imaging of human prostate cancer. Journal of magnetic resonance imaging : JMRI. 2004 Aug;20(2):279–287. doi: 10.1002/jmri.20113. [DOI] [PubMed] [Google Scholar]
- 40.Cunningham CH, Vigneron DB, Marjanska M, et al. Sequence design for magnetic resonance spectroscopic imaging of prostate cancer at 3 T. Magnetic resonance in medicine. 2005 May;53(5):1033–1039. doi: 10.1002/mrm.20478. [DOI] [PubMed] [Google Scholar]
- 41.Coakley FV, Qayyum A, Kurhanewicz J. Magnetic resonance imaging and spectroscopic imaging of prostate cancer. The Journal of urology. 2003 Dec;170(6 Pt 2):S69–S75. doi: 10.1097/01.ju.0000094958.23276.c4. discussion S75-66. [DOI] [PubMed] [Google Scholar]
- 42.Carlani M, Mancino S, Bonanno E, Finazzi Agro E, Simonetti G. Combined morphological, [1H]-MR spectroscopic and contrast-enhanced imaging of human prostate cancer with a 3-Tesla scanner: preliminary experience. La Radiologia medica. 2008 Aug;113(5):670–688. doi: 10.1007/s11547-008-0271-8. [DOI] [PubMed] [Google Scholar]
- 43.Swanson MG, Vigneron DB, Tabatabai ZL, et al. Proton HR-MAS spectroscopy and quantitative pathologic analysis of MRI/3D-MRSI-targeted postsurgical prostate tissues. Magnetic resonance in medicine. 2003 Nov;50(5):944–954. doi: 10.1002/mrm.10614. [DOI] [PubMed] [Google Scholar]
- 44.Mueller-Lisse UG, Swanson MG, Vigneron DB, et al. Time-dependent effects of hormone-deprivation therapy on prostate metabolism as detected by combined magnetic resonance imaging and 3D magnetic resonance spectroscopic imaging. Magnetic resonance in medicine. 2001 Jul;46(1):49–57. doi: 10.1002/mrm.1159. [DOI] [PubMed] [Google Scholar]
- 45.Pickett B, Kurhanewicz J, Coakley F, Shinohara K, Fein B, Roach M., 3rd Use of MRI and spectroscopy in evaluation of external beam radiotherapy for prostate cancer. International journal of radiation oncology, biology, physics. 2004 Nov 15;60(4):1047–1055. doi: 10.1016/j.ijrobp.2004.05.015. [DOI] [PubMed] [Google Scholar]
- 46.Pickett B, Ten Haken RK, Kurhanewicz J, et al. Time to metabolic atrophy after permanent prostate seed implantation based on magnetic resonance spectroscopic imaging. International journal of radiation oncology, biology, physics. 2004 Jul 1;59(3):665–673. doi: 10.1016/j.ijrobp.2003.11.024. [DOI] [PubMed] [Google Scholar]
- 47.Giusti S, Caramella D, Fruzzetti E, Lazzereschi M, Tognetti A, Bartolozzi C. Peripheral zone prostate cancer. Pre-treatment evaluation with MR and 3D (1)H MR spectroscopic imaging: correlation with pathologic findings. Abdominal imaging. 2010 Dec;35(6):757–763. doi: 10.1007/s00261-009-9577-9. [DOI] [PubMed] [Google Scholar]
- 48.Kobus T, Hambrock T, Hulsbergen-van de Kaa CA, et al. In vivo assessment of prostate cancer aggressiveness using magnetic resonance spectroscopic imaging at 3 T with an endorectal coil. European urology. 2011 Nov;60(5):1074–1080. doi: 10.1016/j.eururo.2011.03.002. [DOI] [PubMed] [Google Scholar]
- 49.Selnaes KM, Gribbestad IS, Bertilsson H, et al. Spatially matched in vivo and ex vivo MR metabolic profiles of prostate cancer -- investigation of a correlation with Gleason score. NMR in biomedicine. 2013 May;26(5):600–606. doi: 10.1002/nbm.2901. [DOI] [PubMed] [Google Scholar]
- 50.Sciarra A, Panebianco V, Salciccia S, et al. Determination of the time for maximal response to neoadjuvant hormone therapy for prostate cancer using magnetic resonance with spectroscopy (MRSI) and dynamic contrast enhancement (DCEMR) Urologic oncology. 2012 Sep;30(5):614–619. doi: 10.1016/j.urolonc.2010.09.006. [DOI] [PubMed] [Google Scholar]
- 51.Valentini AL, Gui B, D'Agostino GR, et al. Locally advanced prostate cancer: three-dimensional magnetic resonance spectroscopy to monitor prostate response to therapy. International journal of radiation oncology, biology, physics. 2012 Nov 1;84(3):719–724. doi: 10.1016/j.ijrobp.2011.12.089. [DOI] [PubMed] [Google Scholar]
- 52.Panebianco V, Barchetti F, Musio D, et al. Metabolic atrophy and 3-T 1H-magnetic resonance spectroscopy correlation after radiation therapy for prostate cancer. BJU international. 2014 Dec;114(6):852–859. doi: 10.1111/bju.12553. [DOI] [PubMed] [Google Scholar]
- 53.Kirilova A, Damyanovich A, Crook J, Jezioranski J, Wallace K, Pintilie M. 3D MR-spectroscopic imaging assessment of metabolic activity in the prostate during the PSA "bounce" following 125iodine brachytherapy. International journal of radiation oncology, biology, physics. 2011 Feb 1;79(2):371–378. doi: 10.1016/j.ijrobp.2009.10.066. [DOI] [PubMed] [Google Scholar]
- 54.Venugopal N, McCurdy B, Al Mehairi S, et al. Short echo time in vivo prostate (1)H-MRSI. Magnetic resonance imaging. 2012 Feb;30(2):195–204. doi: 10.1016/j.mri.2011.09.020. [DOI] [PubMed] [Google Scholar]
- 55.Nelson SJ, Kurhanewicz J, Vigneron DB, et al. Metabolic imaging of patients with prostate cancer using hyperpolarized [1-(1)(3)C]pyruvate. Science translational medicine. 2013 Aug 14;5(198):198ra108. doi: 10.1126/scitranslmed.3006070. [DOI] [PMC free article] [PubMed] [Google Scholar]
- 56.Dou W, Palomero-Gallagher N, van Tol MJ, et al. Systematic regional variations of GABA, glutamine, and glutamate concentrations follow receptor fingerprints of human cingulate cortex. The Journal of neuroscience : the official journal of the Society for Neuroscience. 2013 Jul 31;33(31):12698–12704. doi: 10.1523/JNEUROSCI.1758-13.2013. [DOI] [PMC free article] [PubMed] [Google Scholar]
- 57.Ganji SK, An Z, Banerjee A, Madan A, Hulsey KM, Choi C. Measurement of regional variation of GABA in the human brain by optimized point-resolved spectroscopy at 7 T in vivo. NMR in biomedicine. 2014 Oct;27(10):1167–1175. doi: 10.1002/nbm.3170. [DOI] [PMC free article] [PubMed] [Google Scholar]
- 58.Tal A, Kirov II, Grossman RI, Gonen O. The role of gray and white matter segmentation in quantitative proton MR spectroscopic imaging. NMR in biomedicine. 2012 Dec;25(12):1392–1400. doi: 10.1002/nbm.2812. [DOI] [PMC free article] [PubMed] [Google Scholar]
- 59.Bednarik P, Tkac I, Giove F, et al. Neurochemical and BOLD responses during neuronal activation measured in the human visual cortex at 7 Tesla. Journal of cerebral blood flow and metabolism : official journal of the International Society of Cerebral Blood Flow and Metabolism. 2015 Apr;35(4):601–610. doi: 10.1038/jcbfm.2014.233. [DOI] [PMC free article] [PubMed] [Google Scholar]
- 60.Wu CL, Jordan KW, Ratai EM, et al. Metabolomic imaging for human prostate cancer detection. Science translational medicine. 2010 Jan 27;2(16):16ra18. doi: 10.1126/scitranslmed.3000513. [DOI] [PMC free article] [PubMed] [Google Scholar]
- 61.Cheng LL, Lean CL, Bogdanova A, et al. Enhanced resolution of proton NMR spectra of malignant lymph nodes using magic-angle spinning. Magnetic resonance in medicine. 1996 Nov;36(5):653–658. doi: 10.1002/mrm.1910360502. [DOI] [PubMed] [Google Scholar]