

Abstract
This study was to determine occupational exposures to formaldehyde and to compare concentrations of formaldehyde obtained by active and passive sampling methods. In one pathology and one histology laboratories, exposure measurements were collected with sets of active air samplers (Supelco LpDNPH tubes) and passive badges (ChemDisk Aldehyde Monitor 571). Sixty-six sample pairs (49 personal and 17 area) were collected and analyzed by NIOSH NMAM 2016 for active samples and OSHA Method 1007 (using the manufacturer’s updated uptake rate) for passive samples. All active and passive 8-hour time-weighted average (TWA) measurements showed compliance with the OSHA permissible exposure limit (PEL-0.75 ppm) except for one passive measurement, whereas 78% for the active and 88% for the passive samples exceeded the NIOSH recommended exposure limit (REL-0.016 ppm). Overall, 73% of the passive samples showed higher concentrations than the active samples and a statistical test indicated disagreement between two methods for all data and for data without outliers. The OSHA Method cautions that passive samplers should not be used for sampling situations involving formalin solutions because of low concentration estimates in the presence of reaction products of formaldehyde and methanol (a formalin additive). However, this situation was not observed, perhaps because the formalin solutions used in these laboratories included much less methanol (3%) than those tested in the OSHA Method (up to 15%). The passive samplers in general overestimated concentrations compared to the active method, which is prudent for demonstrating compliance with an occupational exposure limit, but occasional large differences may be a result of collecting aerosolized droplets or splashes on the face of the samplers. In the situations examined in this study the passive sampler generally produces higher results than the active sampler so that a body of results from passive samplers demonstrating compliance with the OSHA PEL would be a valid conclusion. However, individual passive samples can show lower results than a paired active sampler so that a single result should be treated with caution.
Keywords: Formaldehyde; Active sampling; Passive sampling; 2,4-dinitrophenylhydrazine (DNPH); Pathology/Histology laboratory
INTRODUCTION
Formaldehyde is a ubiquitous airborne chemical in indoor environments, including workplaces and residential and public buildings. It is also widely used as a tissue fixative in histology and pathology laboratories for microscopic examination and as an embalming agent, such as for cadavers, organs, and human or animal tissues. Health symptoms from exposure to formaldehyde include irritation of the eyes and nose, sore throat, coughing, and breathing difficulties because it is highly reactive and is soluble in water. Furthermore, the National Toxicology Program (NTP) Report on Carcinogens (RoC) has reported that formaldehyde is known to be a human carcinogen and is associated with some types of nose and throat cancer.(1)
For measurement of airborne formaldehyde concentrations in indoor environments, various chemical compounds have been investigated for use as reactive adsorbents.(2–7) As results, samplers impregnated with 2,4-dinitrophenylhydrazine (2,4-DNPH) have been determined to be the most reliable agent and have been commercialized as both active (pumped) and passive (diffusive) types. Passive samplers have many advantages over active samplers. They are small and lightweight and do not require trained personnel to collect samples. They are also less expensive than active samplers because no sampling pumps and flow meters are needed, and can be used without interrupting workers’ ordinary tasks. On the other hand, passive devices have the drawback that the uptake rate is set by design, and cannot be modified for lesser or greater sampling rates.
Several studies (5, 8–10) conducted field evaluation to compare the performance of the passive samplers against the active samplers and reported good agreements (correlation coefficients > 0.90), while a poor performance of the passive sampler was reported by another study.(11) These previous studies tested either customized passive samplers,(5, 9, 10) and it is not clear whether these samplers have become commercially available, or a few commercial sampler types such as DuPont Pro-Tek® passive (diffusive) badge(8) and Radiello chemiadsorbing cartridge code 165.(11) In 2005, OSHA Method 1007(12) evaluated various commercially available passive samplers for measuring airborne formaldehyde, including Assay Technology ChemDisk Aldehyde Monitor 571 (ChemDisk-AL), SKC UMEx 100 Passive Sampler (UMEs 100), and Supelco DSD-DNPH Diffusive Sampling Device (DSD-DNPH). Although the OSHA Method 1007 clearly states that these passive samplers did not pass validation and thus active sampling method should be used for quantitative results when formalin solutions are dealt, occupational professionals often use passive sampling method for their convenience without being aware of specific details of the validation study.
The present study was performed to determine occupational exposures to formaldehyde of laboratory personnel in hospitals and to compare exposure measurements between active and passive sampling methods that both use DNPH as the derivatization agent. Although passive/active sampler comparisons have been performed previously, the results are not necessarily generalizable to the specific devices selected here. Field surveys were performed at two different U.S. locations, a pathology laboratory in West Virginia and a histology laboratory in Texas, by conducting three campaigns between 2014 and 2015.
METHODS
Workplace descriptions
A pathology laboratory prepares sample slides of various specimens from small biopsies to amputations and large tumors. The laboratory in this study included four fume hoods and a small office area without a door. Air flow was controlled by general ventilation with mechanical force. Air movement toward laboratory fume hoods was observed when tested with a smoke tube, and the average face velocity measurements of each of the fume hoods were > 70 ft/min (0.36 m/sec). The average temperature was 23 °C and average relative humidity was 49% during the first campaign. During the second campaign, the average temperature was 22 °C and average relative humidity was 52%.
The laboratory personnel included five full-time employees (three laboratory coordinators and two pathologist assistants [PAs]) and a few residents and doctors performing dissecting work. One laboratory coordinator and the two PAs voluntarily participated in our study. The coordinator filled each organ container with a 10% buffered formalin solution by placing it under a bulk container of formalin within a fume hood (Figure 1a) and opening a tab on the container, then covering it with a lid, and placing it on a cart outside the fume hood (Figure 1b). The formalin 10% solution consisted of 3% to 4% formaldehyde, <1% sodium phosphate monobasic 4.0 g/L, <1% sodium phosphate dibasic 6.5 g/L, 3% methyl alcohol, and deionized water (balance). The coordinator also cleaned the laboratory fume hoods with soap and water, replaced the formalin solution container as necessary and prepared tools for dissecting work. She spent the rest of her time making sample slides for doctors and entering data. No formalin solution was handled during these tasks. The two PAs occasionally also filled containers holding organs with formalin solution and instructed residents on organ dissection. The duration of their formaldehyde exposure was less than that of the laboratory coordinator. For the rest of the work shift, the PAs made class handouts, attended meetings, and entered data.
Figure 1.

Formalin buffered solution stored in a laboratory fume hood (a) and organ containers placed on a cart outside a fume hood (b)
A histology laboratory performs tasks similar to those of a pathology laboratory. The laboratory in this study had two fume hoods for dissecting work. The average temperature was 23 °C and average relative humidity was 34% during the sampling time period. There were three full-time employees, one autopsy technician and two histology laboratory technicians. Additionally, one or two residents performed dissections during the day shift. All three full-time employees participated in this study. After receiving organs, the autopsy technician filled the containers with a 20% buffered formalin solution, covered each with a lid, and placed them on a cart. The 20% formalin solution consisted of 7.4% (20 ml/l) formaldehyde <1% sodium phosphate monobasic (4.0 g/L), <1% sodium phosphate dibasic at 6.5 g/L, 3% methyl alcohol, and 87.6% deionized water. The technician also cleaned the fume hoods for the residents’ dissecting work. For the rest of the shift, the technician delivered the filled containers to other laboratories, brought organs to the histology laboratory, and printed and placed labels on small cassettes. The two laboratory technicians made sample slides by imbedding tissue samples in wax, placing the sliced samples on slides, putting the slides through automatic staining and cover-slipping machines, and then labelling and storing them for the doctors to examine. The amount and frequency of their formalin solution exposure was considerably less than that of the autopsy technician.
Sample monitoring
The pathology laboratory and the histology laboratory were in different locations. The 6 subjects voluntarily participated in this study. In each laboratory, personal and area exposure measurements were collected with pairs of active air samplers (Supelco LpDNPH tubes, Sigma-Aldrich Co. LLC, St. Louis, MO, USA) and passive badges (ChemDisk Aldehyde Monitor 571, Assay Technology, Inc., Livermore, CA, USA). Two types of sampling pumps, a pocket pump (SKC Inc.) and a Gilian LFS-113 (Sensidyne, Clearwater, Florida, USA), were used for active sampling. At the pathology laboratory, samples were collected in two campaigns: 15 personal and 10 area sample pairs (one active sampler and one passive badge) in one and 21 personal and 4 area sample pairs in the other (Figure 2). At the histology laboratory, 13 personal and 3 area sample pairs were collected. Table 1 shows the number of samples and the sampling duration per laboratory.
Figure 2.
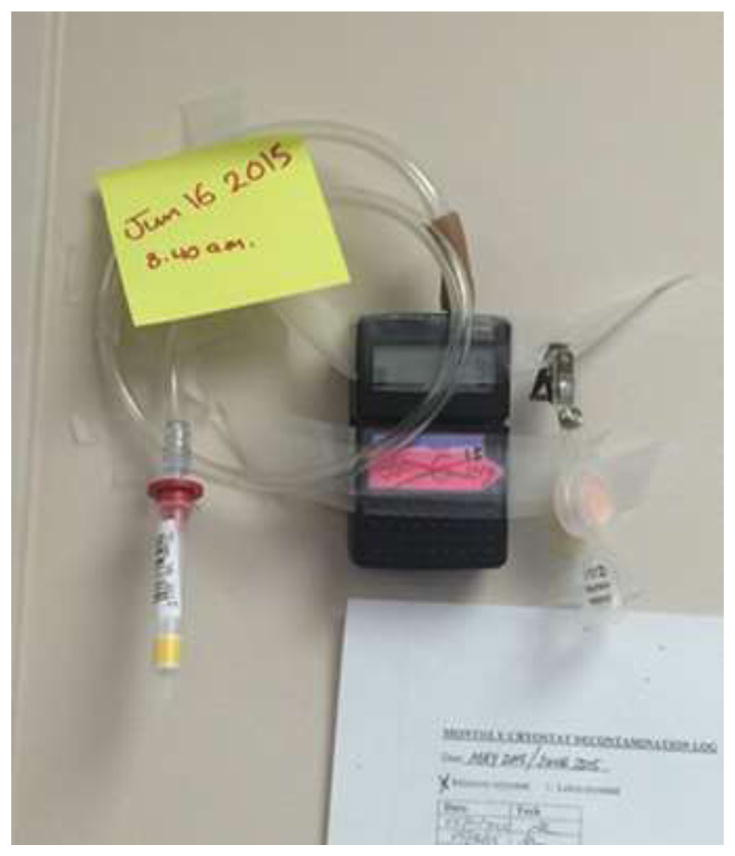
Sample pair for area sampling – Supelco active air sampler (Left) and ChemDisk passive badge (Right)
Table 1.
Summary of air sampling results
| Laboratory | Sampling method | N | Sampling time, min | Concentration: active, ppm | Concentration: passive, ppm | ||||
|---|---|---|---|---|---|---|---|---|---|
| Range | Median | CV(1) | Range | Median | CV(1) | ||||
| Pathology(2) | Personal | 36 | 117–485 | 0.01–0.37 | 0.05 | 1.05 | 0.02–0.56 | 0.07 | 1.19 |
| Area | 14 | 423–488 | 0.01–0.25 | 0.04 | 1.04 | 0.02–0.29 | 0.04 | 1.01 | |
| Combined(3) | 50 | 117–488 | 0.01–0.37 | 0.05 | 1.04 | 0.02–0.56 | 0.06 | 1.15 | |
| Histology | Personal | 13 | 225–497 | 0.01–0.21 | 0.03 | 1.29 | 0.01–2.16 | 0.04 | 2.35 |
| Area | 3 | 440–515 | 0.02–0.08 | 0.04 | 0.63 | 0.02–0.07 | 0.04 | 0.56 | |
| Combined(3) | 16 | 225–515 | 0.01–0.21 | 0.03 | 1.21 | 0.01–2.16 | 0.04 | 2.51 | |
| All sampling sites | Personal | 49 | 423–515 | 0.01–0.37 | 0.04 | 1.10 | 0.01–2.16 | 0.06 | 2.05 |
| Area | 17 | 117–497 | 0.01–0.25 | 0.04 | 1.06 | 0.02–0.29 | 0.04 | 1.04 | |
| Combined(3) | 66 | 117–515 | 0.01–0.37 | 0.04 | 1.08 | 0.01–2.16 | 0.05 | 2.01 | |
CV = coefficient of variation
Combined results of two campaigns in 2014 and 2015
Combined = Combined data of personal and area exposure measurements
Prior to sample collection, each pump was set at a sampling flow rate close to 150 ml/min with a DryCal® DC-Lite device (BIOS International Corporation, Butler, NJ, USA). After the sampling, the flow rate of each pump was checked again to ensure that the difference between pre- and post-sampling flow rates was within ±5%. For the first campaign at the pathology and histology laboratories, the location of passive and active samplers for personal sampling was randomized between left and right lapels. For the second campaign at the pathology laboratory, we intentionally placed an active sampler on the right side of each participant and a passive badge on the left side to determine an effect of sampler location. Samples were analyzed by the National Institute for Occupational Safety and Health (NIOSH) contract laboratory according to the NIOSH Manual of Analytical Methods (NMAM) 2016 method(13) for the active samples and the OSHA 1007 method(12) for the passive samples. The mass concentrations of passive badges were then calculated with the manufacturer’s updated uptake rate of 16.2 ml/min, which differs by 19% from the rate cited in the OSHA Method 1007. The sampling uptake rate of the ChemDisk-AL was 13.6 ml/min at normal temperature and pressure conditions, according to the OSHA Method 1007 written in 2005. Since then, the manufacturer has listed a new sampling uptake rate of 16.2 ml/min because of slight changes in tooling for making the sampling head (http://www.assaytech.com/sr571.htm, accessed on October 20, 2015, and personal communication with the manufacturer). In each sampling campaign, four or five field blank samples were collected. In this study, field blank sample results were not used to adjust the sample results because all field blank samples showed results lower than limit of detection (LOD) or limit of quantitation (LOQ). The LOD ranged from 0.03 μg to 0.09 μg for the active samples and from 0.01 μg to 0.04 μg for the passive samples. The LOQ ranged from 0.03 μg to 0.20 μg for the active samples and from 0.03 μg to 0.21 μg for the passive samples. None of the samples showed less than the LOQ.
Statistical analysis
All collected measurements were positively skewed and consistent with a log-normal distribution. Prior to performing data analyses, exposure measurements were transformed using the natural log to meet the assumptions of the statistical tests that the data be normally distributed. In addition, four outliers using Cook’s distance method were determined to present test results with and without outliers.
The concordance correlation coefficient (CCC) test, the product of precision and bias coefficients, was used to assess agreement between the active and passive sampling methods. The precision coefficient measures the distance of each observation from the best-fit line (i.e., variation) and is determined by calculating the Pearson correlation coefficient. The bias coefficient measures the distance of the best-fit line deviated from the unity line (i.e., shift from the 45 degree line).(14–17) That is, a test result is capable of providing a source of disagreement (i.e., whether it is more likely from precision or bias), unlike other agreement tests such as Bland-Altman test. A linear regression test was conducted using Proc Reg to test if the slope between the active and passive sampling methods is 1 (H0: slope [β] = 1). The statistical analyses were performed with SAS version 9.3 (SAS Institute, Cary, NC, USA). For the CCC, a validated SAS macro provided by Lin et al. (15) was used (macro download: http://www.uic.edu/~hedayat/, accessed on October 6, 2015). We applied a ±35% difference, selected from a field evaluation study to compare different sampler types by Lee et al.,(18) as acceptable between the active and passive methods for the CCC test. Thus, the least acceptable CCC was 0.878 for 35% acceptance (1–0.352).
RESULTS
Exposure assessment
Table 1 shows air sampling results for formaldehyde. Note that exposure measurements in Table 1 are not separated by job tasks because of insufficient sample sizes per task. For all combined data (personal and area for both laboratories), the median concentrations for both methods were similar: 0.04 ppm for the active method and 0.05 ppm for the passive method. The separation of personal and area exposures did not make a difference for the active method regardless of laboratory type. For the passive method, the median personal exposure (0.07 ppm) in the pathology laboratory was slightly higher than the median area exposure (0.04 ppm), whereas the histology laboratory showed the same median personal and area concentration of 0.04 ppm. Overall, the passive method showed higher variations than the active method, especially for personal exposure measurements (coefficient of variation [CV] =1.10 for the active and 2.05 for the passive methods).
The collected personal exposure measurements were converted to 8-hour TWA exposures in two ways, one assuming zero concentration and the other one assuming 0.01 ppm background level for the unsampled periods. The former is a typical method to estimate 8-hour TWA exposures in workplaces. The latter is adopted to consider background concentration due to emissions from furniture and personal products, indoor reactions, etc.; 0.01 ppm, the 50th percentile concentration measured in 100 office buildings, was used for calculation.(19) Regardless of 8-hour TWA calculation methods, all active 8-hour TWA personal exposures showed compliance with the OSHA permissible exposure level (PEL) of 0.75 ppm, but not with the lower NIOSH recommended exposure level (REL) of 0.016 ppm. A similar pattern was observed for the passive 8-hour TWA personal exposures except that one measurement (1.98 ppm) exceeding the OSHA PEL. Note the difference between the highest 8-hour TWA exposure (1.98 ppm) and the highest TWA concentration based on the sampling time (2.16 ppm) in Table 1. For both calculation methods, the proportion of exposure measurements exceeding the NIOSH REL was 78% for the active samples and 88% for the passive samples.
Comparison of the active and passive sampling methods
Figure 3 shows the comparison of log-transformed concentrations between the pairs of samples. Although the sample sizes per job task were insufficient for conclusions to be drawn, certain observations can be noted. The personal exposures of the autopsy technician in the histology laboratory and laboratory coordinator in the pathology laboratory deviated more from the 1:1 diagonal line compared to exposures of other employees. The autopsy technician and laboratory coordinator handled formaldehyde more often than others. The histology laboratory technicians who were dealing with formaldehyde solutions only a few times per shift had lower exposure concentrations than other employees. Regardless of laboratory locations, overall, the passive sampling method showed clearly higher concentrations than the active sampling method (~73% sample pairs exceeded the unit ratio) and the area samples showed better agreement than the personal samples.
Figure 3.

Log-transformed concentrations between the pairs of samples. The diagonal line represents a 1:1 relationship.
As shown in Figure 4, the range of concentration ratios between the pairs of samples is considerably wider for the personal exposures in the histology laboratory in comparison with others, although the median ratios (passive/active) for the personal exposures and area exposures in each laboratory are similar (all median ratios <1.33). The wider ratio range leads to a higher variation of personal exposures (CV = 1.40) than of area exposures (CV = 0.43) when the results of both laboratories are combined. The average concentration ratios were noticeably higher than the median ratios, indicating the occurrence of a few extreme concentration ratios.
Figure 4.

Box plots of exposure measurement ratios between the pairs of samples. Note that each box plot represents 10th, 25th, 50th (median), 75th, and 90th percentiles and the dashed line indicate mean. Tables:
Table 2 summarizes the statistical test results. The CCC results for all data and for data with outliers showed disagreement between the active and passive sampling methods (CCC values < 0.878) for the combined personal and area exposure measurements. Regardless of the presence of outliers, the pattern of precision (i.e., variation) coefficients is similar to the CCC, whereas no pattern was observed with the bias (i.e., shift from the unity line) coefficients. All the bias coefficients were higher than 0.91, indicating little deviation from the concordance line. These results suggest that the source of disagreement between the two methods is precision (variation) rather than bias. The regression analysis (Ho: Slope [β] = 1) indicated no statistically significant difference of concentrations between the active and passive samples for all data (β = 0.877 with adjusted R2 = 0.616), but a significant difference was detected for the data without outliers (p-values <0.05).
Table 2.
Statistical analyses to assess agreement between the two sampling methods
| Exposure measurements | N | Median of concentration ratios (Passive/Active) | Concordance correlation coefficient (CCC) | Linear regression | ||||
|---|---|---|---|---|---|---|---|---|
| CCC-total | CCC- Precision | CCC- Bias | Slope (β) | p- value for β=1 | ||||
| All data | Personal | 49 | 1.24 | 0.680 | 0.742 | 0.916 | 0.895 | 0.380 |
| Area | 17 | 1.14 | 0.940 | 0.970 | 0.969 | 0.839 | 0.010 | |
| Combined | 66 | 1.19 | 0.742 | 0.788 | 0.941 | 0.877 | 0.157 | |
| Data without outliers (Cook’s distance method) | Personal | 45 | 1.20 | 0.835 | 0.858 | 0.973 | 0.894 | 0.200 |
| Area | 17 | 1.14 | 0.940 | 0.970 | 0.969 | 0.839 | 0.010 | |
| Combined | 62 | 1.16 | 0.866 | 0.888 | 0.975 | 0.875 | 0.037 | |
N: Number of sample pairs
CCC-total = CCC-Precision multiplied by CCC-Bias
DISCUSSION
Exposure assessment
The personal median concentration was 0.04 ppm for the active method and 0.06 ppm for the passive method (Table 1). The area median concentration was 0.04 ppm for both sampling methods. During the full-shift, the main use of formaldehyde buffered solution occurred when the autopsy technician in the histology laboratory and the laboratory coordinator in the pathology laboratory filled the formaldehyde solution in containers of various sizes. This was done inside the laboratory fume hoods (Figure 1a). Similar median concentrations of the personal and area exposures indicate that the main sources of formaldehyde exposures might be from the background rather than from the filling task. The observation during the field survey suggests that the exposure to formaldehyde might be caused from evaporation of residues on the exterior surface of containers placed on a cart next to a laboratory fume hood and/or used gloves and paper towels in an open trash bin. In addition, other indoor sources from the lab environment (such as furniture and wooden products, paper, paints, disinfectants, etc.) might contribute to the background concentrations. US EPA collected formaldehyde concentration in 100 buildings as a part of the Building Assessment Survey and Evaluation (BASE) study and reported that the 5th, 50th, and 95th percentiles were 0.004 ppm, 0.012 ppm, and 0.026 ppm, respectively. (19)
None of the 8-hour TWA personal exposures exceeded the OSHA PEL (0.75 ppm) with both active and passive methods except for one passive measurement collected from the autopsy technician in the histology laboratory (1.98 ppm). When compared to the NIOSH REL (0.016 ppm), however, about 78% of data collected by the active method and 88% of data collected by the passive method exceeded that limit. The current NIOSH REL of 0.016 ppm was established in 1981 when NIOSH accepted evidence that formaldehyde is a “potential occupational carcinogen.” At that time an estimate of the extent of the cancer risk to workers exposed to various levels of formaldehyde had not yet been determined, so in the interim NIOSH recommended that, as a prudent public health measure, engineering controls and stringent work practices be employed to reduce occupational exposure to the lowest feasible limit (20) “Lowest feasible limit” is that which can be “feasibly achieved by engineering controls and measured by analytical techniques”.(21) Thus the REL reflects the limit of quantitation of the method in use at the time. Currently, NIOSH policy on carcinogen classification and target risk level for chemical hazards in the workplace is undergoing review.(22) If NIOSH RELs for carcinogens are based on a target risk level in future then the REL for formaldehyde could change.
Comparison of the active and passive sampling methods
Overall, the passive method produced higher exposure measurements than the active method; about 73% of sample pairs from passive sampling exceeded the concentration ratio of 1 (passive/active) shown in Figure 3. This finding is in fact unexpected. The OSHA Method 1007 described an effect of the reaction of formaldehyde to form stabilized compounds such as methoxymethanol and dimethyxymethane in the presence of methanol resulting lowered recoveries of passive badges. For example, the recovery was reduced to ~ 86% for the formalin solution containing 7–8% methanol and ~ 68–73% for the solution containing 10–15% methanol when tested with passive badges including ChemDisk-LA, UMEx 100, and DSD-DNPH, whereas the recovery of active samplers was average of 98%. In this study, the proportion of methanol was 3% for both 10% and 20% formalin solutions (according to the SDS information). It is possible that this smaller proportion of methanol might not be sufficient to affect the recovery.
Environmental factors such as temperature, relative humidity, and ozone can also impact the performance of passive samplers to measure formaldehyde exposure. For example, the passive transport of chemicals increases as temperature increases but may decrease in very low relative humidity conditions.(3, 23) The OSHA Method 1007(12) reported no adverse effect on recovery due to humidity in the range of 20% – 80%. For both laboratories in this study, the humidity ranged from 34% to 52% during the sampling days expecting no effect of formaldehyde exposure from humidity. Previous studies(12, 24–26) have shown underestimation of formaldehyde concentrations resulting from ozone exposure ranging from 42 ppb to 720 ppb. However, Mullen et al. (27) reported no significant effect of ozone interference in laboratory experiments at an average ozone concentration of 70 ppb. One interesting hypothesis was suggested by Mullen et al., (27), who stated that “when sampling passively, ozone reacts only with DNPH derivatives at the face of the cartridge, whereas active sampling pulls ozone deeper into the sampling medium.” If this hypothesis is correct, consistently higher concentrations on the passive samplers compared to the active samplers could be explained if there were high ozone levels in these environments. However, ozone measurements were not included in the present study.
For the combined data of all three campaigns, the variation of ratios (passive/active) was higher for the personal exposure measurements than for the area measurements. Especially, four extreme passive concentrations were observed from the autopsy technician and laboratory coordinator who handled the formaldehyde solution more often than others. This phenomenon could have several explanations. One reason might be droplets splashed on the inlet of the passive badges during filling activity, when the sample loading is small. For example, in this study, the collected mass per passive sampler ranged from 0.05 to 19 μg. One droplet of the 10% formaldehyde solution on the inlet of a passive sampler would cause a mass collected greater than one order of magnitude (rough calculation based on the assumption of 0.02 ml droplet size and 10% of droplet diffused to the badge) than the maximum mass collected during the sampling. Because such an occurrence is not ideal for sample collection, passive samplers should not be used for tasks involving sprays or drops of chemicals that could obstruct the sampling path.(28) The other reason might be an effect of turbulence generated by employee’s arm movement in the hood. This would entrain the formaldehyde into the passive sampler to a greater degree than predicted, whereas the turbulence would not impact the steady flow for the active sampling method. It is known that passive sampling might not be suitable for sample collection where high rates of air movement occurs.(29)
The position of the sampler with respect to the operator and the source (i.e., formalin solution) doesn’t seem to have caused any differences in this study; in the pathology laboratory, we randomized the sampler location during the first campaign and used a fixed location during the second (always on the right side for the active sampler and left side for the passive sampler). However, no pattern of exposure measurements was observed in relation to the sampler location.
The results of the statistical analyses were presented in two formats (Table 2), all data (total number of sample pairs [n] = 66) and data without outliers with use of the Cook’s distance method (n = 62). Although the median values of concentration ratios with and without outliers were lower than 1.20 for the combined data (personal and area), disagreement of the active and passive sampling methods from the CCC suggests that occupational professionals should be aware of the differences and be cautious when they select a sampling method.
For the present study, all calculations were done with the updated value of 16.2 ml/min and adjusted to the actual temperature and pressure condition. We also conducted back-calculations to estimate the sampling uptake rate assuming the active method to be a valid reference. The calculated sampling uptake rate was 19.5 ml/min (median value) with a CV of 1.4. However, this sampling rate based on 66 sets of paired samples might not be reliable due to the potentially considerable effect of droplets splashed on the inlet of the passive badges, where these have small sample loadings (e.g., median 2.95 μg for the active samplers and 0.37 μg for the passive badges in this study), or an effect of turbulence in front of a fume hood on uptake rate. The findings of this study suggest the need for further laboratory experiments under well-controlled conditions and validation of the laboratory results at other workplaces.
CONCLUSIONS
Exposure to airborne formaldehyde at a pathology laboratory and a histology laboratory were determined with three campaigns using pairs of active and passive samplers. All active and passive 8-hour TWA exposure measurements showed compliance with the OSHA PEL except for one passive measurement, but not with the lower NIOSH REL. Comparison of the concentration ratios with the two methods (passive/active) and statistical testing indicated that there is bias between the two methods. The small sample loading on the passive sampler and/or the uptake rate used may have contributed to this bias. A few extreme differences between the passive and active sampler results may have been the result of contamination of the badges. Care should be taken to ensure contamination does not happen in this or other environments as it will result in higher than expected concentrations. This study is limited to the information collected at two hospital laboratories. In order to determine the main source of the bias, it will be necessary to perform additional laboratory and field evaluations before considering the passive results as an accurate measurement of exposures. The expected underestimation of concentration by passive samplers in situations involving formalin solutions was not observed on this occasion and this might be due to lower methanol levels in the formalin solution or an overestimation of the sampling rate, or a combination of both. In the situations examined in this study the passive sampler generally produces higher results than the active sampler so that a body of results from passive samplers demonstrating compliance with the OSHA PEL would be a valid conclusion. However, individual passive samples can show lower results than a paired active sampler so that a single result should be treated with caution.
Acknowledgments
FUNDING: The authors are sincerely thankful to Dr. Dustin Poppendieck (National Institute of Standards and Technology) and Mr. Randy Boylstein (NIOSH/Respiratory Health Division) for reviewing this manuscript prior to journal submission. The authors also would like to offer special thanks to the employees who participated in our study. This project was funded internally by the National Institute for Occupational Safety and Health (Project CAN number: 939ZXEY).
Footnotes
DISCLAIMER: The findings and conclusions in this report are those of the authors and do not necessarily represent the official position of the Centers for Disease Control and Prevention.
References
- 1.National Toxicology Program. Report on Carcinogens. 13. Research Triangle Park, NC: U.S. Department of Health and Human Services, Public Health Service; 2014. [accessed on November 2015]. Available at http://ntp.niehs.nih.gov/pubhealth/roc/roc13/ [Google Scholar]
- 2.Geisling KL, Tashima MK, Girman JR, Miksch RR, Rappaport SM. A passive sampling device for determining the formaldehyde in indoor air. Environment International. 1982;8:153–158. [Google Scholar]
- 3.Otson R, Fellin P, Tran Q, Stoyanoff R. Examination of sampling methods for assessment of personal exposures to airborne aldehydes. Analyst. 1993;118:1253–1259. [Google Scholar]
- 4.Tsai S, Hee SSQ. A new passive sampler for aldehydes. American Industrial Hygiene association Journal. 1999;60:463–473. [Google Scholar]
- 5.Gillett RW, Kreibich H, Ayers GP. Measurement of indoor formaldehyde concentrations with a passive sampler. Environmental Science & Technology. 2000;34:2051–2056. [Google Scholar]
- 6.Zhang I, Zhang L, Fan Z, Iiacqua V. Development of the personal aldehydes and ketones sampler based upon DNSH derivatization on solid sorbent. Environmental Science and Technology. 2000;34:2601–2607. [Google Scholar]
- 7.Onishi M, Sekine Y, Sugihara K, Kitasaka K, Shimajiri H. A passive sampler for the determination of carbonyl compounds in indoor air employing o-(4-cyano-2-ethoxybenzyl)hydroxylamine as reactive adsorbent. Journal of Health Science. 2007;53(4):413–422. [Google Scholar]
- 8.Kring EV, Ansul GR, Basilio AN, McGibney PD, Stephens JS, O’dell HL. Sampling for formaldehyde in workplace and ambient air environments – Additional laboratory validation and field verification of a passive air monitoring device compared with conventional sampling methods. American Industrial Hygiene Association Journal. 1984;45(5):318–324. doi: 10.1080/15298668491399857. [DOI] [PubMed] [Google Scholar]
- 9.Levin JO, Lindahl R, Andersson K. A passive sampler for formaldehyde in air using 2,4-Dinitrophenylhydrazine-coated glass fiber filters. Environ Sci Technol. 1986;20(12):1273–1276. [Google Scholar]
- 10.Levin JO, Lindahl R, Andersson K. Monitoring of parts-per-billion levels of formaldehyde using a diffusive sampler. J of the Air & Waste Management Association. 1989;39:44–47. doi: 10.1080/08940630.1989.10466506. [DOI] [PubMed] [Google Scholar]
- 11.Chiappini L, Dagnelie R, Sassine M, Fuvel F, Fable S, Tranthi TH, George C. Multi-tool formaldehyde measurement in simulated and real atmospheres for indoor air survey and concentration change monitoring. Air Qual Atmos Health. 2011;4:211–220. doi: 10.1007/s11869-010-0102-7. [DOI] [PMC free article] [PubMed] [Google Scholar]
- 12.U.S. Department of Labor, Occupational Safety and Health Administration (OSHA) Method 1007. In: Hendricks W, editor. OSHA Sampling and analytical method. Salt Lake City, UT: [accessed on September 2015]. Available at http://www.osha.gov/dts/sltc/methods/index.html. [Google Scholar]
- 13.U.S. Department of Health and Human Services, Centers for Disease Control and Prevention, National Institute for Occupational Safety and Health (NIOSH) Method 2016. [accessed on September, 2015];NIOSH Manual of Analytical Methods (NMAM) Available at http://www.cdc.gov/niosh/nmam/
- 14.Lin LI. A concordance correlation coefficient to evaluate reproducibility. Biometrics. 1989;45:255–268. [PubMed] [Google Scholar]
- 15.Lin L, Hedayat AS, Sinha B, Yang M. Statistical methods in assessing agreement: Models, Issues, and Tools. Journal of the American Statistical Association. 2002;97:257–270. [Google Scholar]
- 16.Barnhart HX, Haber M, Song J. Overall concordance correlation coefficient for evaluating agreement among multiple observers. Biometrics. 2002;58:1020–1027. doi: 10.1111/j.0006-341x.2002.01020.x. [DOI] [PubMed] [Google Scholar]
- 17.Carrasco JL, Jover L. Estimating the generalized concordance correlation coefficient through variance components. Biometrics. 2003;59:849–858. doi: 10.1111/j.0006-341x.2003.00099.x. [DOI] [PubMed] [Google Scholar]
- 18.Lee T, Harper M, Slaven JE, Lee K, Rando RJ, Maples EH. Wood dust sampling: Field evaluation of personal samplers when large particles are present. Annals of Occupational Hygiene. 2011;55:180–191. doi: 10.1093/annhyg/meq075. [DOI] [PMC free article] [PubMed] [Google Scholar]
- 19.U.S. Environmental Protection Agency. Building assessment survey and evaluation (BASE) study [online database] Volatile organic compounds master list. Washington, DC: [accessed on February 2016]. Available at http://www.epa.gov/indoor-air-quality-iaq/summarized-data-building-assessment-survey-and-evaluation-study#Volatile_Organic_Compounds. [Google Scholar]
- 20.U.S. Department of Health, Education, & Welfare (DHEW) Current Intelligence Bulletin 34. Cincinnati, OH: U.S. Department of Health and Human Services, Centers for Disease Control and Prevention, National Institute for Occupational Safety and Health; 1981. Formaldehyde: evidence of carcinogenicity. DHEW (NIOSH) Publication No. 81–111. [Google Scholar]
- 21.U.S. Department of Health and Human Services (DHHS) NIOSH policy statements. Cincinnati, OH: U.S. DHHS, Centers for Disease Control and Prevention, National Institute for Occupational Safety and Health; 1995. [accessed on November 2015]. NIOSH recommended exposure limit policy, September 1995. Available at http://www.cdc.gov/niosh/topics/cancer/pdfs/1995_NIOSHRELpolicy.pdf. [Google Scholar]
- 22.U.S. Department of Health and Human Services (DHHS) Current Intelligence Bulletin. Cincinnati, OH: U.S. DHHS, Centers for Disease Control and Prevention, National Institute for Occupational Safety and Health; 2013. [accessed on November 2015]. Update of NIOSH carcinogen classification and target risk level policy for chemical hazards in the workplace (External Review DRAFT) Available at http://www.cdc.gov/niosh/docket/review/docket240A/pdf/EID-CIB-11052013.pdf. [Google Scholar]
- 23.Brown RH. Monitoring the ambient environment with diffusive samplers: theory and practical considerations. Journal of Environmental Monitoring. 2000;2:1–9. doi: 10.1039/a906404d. [DOI] [PubMed] [Google Scholar]
- 24.Sirju AP, Shepson PB. Laboratory and field investigation of the DNPH cartridge technique for the measurement of atmospheric carbonyl-compounds. Environmental Science & Technology. 1995;29:384–392. doi: 10.1021/es00002a014. [DOI] [PubMed] [Google Scholar]
- 25.Kleindienst TE, Corse EW, Blanchard FT. Evaluation of the performance of DNPH-coated silica gel and C18 cartridges in the measurement of formaldehyde in the presence and absence of ozone. Environ Sci Tehcnol. 1998;32:124–130. [Google Scholar]
- 26.Mabilia R, Scipioni C, Veglio F, Sciano MCT. Fractional factorial experiments using a test atmosphere to assess the accuracy and precision of a new passive sampler for the determination of formaldehyde in the atmosphere. Atmospheric Environment. 2010;44:3942–3951. [Google Scholar]
- 27.Mullen NA, Russell ML, Lunden MM, Singer BC. Investigation of formaldehyde and acetaldehyde sampling rate and ozone interference for passive deployment of water Sep-Pak exposure samplers. Lawrence Berkeley National Laboratory; Berkeley, CA, USA, LBNL-6386E: 2013. [Google Scholar]
- 28.Harper M. Instrument performance criteria – Diffusive sampling. Applied Occupational and Environmental Hygiene. 1998;13(11):759–763. [Google Scholar]
- 29.Harper M. Personal Monitoring: Passive. In: Reedijk J, editor. Elsevier Reference Module in Chemistry, Molecular Sciences and Chemical Engineering. Vol. 2013. Elsevier; Waltham MA: Sep 11, 2013. [accessed on February, 2016]. http://www.sciencedirect.com/science/article/pii/B9780124095472003991. [DOI] [Google Scholar]