Abstract
Femtosecond pulsed laser interferometry has important applications in measuring picometer-level displacements on sub-nanosecond time scales. In this paper, we experimentally examine its achievable displacement resolution, as well as the relationship between the laser’s optical spectrum and the interferometer’s effective wavelength. The resulting broadband displacement noise and noise floor of the pulsed laser Michelson interferometer are equivalent to that achieved with a stabilized continuous wave HeNe laser, where values of 1.01 nm RMS and 27.75 fm/√Hz have been demonstrated. It is also shown that a single effective wavelength can accurately describe the fringes of the pulsed laser interferometer but the effective wavelength value can only be determined from the optical spectrum under certain conditions. These results will be used for time-resolved displacement metrology with picosecond temporal resolution in the future.
1. Introduction
Femtosecond pulsed laser interferometry is capable of measuring periodic picometer-level displacements occurring at nano- to picosecond time scales using a stroboscopic measurement. For example, to visualize the propagation of acoustic waves in bulk material [1–3], a high-energy pump pulse is used to excite elastic waves induced by rapid thermal expansion and a low-energy probe pulse is used to measure the displacement through interferometry. By continuously varying the delay between the pump and probe, time-resolved displacements can be obtained. The femtosecond pulse acts as a strobe, effectively freezing the motion for a given phase between the pump and probe, and the measurement is averaged over many laser pulses to reduce the influence of noise. Similar examples of pulsed laser interferometry include time-resolved imaging of surface ablation [4,5], measurement of vibrations in micro- and nanomechanical structures [6,7], and nondestructive inspection of electronic packaging [8,9].
Within the research described above, the resolution and noise limits of pulsed laser interferometry have not been investigated in detail. Therefore, it’s unclear if the performance of pulsed laser interferometry can match that achieved with a frequency-stabilized continuous wave (CW) helium neon (HeNe) laser, which is the predominant choice for displacement metrology due to its accurate and stable wavelength. In this paper, we examine these performance metrics using a two-quadrature Michelson interferometer with a pulsed laser and compare the results with that obtained with a CW HeNe laser. Additionally, the relationship between the interferometer’s effective wavelength and the pulsed laser’s spectrum is investigated in order to determine the wavelength value that should be used in displacement measurements. Pulsed lasers can have a broad and complex optical spectrum unlike CW single wavelength lasers, resulting in ambiguity in the wavelength that describes the interference fringes. The presented results will support future studies on measuring high-frequency surface acoustic waves and micromechanical resonators with improved accuracy and bandwidth using pulsed laser interferometry.
The experimental layout of the Michelson interferometer and the characteristics of the pulsed laser (e.g., spectra, pulse duration) are described in Section 2. Pulsed laser interferometry is then demonstrated by measuring quasi-static displacements over several micrometers in Section 3. These results are then used to determine the effective wavelength of the pulsed laser interferometer and compare these results to the primary peak found in the optical spectrum of the laser for different spectral filtering conditions. The interferometer’s broadband displacement noise and displacement noise floor are then compared with the CW HeNe laser in Section 4, followed by conclusions.
2. Pulsed laser interferometer
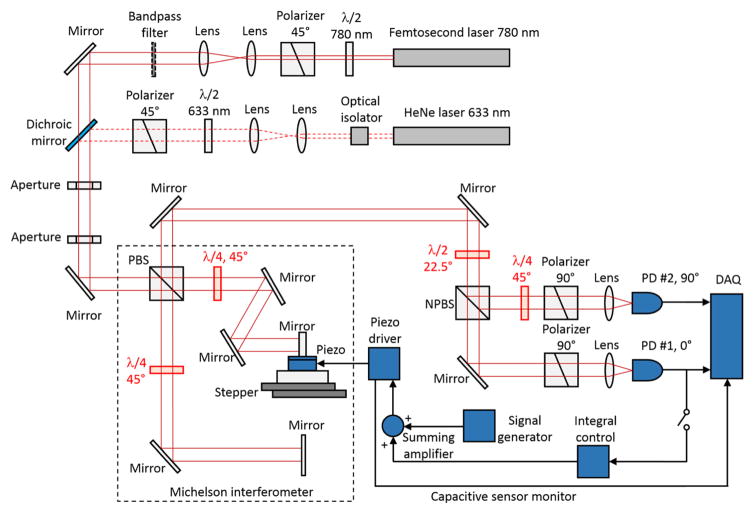
Figure 1 shows a schematic of the pulsed laser interferometer used in this work. It is a homodyne Michelson interferometer with two readout quadratures [10], 0° and 90°, where the two arms of the interferometer are indicated by a black dashed box. This type of two-beam interferometer is widely used for accurate displacement metrology and provides a relatively simple optical layout, making it an attractive choice for testing the performance of pulsed laser interferometry. Using the two quadrature signals ensures that there is no ambiguity in the displacement direction and minimizes the influence of laser intensity fluctuations on the measured displacement. While the displacements measured by pulsed laser interferometers are typically much smaller than a quarter wavelength, such as surface acoustic waves, multi-fringe excursions are used here to determine the effective wavelength of the interferometer when using the pulsed laser, as discussed in the next section.
Fig. 1.
Schematic of the homodyne Michelson interferometer. λ/2: half waveplate, λ/4: quarter waveplate, PBS: polarizing beam splitter, NPBS: non-polarizing beam splitter, PD: photodetector, DAQ: data acquisition card, Piezo: piezoelectric nanopositioner, Stepper: piezoelectric stepper stage. The bandpass filter is used to reduce the optical spectrum bandwidth of the pulsed laser for some measurements, as described in Section 3.
Two lasers are used in the experiments, a pulsed laser and a continuous-wave (CW) helium-neon (HeNe) laser. The pulsed laser is a mode-locked fiber laser with a nominal wavelength of 780 nm (Menlo Systems, custom C-Fiber 780 [11]). The repetition rate is feedback stabilized and was set to 50 MHz for all experiments. The CW HeNe laser (Research Electro-Optics, 32734) is frequency stabilized with a stability better than 1 MHz over one hour. This type of laser is widely used for displacement metrology and serves as a reference in the presented experiments. Both lasers are attenuated, converted to 45° polarization, and collimated before entering the interferometer. Two apertures are used to align the pulsed laser and CW laser beams so that they enter the interferometer at the same position and orientation.
Upon entering the interferometer, the laser is split into the measurement arm and reference arm by a broadband 50/50 polarizing beam splitter (PBS). The measurement arm mirror is mounted on a piezoelectric nanopositioner (Physik Instrumente, P-753.1CD), which sits on a piezoelectric stepper stage (Attocube, ECS3030). Controlled motion of this mirror is used to demonstrate the interferometer, where the nanopositioner is used for motion of a few micrometers with nanometer resolution and the stepper stage is used for larger motion. The interferometer was covered with an enclosure during experiments to reduce environmental noise due to acoustics, airflow, and temperature drift. The beams reflected by the two arms of the interferometer are recombined at the same beam splitter. Polarization optics are used to split the interference signal into two quadratures with one phase shifted by 90° from the other. The two quadratures are measured using photodetectors with 500 kHz bandwidth (Femto, OE-200-SI) and a data acquisition system. The three quarter-wave plates indicated in red in Fig. 1 are rotated with their fast axes at 45°, while the half-wave plate in red has its fast axis at 22.5° [10]. The wave plates are selected to match with the laser in use (pulsed laser, 780 nm; CW laser, 633 nm).
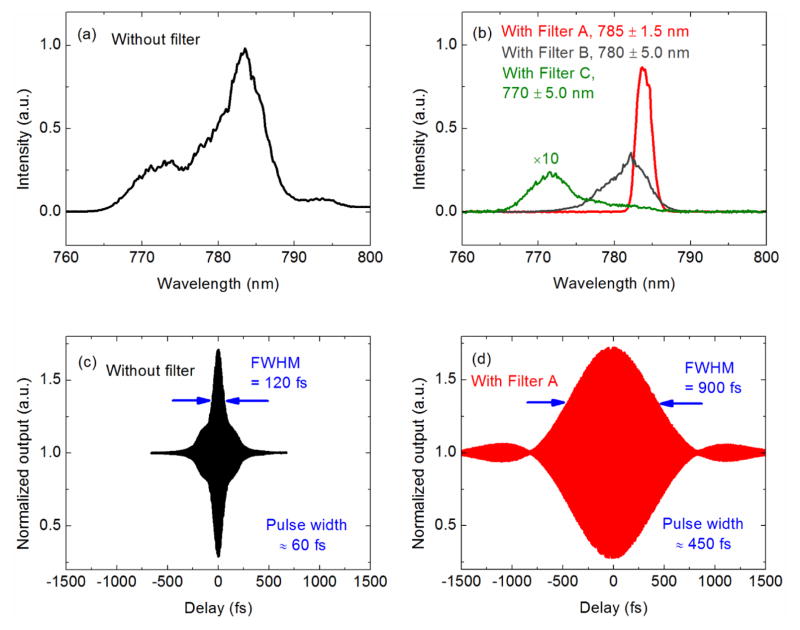
Figure 2(a) shows the optical spectrum of the pulsed laser measured with a Czerny-Turner spectrometer (Thorlabs, CCS175). The spectrum is more than 20 nm wide, has peak intensity near 783 nm, not the specified 780 nm, and is highly asymmetric. In order to observe how the interferometer resolution changes when the spectrum is modified, three narrow optical bandpass filters centered nominally at 785 ± 1.5 nm (Filter A), 780 ± 5.0 nm (Filter B), and 770 ± 5.0 nm (Filter C) are used in the following experiments. The optical spectrum when using Filter A, as shown in Fig. 2(b), has a near-Gaussian shape with reasonable symmetry while the optical spectra with Filters B and C are broader and asymmetric. The interferometer is also a field autocorrelator, making it straightforward to estimate the pulse duration without and with the filters. The piezoelectric stepper was scanned with 50 nm steps over a range larger than the anticipated pulse duration, resulting in the field autocorrelation data in Figs. 2(c) and 2(d). The amplitude of the optical fringes reaches the maximum when the two pulses travel the same distance in the two arms of the interferometer. The length of each arm is approximately 30 cm, much smaller than the spacing between two adjacent pulses (6 m), such that there is only one pulse in the interferometer at any given time. The pulse duration increases from 60 fs (width = 18 μm) to 450 fs (width = 135 μm) when adding Filter A, as expected due to the limit on the time-bandwidth product. The pulse durations are approximately 130 fs (width = 39 μm) and 100 fs (width = 30 μm) when using Filters B and C, respectively (data not shown). Therefore, all of the following results are taken with pulses in the femtosecond range. The stated pulse duration values are only approximate since the pulses are not Gaussian and the pulse chirp has not been characterized [12].
Fig. 2.
Spectra and field autocorrelation measurements of the pulsed laser. (a) Optical spectrum without filter, (b) optical spectra with Filter A (red), Filter B (gray), and Filter C (green, multiplied by 10 to improve visibility) while the laser power was kept constant, (c) field autocorrelation without filter, and (d) field autocorrelation with Filter A.
3. Quasi-static displacement measurements
In this section, the pulsed laser interferometer is demonstrated by measuring the displacement of the measurement arm mirror. In addition to demonstrating the functionality of the interferometer, this quasi-static measurement over multiple fringes is used to determine the effective wavelength for the pulsed laser. After adjusting the interferometer so that the two arms have equal length, the piezoelectric nanopositioner was controlled to track a 1 Hz triangular wave trajectory with an amplitude of approximately 5 μm. The position of the nanopositioner was measured with an integrated capacitive sensor and the two photodetector signals, where all signals were recorded with a computer controlled data acquisition card (DAQ).
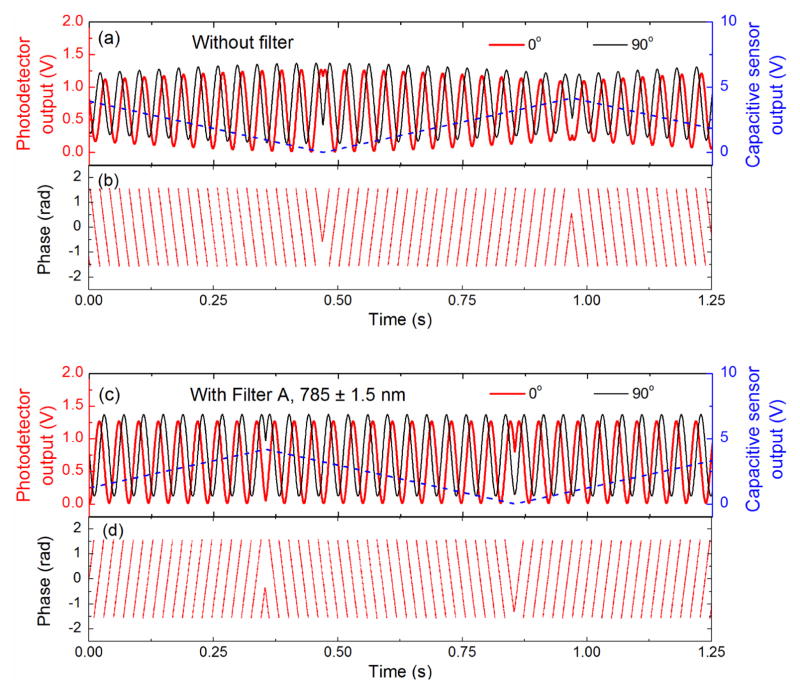
Figure 3(a) shows the measured raw signals from the two photodetectors without the optical filter, along with the output from the capacitive sensor. Note that the amplitude of the fringes is a function of the percentage of overlap between the two pulses, as indicated by the changing amplitude over the displacement range. When Filter A was added to the optical path, a smaller change in the fringe amplitude was observed for the same displacement due to the significant increase in the pulse duration, as shown in Fig. 3(c) (data with Filters B and C not shown, but are similar). In all cases, the fringes have excellent visibility and are clearly sinusoidal. The average power of the pulsed laser entering the interferometer was adjusted so that the peak amplitude of the fringes was the same without and with the filters. The laser power entering the interferometer was measured to be approximately 530 μW using a thermal power sensor for all cases.
Fig. 3.
Interference signals and resulting phase data. (a) Photodetector outputs without filter, (b) calculated phase shift without filter, (c) photodetector outputs with Filter A, and (d) phase shift with Filter A. Capacitive sensor signal provided for reference.
The resulting phase shift observed by the interferometer was calculated from the raw fringe data using a well-established data processing procedure for the traditional CW laser interferometer with two-quadrature detection [13]. In short, the voltage outputs from the two photodetectors were normalized to the same peak amplitude and the DC offset was removed. The phase was obtained by dividing the processed signal from PD #2 (90° signal) by the processed signal from PD #1 (0° signal), and then taking the arctangent of the quotient. Because of the division, the changing amplitude of the fringes is eliminated. Figures 3(b) and 3(d) show the wrapped phase without and with Filter A, respectively. Changes in the slope of the phase indicate a reversal in the direction of the mirror.
In order to obtain the displacement of the nanopositioner, the phase must be unwrapped and multiplied by λ/(4π), where λ is the optical wavelength. For a single frequency CW laser interferometer, the value of λ is well defined. However, since the spectrum of a femtosecond laser is broad and complex as shown in Figs. 2(a) and 2(b), it is not obvious whether a single-wavelength model holds and if it does, what is the effective wavelength. In previous work on pulsed laser interferometry, it has been assumed that a center wavelength in the optical spectrum is well defined (e.g., see [1]). If the optical spectrum were truly Gaussian and there was no chirp in the pulse, the wavelength at peak amplitude in the spectrum would in fact be the effective wavelength for the interferometer. However, as shown above, the optical spectrum is not Gaussian, even when filtered, and likely has some degree of chirp. Looking at the data in Fig. 3, it is clear that the displacement can be recovered by multiplying the phase by a single wavelength since the fringe data is sinusoidal. Measurement of this effective wavelength is achieved by using the HeNe laser as a reference, where the results of the pulsed laser interferometer are compared to the CW interferometer.
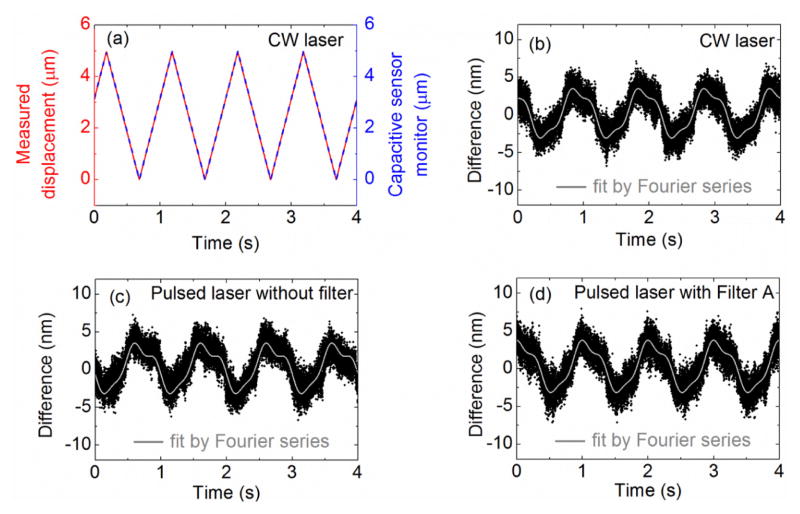
First, the CW interferometer is used to calibrate the capacitive sensor, thereby providing a precise relationship between the output voltage of the capacitive sensor and the displacement of the nanopositioner. The wavelength of the HeNe laser is known to be 632.81 nm for the temperature, pressure, and humidity during the experiments [14]. The aforementioned data processing procedure was used to calculate the nanopositioner displacement from the CW interferometry data, as shown in Fig. 4(a). The gain of the capacitive sensor was determined by finding the value that minimizes the root mean square (RMS) of the difference between the CW interferometer displacement data and the capacitive sensor voltage data. This resulted in a gain of 8.4 × 10⁵ V/m and an RMS difference between the interferometer and sensor of 2.73 nm (≈ 0.05%), as shown in Fig. 4(b).
Fig. 4.
Comparison between the measured displacement from the Michelson interferometer and the displacement measured with the capacitive sensor integrated in the nanopositioner. (a) Measured displacement from the CW interferometer and capacitive sensor, (b) difference between the CW interferometer and capacitive sensor, (c) difference between the pulsed laser interferometer without filter and capacitive sensor, and (d) difference between the pulsed laser interferometer with Filter A and capacitive sensor. A three-term Fourier series was fit to each difference signal to show the consistency of the difference signal across all measurements.
The effective wavelength of the pulsed laser is then determined by minimizing the RMS difference between the displacement found with the interferometer (i.e., unwrapped phase data multiplied by λ/(4π)) and the calibrated capacitive sensor signal, where λ is the fit parameter. The difference between the displacement measurement from pulsed laser interferometer after fitting the effective wavelength and the capacitive sensor are shown in Figs. 4(c) and 4(d) for two cases, without and with Filter A, respectively. Results for Filters B and C are comparable but not shown for brevity. The displacement differences presented in Figs. 4(b)–4(d) are similar in amplitude and shape, indicating that using a single effective wavelength for processing the pulsed laser interferometry data provides displacement precision similar to the CW HeNe laser. The periodic signals seen in Figs. 4(b)–4(d) are likely due to nonlinearities in the capacitive sensor or nanopositioner since they are consistent across all measurements and the period is the same as the triangular wave trajectory.
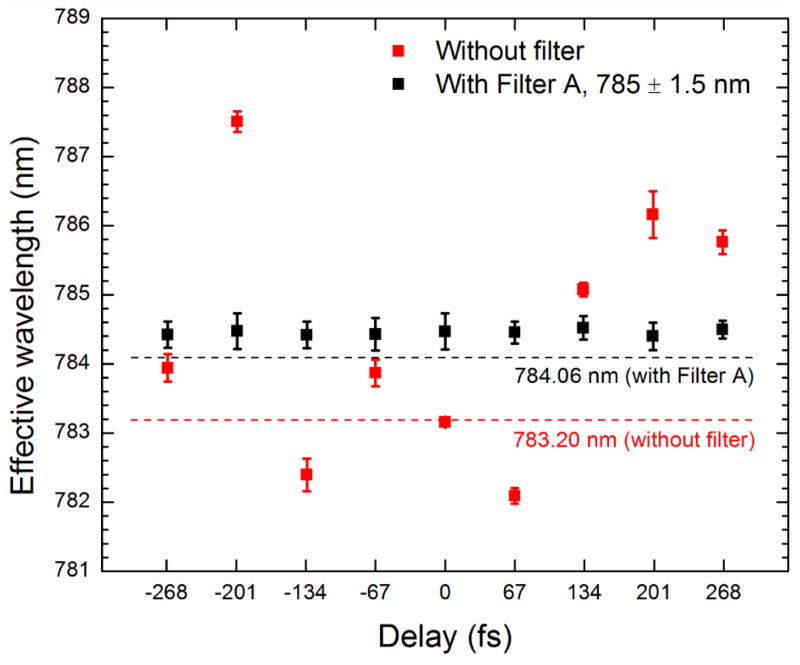
The effective wavelengths resulting from the fit for each case are shown in Table 1. As expected, the effective wavelength shifts with the bandpass filter center wavelength. In order to compare the measured effective wavelength with the optical spectrum, a parabola was fit to the primary peak in the optical spectrum (data truncated 40% from peak), yielding a center wavelength, as shown in Table 1. The difference between the measured effective wavelength and the center wavelength from the optical spectrum is well within the spectrometer’s accuracy (< 0.6 nm) for all filtering conditions. The above wavelength data was obtained with the two pulses perfectly overlapping. The measurements were also performed for varying levels of pulse overlap, determined by the pulse delay, as shown in Fig. 5. It was found that the variation in the measured effective wavelength without a filter can be as large as 4.3 nm (0.55%) compared to the value found when the pulse delay is zero. The variation in the effective wavelength is significantly reduced (i.e., within the standard deviation of all measurements) when Filter A is used. It is likely that the wavelength variations found in the unfiltered case are due to the short pulse duration, which results in interference between the leading and trailing edges of the two pulses, respectively, for sufficiently long delay time. This partial overlap will shift the wavelength compared to that found at zero delay time due to pulse chirp and asymmetry.
Table 1.
Measured effective wavelength and center wavelength from optical spectrum for all filtering conditions. The effective wavelength results are from five independent measurements. (unit: nm)
| Filtering condition | Effective wavelength | Center wavelength by parabola fit of spectrum |
|---|---|---|
| Without filter | 783.16 ± 0.04 | 783.20 |
| Filter A (785 ± 1.5 nm) | 784.47 ± 0.26 | 784.06 |
| Filter B (780 ± 5.0 nm) | 781.72 ± 0.17 | 781.83 |
| Filter C (770 ± 5.0 nm) | 772.21 ± 0.21 | 771.72 |
Fig. 5.
Effective wavelength measured when the two interfering pulses partially overlap with each other for the conditions without filter (red) and with Filter A (black). The delay between the two pulses was achieved by moving the piezoelectric stepper in 10 μm increments (≈67 fs in delay time). The error bars are the standard deviation of five independent measurements for each delay time. The center wavelengths from the parabola fit of the spectra without and with Filter A are illustrated by red and black dashed lines, respectively.
These results show that the primary peak in the optical spectrum may provide a good measure of the effective wavelength in some cases but that it is better to measure it directly using the interferometer and a length reference, such as the CW HeNe laser, as described above. This is particularly true for short pulses with high asymmetry and chirp. Most of the previous research on pulsed laser interferometry uses the specified laser wavelength or the wavelength at peak intensity in the spectrum rather than a direct measurement of the effective wavelength, resulting in significant error within the context of precision interferometry. For example, when considering the case without the filter, the displacement error would be 0.40% if the specified wavelength (780 nm) was used and as high as 0.55% when the two pulses do not perfectly overlap.
4. Displacement noise measurements
Displacement noise is the most important point of comparison between the CW and pulsed laser interferometers since it determines the smallest displacements that can be measured. Both the broadband displacement noise and displacement noise floor have been measured to fully characterize interferometer performance. First, the interferometer gain was found, which is defined as the proportional constant between the displacement measured by the interferometer and the resulting voltage signal from the photodetector at the point of highest slope on the fringe. This parameter can be extracted from the fringe data discussed in the previous section and is shown in Table 2. The broadband displacement noise was found by calculating the RMS of the residue resulting from a linear fit of the measured displacement between mirror reversals (see Table 2). The broadband displacement noise for the pulsed laser interferometer was found to be within 5.8% of that for the CW interferometer for all filtering conditions, showing that the two interferometers are comparable in this respect.
Table 2.
Interferometer gain, broadband displacement noise, and the displacement noise floor for CW laser and pulsed laser interferometry. Measurement bandwidth for RMS values was 2.5 kHz.
| Filtering condition | Interferometer gain (V/m) | Broadband displacement noise (nm RMS) | Displacement noise floor (fm/√Hz) |
|---|---|---|---|
| CW HeNe laser | 1.25 × 10⁷ | 1.04 | 21.73 |
| Pulsed laser without filter | 1.01 × 10⁷ | 1.01 | 27.75 |
| Pulsed laser with Filter A (785 ± 1.5 nm) | 1.01 × 10⁷ | 1.06 | 28.53 |
| Pulsed laser with Filter B (780 ± 5.0 nm) | 1.00 × 10⁷ | 1.10 | 30.64 |
| Pulsed laser with Filter C (770 ± 5.0 nm) | 1.03 × 10⁷ | 1.02 | 28.75 |
Even more important than the broadband displacement noise is the displacement noise floor. This is because many pulsed laser interferometry measurements use amplitude modulation of the pulse train before it reaches the photodetector for a narrow-band measurement with a lock-in amplifier [2,6]. By introducing modulation and the lock-in technique, the displacement resolution can improve from nanometers to picometers and below by making use of the noise floor at high frequency. In order to perform the noise floor measurement, the signal generator and the servo controller for the nanopositioner are disabled. An external integral controller (SRS, SIM960) is used to lock the 0° quadrature to the point of highest slope on the fringe by controlling the nanopositioner motion (see Fig. 1) [15]. The bandwidth of the controller is only a few hundred hertz so the detection noise above this frequency range is unaffected by the controller. The noise spectral density was measured for the HeNe and pulsed lasers with a spectrum analyzer (SRS, SR785). For all measurements presented in this section, the laser power was adjusted so that the DC output voltage of the detector was the same for all filter conditions.
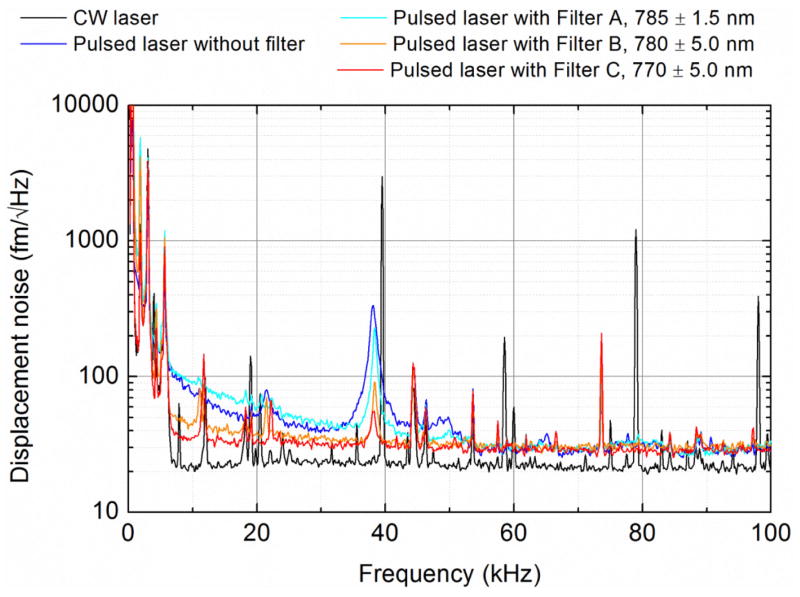
The displacement spectral density was obtained by dividing the noise spectral density from the photodetector by the interferometer gain, resulting in the data in Fig. 6. The displacement noise floor was measured at the upper end of the frequency range of the displacement spectral density, yielding the values shown in Table 2. The ratio of the noise floor of the pulsed laser interferometer to that of the CW laser (27.75/21.73 = 1.28) is very close to the ratio of their wavelengths (783.16/632.81 = 1.24). Shot noise and detector noise set the fundamental limit on the noise floor [16], and both are linearly proportional to λ. Therefore, the difference between the noise floors for the two interferometers can be explained by the difference in wavelength, indicating that the performance of the pulsed laser interferometer is essentially equivalent to that found with the CW laser. We note that the noise spectral densities for the HeNe and pulsed lasers were also measured before entering the interferometer. While the spectra in this case were simpler due to the absence of resonances from the instrument’s optomechanics, they still had a similar noise floor.
Fig. 6.
Displacement spectral density for the CW laser interferometer and pulsed laser interferometer for all filtering conditions.
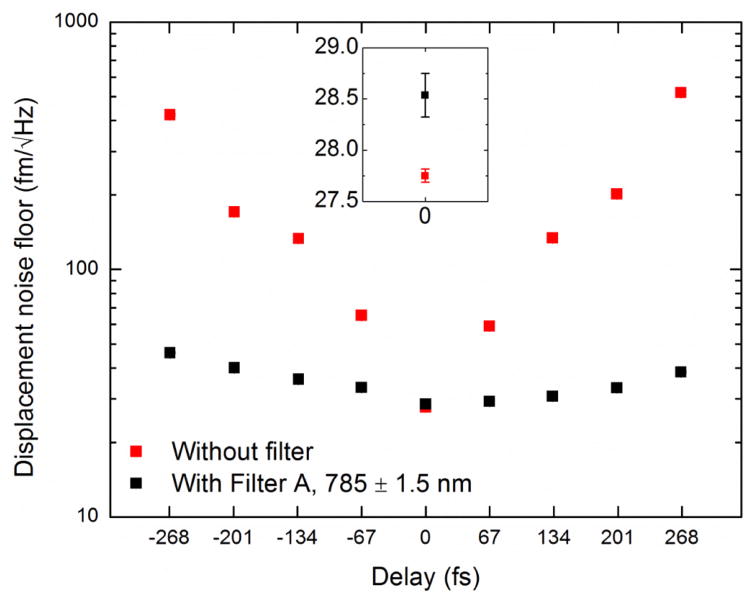
The increase in the noise floor due to filtering is small so there seems to be little advantage in not using a bandpass filter. As described in the previous section, filtering provides a more consistent effective wavelength when the delay between the interfering pulses varies. The effect of pulse delay on the noise floor was also investigated, as shown in Fig. 7. It was found that the noise floor increased dramatically as the pulse delay increased for the unfiltered pulsed laser. This is due to the drop in laser intensity on the photodetector when the pulses are not perfectly overlapping. The same trend can be seen for the filtered pulsed laser, although with a much more gradual increase in the noise floor since the pulse is wider. This effect can be countered by increasing the laser power going into the interferometer as the power on the detector decreases due to delay between pulses. However, this will increase the power on the mirror that is being measured, resulting in an increase in heating of the sample under test, which is undesirable. Due to these factors, the pulsed laser interferometer should be adjusted to have zero delay between the interfering pulses in order to achieve the best performance.
Fig. 7.
Displacement noise floor of the pulsed laser interferometer without filtering and with Filter A. Measurements were repeated 5 times for each delay time (standard deviations are smaller than the data marker). Inset is a magnified view of the displacement noise floor values obtained when the two interfering pulses are perfectly overlapping with each other showing typical standard deviations.
The displacement noise results show that the pulsed laser interferometer achieves very similar displacement resolution for periodic measurements (e.g., waves and vibrations) compared to that for a CW HeNe laser. This may not seem particularly useful when the displacements occur within the bandwidth of the photodetector, in this case 500 kHz. However, the pulsed laser interferometer can measure displacements at frequencies much higher than the photodetector bandwidth through synchronized stroboscopic measurements, where frequencies of 10 GHz and above are possible [1,3,7]. By synchronizing the repetition rate of the laser with the excitation signal applied to the system under test, complex periodic motion occurring at frequencies well beyond the photodetector bandwidth can be measured. In order to measure higher frequencies with the CW interferometer, a photodetector with higher bandwidth is required, necessitating faster photodiodes and amplifiers. This inevitably results in higher detector noise, electromagnetic interference, and insertion loss, thereby degrading the resolution of the interferometer. For example, we have used the same method presented above to characterize the CW laser interferometer using a high-speed photodetector with 2 GHz bandwidth (Thorlabs, DET025A/M). It was found that the displacement noise floor was 0.6 pm/√Hz between 1 GHz and 2 GHz. Therefore, the pulsed laser interferometer outperforms the CW interferometer by a factor of approximately 20 in this case.
5. Conclusion
In this paper, the performance of pulsed laser interferometry was examined experimentally in terms of broadband displacement noise, displacement noise floor, and the effective wavelength of the interferometer. The broadband displacement noise (≈ 1.01 nm RMS for 2.5 kHz bandwidth) and the displacement noise floor (≈ 27.75 fm/√Hz) are nearly equivalent to those found using a frequency stabilized CW laser when accounting for differences in wavelength. Using a CW interferometer as a reference, it was found that a single effective wavelength accurately describes the fringes of the pulsed laser interferometer, even when the optical spectrum of the laser is asymmetric and has two peaks. Additionally, the difference between the center wavelength found from a parabola fit of the optical spectrum and the measured effective wavelength was shown to be within the spectrometer accuracy when the pulses are perfectly overlapping. Alternatively, variations in the effective wavelength and an increase in the noise floor were observed when there is a delay between the interfering pulses. Optimal performance of the interferometer was achieved when the interfering pulses were perfectly overlapping (i.e., no delay between the pulses) and bandpass filtering was found to result in a more consistent effective wavelength. The presented results will support efforts on measuring surface acoustic waves and micromechanical devices at gigahertz frequencies using synchronized stroboscopic techniques with the pulsed laser interferometer, which will be demonstrated in future work.
Acknowledgments
Funding
National Institute of Standards and Technology (NIST), Department of Commerce, USA (70NANB14H320).
The authors thank John Kramar, John Lawall, and Thomas LeBrun from the National Institute of Standards and Technology (NIST) for their helpful discussions on this paper.
Footnotes
OCIS codes: (120.3180) Interferometry; (140.3538) Lasers, pulsed; (170.6920) Time-resolved imaging.
References and links
- 1.Tachizaki T, Muroya T, Matsuda O, Sugawara Y, Hurley DH, Wright OB. Scanning ultrafast Sagnac interferometry for imaging two-dimensional surface wave propagation. Rev Sci Instrum. 2006;77(4):043713. [Google Scholar]
- 2.Fujikura T, Matsuda O, Profunser DM, Wright OB, Masson J, Ballandras S. Real-time imaging of acoustic waves on a bulk acoustic resonator. Appl Phys Lett. 2008;93(26):261101. [Google Scholar]
- 3.Matsuda O, Tomoda M, Tachizaki T, Koiwa S, Ono A, Aoki K, Beardsley RP, Wright OB. Ultrafast ellipsometric interferometry for direct detection of coherent phonon strain pulse profiles. J Opt Soc Am B. 2013;30(7):1911. [Google Scholar]
- 4.Furutani H, Fukumura H, Masuhara H. Nanosecond time-resolved interferometric study on morphological dynamics of doped poly (methyl methacrylate) film upon laser ablation. Appl Phys Lett. 1994;65(26):3413–3415. [Google Scholar]
- 5.Oliveira V, Vilar R, Serra R, Oliveira JC, Polushkin NI, Conde O. Sub-micron structuring of silicon using femtosecond laser interferometry. Opt Laser Technol. 2013;54:428–431. [Google Scholar]
- 6.Liu N, Giesen F, Belov M, Losby J, Moroz J, Fraser AE, McKinnon G, Clement TJ, Sauer V, Hiebert WK, Freeman MR. Time-domain control of ultrahigh-frequency nanomechanical systems. Nat Nanotechnol. 2008;3(12):715–719. doi: 10.1038/nnano.2008.319. [DOI] [PubMed] [Google Scholar]
- 7.Bruchhausen A, Gebs R, Hudert F, Issenmann D, Klatt G, Bartels A, Schecker O, Waitz R, Erbe A, Scheer E, Huntzinger JR, Mlayah A, Dekorsy T. Subharmonic resonant optical excitation of confined acoustic modes in a free-standing semiconductor membrane at GHz frequencies with a high-repetition-rate femtosecond laser. Phys Rev Lett. 2011;106(7):077401. doi: 10.1103/PhysRevLett.106.077401. [DOI] [PubMed] [Google Scholar]
- 8.Gong J, Ume IC. Nondestructive evaluation of poor-wetted lead-free solder bumps in ball grid array packages using laser ultrasound and interferometric technique. IEEE Trans Compon Packaging Manuf Technol. 2013;3(8):1301–1309. [Google Scholar]
- 9.Ume C, Gong J, Ahmad R, Valdes A. Laser ultrasonic inspection of solder bumps in flip-chip packages using virtual chip package as reference. IEEE Trans Compon Packaging Manuf Technol. 2011;1(11):1739–1746. [Google Scholar]
- 10.Greco V, Molesini G, Quercioli F. Accurate polarization interferometer. Rev Sci Instrum. 1995;66(7):3729–3734. [Google Scholar]
- 11.Certain commercial equipment, instruments, or materials are identified in this article in order to specify the experimental procedure adequately. Such identification is not intended to imply recommendation or endorsement by the National Institute of Standards and Technology, nor is it intended to imply that the materials or equipment identified are necessarily the best available for the purpose.
- 12.Weiner AM. Ultrafast optics. Wiley; 2009. [Google Scholar]
- 13.Gregorčič P, Pozar T, Mozina J. Quadrature phase-shift error analysis using a homodyne laser interferometer. Opt Express. 2009;17(18):16322–16331. doi: 10.1364/OE.17.016322. [DOI] [PubMed] [Google Scholar]
- 14.Stone JA, Decker JE, Gill P, Juncar P, Lewis A, Rovera GD, Viliesid M. Advice from the CCL on the use of unstabilized lasers as standards of wavelength: the helium-neon laser at 633 nm. Metrologia. 2009;46(1):11–18. [Google Scholar]
- 15.Knuuttila JV, Tikka PT, Salomaa MM. Scanning Michelson interferometer for imaging surface acoustic wave fields. Opt Lett. 2000;25(9):613–615. doi: 10.1364/ol.25.000613. [DOI] [PubMed] [Google Scholar]
- 16.Lawall J, Kessler E. Michelson interferometry with 10 pm accuracy. Rev Sci Instrum. 2000;71(7):2669–2676. [Google Scholar]


