Correction to: British Journal of Cancer (2014) 110, 1488–1496; doi:10.1038/bjc.2014.50
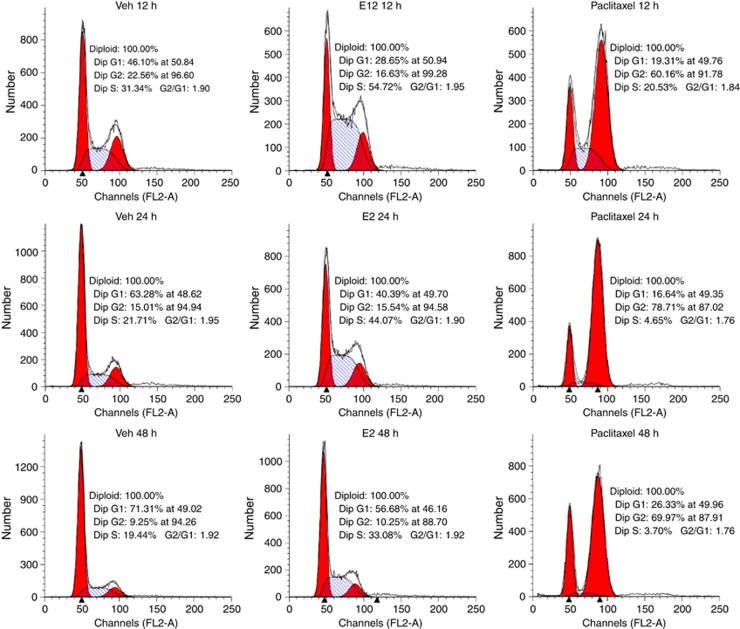
One of the authors of the above paper had identified that Figure 7 was not reproduced correctly from their original flow data. The correct figure has been reproduced below.
Figure 7.
Cell cycle analysis of the effects of E2 and paclitaxel in the MCF7:5C cells. Representative cell cycle profiles of MCF7:5C cells treated with either 0.1% ethanol (Veh), E2 (1 nM) or paclitaxel (1μM) for 12, 24 and 48 h. FL2-A represents the intensity of PI, and the y-axis represents the cell number.
The authors and publishers apologise for this mistake.


