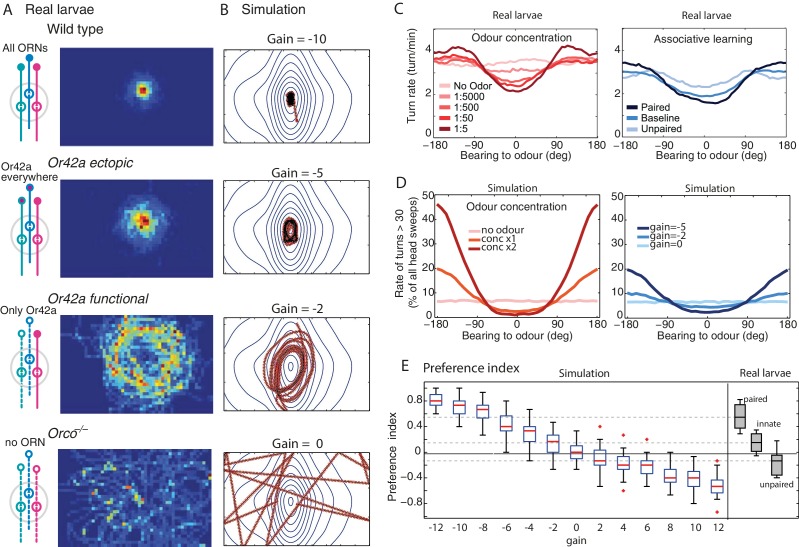
Figure 5. Modulation of the chemotactic response.
(A) Time occupancy spatial maps for genotypes with re-engineered peripheral olfactory circuits tested in the near-source paradigm (30 mM odour source): wild type (N = 42 flies), Or42a ectopically expressed in the 21 intact ORNs (all neuron pairs active, N = 38), Or42a single-functional ORN (one pair of neuron active, N = 37), and Orco null (anosmic flies, N = 55) adapted from Gomez-Marin et al. (2011). (B) The simulated agent can capture the patterns observed in larvae by changing , suggesting that OSN activity acts collectively to increase the turning modulation signal. (C) Effect of odour concentration and appetitive conditioning on turn-rate (larva data from Schleyer et al., 2015b). (D) In our simulation (shows mean std. dev.), turning events were categorised as large turns if > 30 degrees and not followed by another large turn. Changes in stimulus intensity were obtained by multiplying the gradient by a factor 0, 1 or 2. Learning was modelled as a change in gain (, or ). The same qualitative changes in turn-angle and turn-rate relative to odour bearing are observed. (E) Preference index () for 30 simulated larvae after 3 min, for different gains (larva data from Schleyer et al., 2015b).

