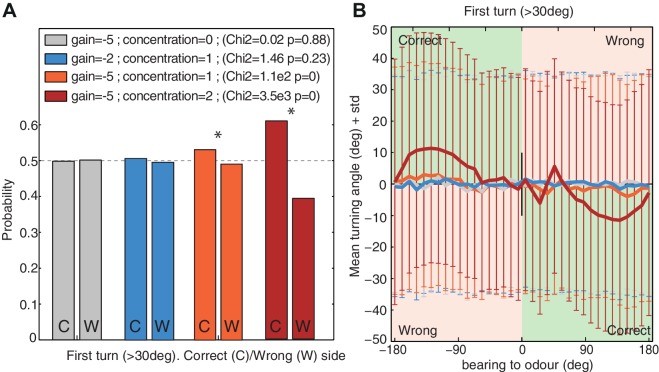
Figure 7. First turn bias towards the correct side.
The model's first turns were categorised as large turns (>30 degrees) that were not preceded by a large turn in the previous timestep. (A) Probability of turning to the correct side (i.e. towards the odour; 1st column ‘C’) and wrong side (second column ‘W’). Higher signals (i.e. increased concentration or stronger gain ) increase the bias. (B) Turning direction (mean ± standard deviation) given the bearing to odour. Green and red zones indicate turns towards (i.e. correct side) or away (i.e. wrong side) from the odour respectively. Noise . Time . larvae ( for each group).

