

Abstract
MALDI imaging mass spectrometry is a powerful analytical tool enabling the visualization of biomolecules in tissue. However, there are unique challenges associated with protein imaging experiments including the need for higher spatial resolution capabilities, improved image acquisition rates, and better molecular specificity. Here we demonstrate the capabilities of ultra-high speed MALDI-TOF and high mass resolution MALDI FTICR IMS platforms as they relate to these challenges. High spatial resolution MALDI-TOF protein images of rat brain tissue and cystic fibrosis lung tissue were acquired at image acquisition rates >25 pixels/s. Structures as small as 50 μm were spatially resolved and proteins associated with host immune response were observed in cystic fibrosis lung tissue. Ultra-high speed MALDI-TOF enables unique applications including megapixel molecular imaging as demonstrated for lipid analysis of cystic fibrosis lung tissue. Additionally, imaging experiments using MALDI FTICR IMS were shown to produce data with high mass accuracy (<5 ppm) and resolving power (∼75 000 at m/z 5000) for proteins up to ∼20 kDa. Analysis of clear cell renal cell carcinoma using MALDI FTICR IMS identified specific proteins localized to healthy tissue regions, within the tumor, and also in areas of increased vascularization around the tumor.
Keywords: Cystic fibrosis, FTICR MS, High-throughput, Human clear cell renal cell carcinoma, Nutritional immunity, Technology
1 Introduction
Matrix-assisted laser desorption/ionization imaging mass spectrometry (MALDI IMS) has developed into a powerful analytical tool enabling the visualization of biomolecules in tissue [1]. MALDI IMS combines the sensitivity and selectivity of mass spectrometry with the spatially descriptive characteristics of classic histology. This technology has been applied to a variety of analyte classes including pharmaceuticals [2, 3], metabolites [4], lipids [5], peptides [6, 7] and proteins [8, 9]. Briefly, MALDI IMS experiments are performed by cutting fresh frozen or fixed tissue into thin sections and flat-mounting them onto a target. The sample is then coated with a MALDI matrix, which assists in desorption and ionization of endogenous molecules. During acquisition, spectra are collected by laser irradiation at discrete x,y coordinates from virtually defined regions of the tissue. Typically, image spatial resolution is defined by the size of the laser spot on target and the spacing between the points in the array. Signal intensity maps are then plotted across the sampled area creating ion images. A single MALDI IMS experiment can produce thousands of images that can be compared to histologically stained sections of the tissue, providing an additional molecular dimension to classical histological analysis. MALDI IMS of intact proteins is of particular interest because it has the potential to spatially describe many endogenous proteins and post-translational modifications in a single experiment. However, there are unique challenges associated with protein imaging experiments in general, including the need for higher spatial resolution capabilities, improved image acquisition rates, and better molecular specificity. Ultra-high speed MALDI-TOF IMS and high mass resolution MALDI FTICR IMS platforms can provide the performance necessary to overcome these challenges.
MALDI time-of-flight mass spectrometers (MALDI-TOF MS) are commonly used for molecular imaging experiments due to the high sensitivity and dynamic range, large practical mass range, reasonable molecular specificity, and high throughput of the TOF analyzer [10]. Applications of ultra-high speed MALDI-TOF IMS to the analysis of small molecules and lipids have been reported previously [11–15]. In these examples, throughput is maximized using continuous laser raster sampling where the laser is continuously fired while the sample stage is moved laterally across the area of interest. Although this approach can achieve high data acquisition rates (>30 pixels/s for small molecules), this sampling approach introduces complications in defining the true pixel size. More recently, a unique approach for performing continuous sampling in a way that still maintains discrete pixels was reported [16]. Here the sample and laser are moved simultaneously so that discrete square pixels can be scanned as the sample target moves continuously. Square pixels are produced by rastering many laser shots from a small diameter beam (relative to the final pixel size). This platform also incorporates a 10 kHz laser allowing for data acquisition rates of ∼50 pixels/s to be achieved.
Fourier transform mass spectrometers (FTMS), such as Fourier Transform Ion Cyclotron Resonance (FTICR) [17] and orbital trapping (Orbitrap) [18,19], provide the highest mass resolution and accuracy of all mass analyzers. For imaging experiments, these high performance instruments routinely produce ion images with mass resolving powers greater than 50000 (m/Δm50%) and mass accuracies better than 5 ppm [4,20,21]. High spectral performance is critical for complex samples, such as tissue analysis, where it is necessary to distinguish overlapping isotopic distributions and endogenous nominal isobars. Additionally, high mass accuracy allows for improved identification confidence. However, the application of FTMS to intact protein analysis has been limited because Orbitraps are fundamentally m/z range limited (m/z < 4000) and traditionally MALDI FTICR IMS has not been considered sensitive enough for on-tissue protein analysis. Only recently has MALDI FTICR IMS been used to produce ion images for intact proteins [22]. In this work, proteins up to m/z ∼12 000 were detected and the utility of using high mass accuracy to link IMS and LC-based top-down experiments was demonstrated.
Here we describe the next-generation capabilities of ultrahigh speed MALDI-TOF MS and high mass resolution MALDI FTICR MS for spatial proteomics experiments. Using ultra-high speed MALDI-TOF IMS, 30 and 10 μm protein images of rat brain tissue and human lung tissue from a cystic fibrosis patient were acquired at image acquisition rates >25 pixels/s. Substructures within the brain as small as 50 μm are spatially differentiated and multiple proteins associated with host immune response were observed in cystic fibrosis lung tissue. The ability of ultra-high speed MALDI-TOF IMS to produce megapixel molecular images is also demonstrated for lipid analysis of cystic fibrosis lung tissue. Additionally, the advantages of performing imaging experiments of intact proteins using MALDI FTICR IMS are shown. This approach provides an unprecedented combination of mass accuracy (<5 ppm) and resolving power (∼75 000 at m/z 5000) for proteins up to ∼20 kDa. In the provided case study using MALDI FTICR IMS, specific proteins were observed to localize to healthy tissue regions, within the tumor, and also in areas of increased vascularization around the tumor of human clear cell renal cell carcinoma tissue.
2 Materials and methods
2.1 Materials
Acetic acid, trifluoroacetic acid (TFA), 2,5-dihydroxyacetphenone (DHA), and 1,5-Diaminonaphthalene (DAN) were purchased from Sigma-Aldrich Chemical Co. (St. Louis, MO, USA). HPLC-grade acetonitrile (ACN), ethanol, and chloroform were purchased from Fisher Scientific (Pittsburgh, PA, USA). Masson's Trichrome 2000™ stain kit was purchased from American MasterTech (Lodi, CA, USA).
2.2 Samples
Fresh frozen rat brains were purchased from Pel-Freez Biologicals (Rogers, AZ, USA). Human clear cell renal cell carcinoma (ccRCC) samples were collected from patients undergoing nephrectomies and obtained through the National Institutes of Health Cooperative Human Tissue Network and the Vanderbilt University Ingram Cancer Center-Human Tissue Acquisition and Pathology Resource. Samples were snap frozen using liquid nitrogen less than 30 min post-resection and stored at −80°C until use.
Human lungs were obtained for research purposes from a patient with cystic fibrosis and end-stage lung disease at the time of lung transplantation. Informed consent was obtained and the protocol was approved by the Vanderbilt University Institutional Review Board. Lung explants were known to be chronically infected with Pseudomonas aeruginosa and Strenotrophomonas maltiphilia. A biopsy from the right lower lobe was frozen using dry ice in 50% Optimal Cutting Temperature Polymer (Tissue-Tek, SakuraFinetek, Torrance, CA, USA).
2.3 MALDI IMS
Frozen tissue was sectioned to ten microns at −20°C using a CryoStar™ NX70 Cryostat (Thermo Fisher Scientific, Waltham, MA, USA). Sections were mounted onto conductive Indium-tin-oxide coated slides (Delta Technologies, Love-land, CO, USA). Tissues were washed to remove interfering lipids and salts in sequential washes of 70% ethanol (30 s), 100% ethanol (30 s), Carnoy fluid (6:3:1 ethanol: chloroform: acetic acid) (2 min), 100% ethanol (30 s), water with 0.2% TFA (30 s), and 100% ethanol (30 s) [23]. Slides were stored at −80°C until IMS analysis was performed. Matrix was applied using a TM Sprayer (HTX Technologies, Carrboro, NC, USA) with 15 mg/mL DHA in 9:1 ACN:ddH2O with 0.2% TFA. Sprayer conditions include a flow rate 0.1 mL/min, nitrogen flow of 10 psi, spray temperature of 80°C, a spray velocity of 1100 mm/min, four passes with offsets and rotations, and 9:1 ACN:ddH2O as the pushing solvent. Samples were rehydrated as previously described [23] at 37°C for 3 min with 1 mL of 50 mM acetic acid as the rehydration solvent. For lipid analyses, DAN matrix was sublimated onto tissue surfaces as previously described [24,25]. Briefly, a slide containing tissue was taped to the bottom of the condenser in a simple sublimation apparatus. Approximately 100 mg of DAN was placed in the sublimation apparatus flask. Sublimation was carried out at approximately 50 mTorr at 110°C for 7 min.
High-throughput and spatial resolution imaging experiments were performed using a rapifleX MALDI Tissuetyper (Bruker Daltonics, Billerica, MA, USA). The instrument is equipped with a Smartbeam 3D 10 kHz Nd:YAG (355 nm) laser. The instrument is capable of rapidly generating IMS data from discrete square pixels by moving the laser and the stage independently. This enables the stage to be moved continuously while the laser scans the full area of each pixel. All protein images were collected using the single spot laser setting (∼5 μm) with a pixel scan size of 30 μm or 10 μm in both x and y dimensions. For protein analysis, data were collected in positive ion mode from m/z 2000–20000 and each pixel consisted of an average of 300 laser shots. 30 μm ion images of rat brain and human lung tissue sections consisted of 144 682 and 140 772 pixels, respectively. Ten micrometer ion images of rat brain and human lung tissue sections consisted of 24218 and 29 236 pixels, respectively. Lipid imaging data was collected in negative ion mode from m/z 600–1000 with 200 laser shots averaged per pixel. Twenty micrometer lipid images of human lung tissue sections consisted of 1 015 083 pixels.
High mass resolution imaging experiments were performed using a 15T Bruker MALDI FTICR mass spectrometer (Bruker Daltonics, Billerica, MA, USA). The instrument is equipped with an Apollo II dual MALDI/ESI ion source and a Smartbeam II 2 kHz Nd:YAG (355 nm) laser. All images were collected using the small laser setting (∼50 μm) with a pixel spacing of 100 μm in both x and y dimensions. Data were collected from m/z 1100–25 000 with a data size of 1MB per spectrum. Special tuning of the Funnel RF amplitude (250 Vpp), accumulation hexapole (1.4 MHz, 1950 Vpp), transfer optics (1 MHz, 380 Vpp), time of flight delay (2.8 ms), and ICR cell (Sweep excitation power: 48%) were required for high m/z analysis. Although all parameters play a role in improving ion transmission through the source ion optics, tuning of the accumulation hexapole had the greatest impact on ion signal for high mass ions. External calibration was performed prior to analysis using CsI clusters. Ion images consisted of 13 596 pixels and 14 632 pixels for rat brain and ccRCC samples respectively. FlexImaging 4.1 (Bruker Daltonics, Billerica, MA, USA) was used to visualize ion images. All protein identifications were tentatively made using mass accuracy (<5 ppm) of the highest intensity isotope by comparing MALDI FTICR IMS data to previously reported results or the compiled MSiMass database [26].
2.4 Histology
Immediately following MALDI IMS experiments, matrix was removed from samples using 100% ethanol and samples were hydrated through graded ethanol to ddH2O prior to using the Masson's Trichrome stain kit. Briefly, samples were incubated in a mordant solution, and then immersed in a Weigert's hematoxylin solution to stain cell nuclear contents black. A Biebrich Scarlet-Acid Fuchsin solution was used to stain acidophilic tissue components such as keratin and intercellular fiber red, and an aniline blue solution was used to stain collagen and mucus blue. Optical images of stained tissue sections were obtained at 20x magnification using a Leica SCN400 Brightfield Slide Scanner.
3 Results and discussion
3.1 Ultra-high performance MALDI IMS
As applications of protein imaging mass spectrometry advance, the development of sample preparation methods and instrumentation that improves sensitivity while enabling high-throughput and high mass resolution protein analysis is critical. Next-generation IMS instrumentation capabilities provide the means to overcome these challenges. As shown in Fig. 1, MALDI-TOF platforms can acquire high quality protein image data rapidly. IMS data were collected from one hemisphere of a transverse section of rat brain tissue (Fig. 1A). Highlighted are overlaid ion images for m/z 5024, m/z 7070, m/z 10 665, m/z 13 790, and m/z 15 203. The overall average spectrum for the 30 μm imaging experiment is shown in Fig. 1F, highlighting each peak for the selected ion images. Image data were collected at a spatial resolution of 30 μm with ∼145 000 total pixels at a rate of >25 pixels/s. This IMS data set was acquired in just over 1.5 h. It is noted that although the instrument is capable of collecting data at even higher rates, the acquisition rate is limited based on the flight time of the highest m/z value detected. Thus, throughput decreases with increasing m/z measurements.
Figure 1.
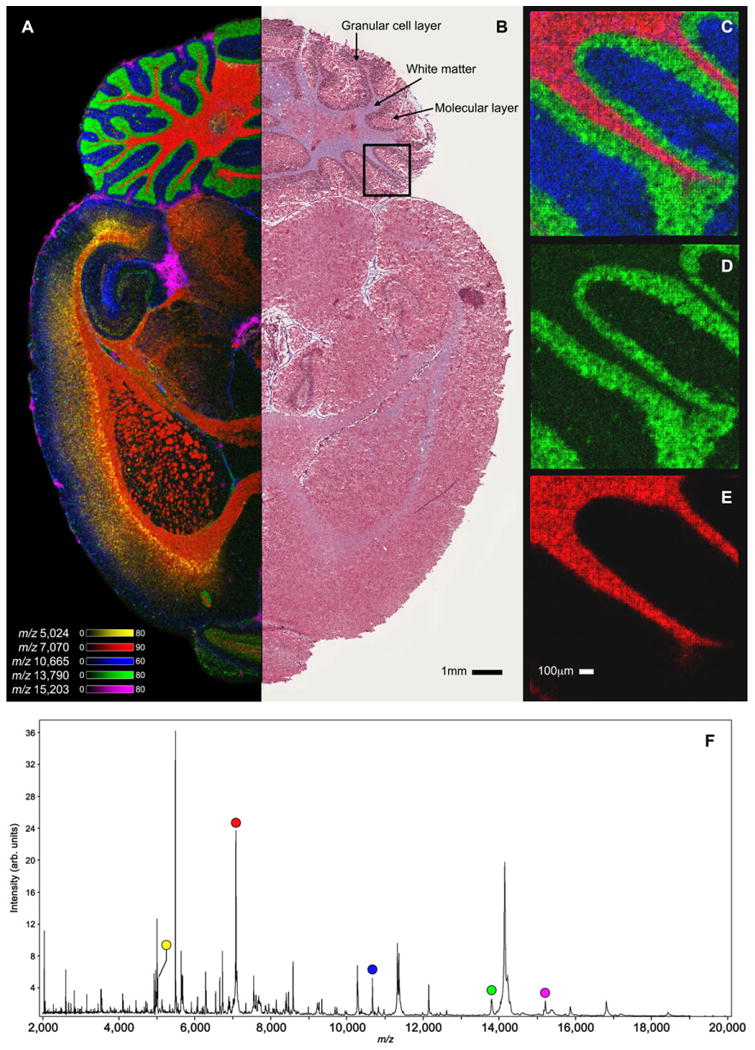
Selected ion images of transversally sectioned rat brain tissue collected using ultra-high throughput MALDI-TOF IMS. Observed substructures in the overlaid 30 μm ion image (A) of m/z 5024 (yellow), m/z7070 (red), m/z 10 665 (blue), m/z 13 790 (green) and m/z 15 203 (pink) were consistent with the trichrome staining following IMS acquisition (B). High spatial resolution (10 μm) ion images were collected from the area outlined in black (C–E). The overall average spectrum for the 30 μm imaging experiment is shown in (F) highlighting each peak for the ions in (A).
The selected protein signals show clear localization to specific substructures throughout the brain. For instance, within the cerebellum, m/z 7070 is localized to the white matter, m/z 13 790 to the granular cell layer and m/z 10 665 to the molecular layer. The spatial demarcation of protein expression within these substructures of the brain is made even clearer using high spatial resolution imaging. Figure 1C–E highlights 10 μm imaging results using ultra-high speed MALDI-TOF MS that were acquired in ∼15 min (∼24000 pixels). Even at 10 μm spatial resolution, protein signals can be detected with good sensitivity and are able to distinguish structures that are <100 μm in size. This is clearly observed in the 10 μm ion image of m/z 7070 that traces the myelinated axon tracts of the white matter. The end of the imaged axon tract branches and is observable down to ∼50 μm with 10 μm imaging analyses. These results are consistent with an image from trichrome histological staining of the same tissue provided for comparison (Fig. 1B).
Because mass spectrometric-based imaging is typically performed in scanning microprobe mode (pixels are collected one at a time), developments in spatial resolution and throughput are tightly intertwined. The quadratic relationship between spatial resolution and the number of pixels acquired makes throughput even more critical as spatial resolution capabilities advance. For instance, using more traditional MALDI-TOF platforms capable of acquiring ∼3 pixels/s the 30 μm and 10 μm spatial resolution IMS data sets (highlighted in Fig. 1) would have taken ∼13.4 h and ∼2.3 h, respectively. Therefore, high spatial resolution experiments are typically collected over very limited tissue areas. By producing protein imaging data almost 10× faster than traditional imaging instruments, next-generation ultra-high speed MALDI-TOF platforms enable advanced applications that require high spatial resolution data to be acquired over relatively large areas.
Improving spectral performance criteria such as mass resolving power and accuracy are also critical for next-generation molecular imaging experiments. Specifically, direct tissue analysis provides unique challenges associated with overcoming biomolecular complexity and protein identification. Figure 2 shows the capabilities of MALDI FTICR MS for protein imaging experiments. The analysis of rat brain tissue using MALDI FTICR IMS provided rich data with good sensitivity for ions up to m/z ∼ 17 000 and proteins approaching 20 kDa (Fig. 2A). The spectral data (Fig. 2B–E), which are plotted as the overall average from the entire imaging experiment, were collected with a resolving power of ∼ 70000 at m/z 5000, resulting in 2695 peaks between m/z 1100–17000 with S/N > 20. To our knowledge, these data represent the largest ions detected from tissue using MALDI FTICR IMS with an m/z increase of ∼5000 compared to previously reported results [22]. It is noted that this resolving power is not the theoretical limit of the spectral performance for MALDI FTICR protein imaging. For all experiments, resolving power is tuned to provide the performance necessary to resolve the target analytes but maintain the practicality of collecting imaging data. To achieve a resolving power of 70000 at m/z 5000 a time-domain signal of ∼2 s is required. Although detection events can be extended to increase resolving power further, the throughput of the experiment can become prohibitive for collecting ion images with large number of pixels.
Figure 2.
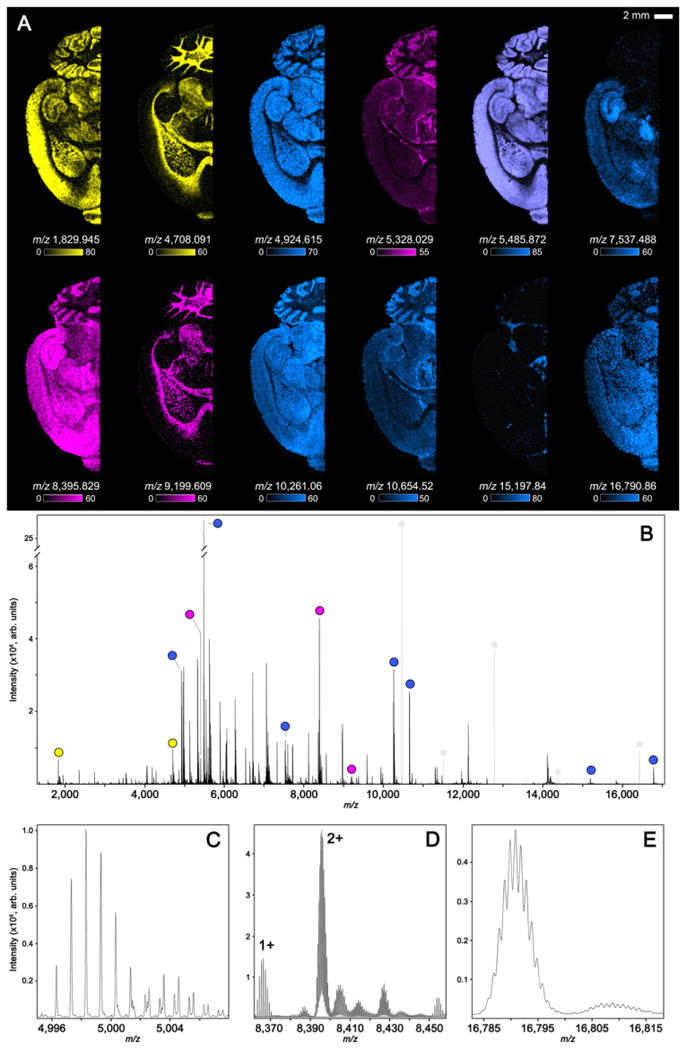
MALDI FTICR IMS data collected from transversally sectioned rat brain tissue. Selected ion images (A) are color-coordinated based on charge state (Blue: 1+, Pink: 2+ and Yellow: 3+). The overall average spectrum for the 100 μm imaging experiment is shown in (B) highlighting each peak used to generate the selected ion images (A). Expanded m/z windows (C–E) highlight the ability to detect proteins up to roughly m/z 17 000 while providing the mass resolving power necessary to differentiate overlapping isotopic envelopes and determine protein charge states. Electronic noise peaks have been greyed and marked (*) to simplify the spectrum (B).
The peak for each of the selected ion images is highlighted by the colored dots overlaid on the full-scan spectrum (Fig. 2B). Expanding the m/z scale (Fig. 2C–E) shows the overall complexity and quality of the data. MALDI FTICR IMS provides the mass resolution necessary to distinguish overlapping isotopic distributions from neighboring ions (Fig. 2C and D) and protein charge states (Fig. 2D). The resolving power of the experiment is more than sufficient to resolve the isotopic envelope for a given protein, enabling unambiguous assignment of charge states as demonstrated by the difference in isotope spacing between the singly charged ion labeled 1+ (spacing: m/z ∼1.0) and the doubly charged ion labeled 2+ (spacing: m/z ∼0.5 Da). The same is true for higher m/z ions. Although not fully resolved, MALDI FTICR IMS can resolve the isotopic envelope even for a protein detected at m/z 16 790.86 (Fig. 2E). Selected ion images are color-coordinated based on charge state (Blue: 1+, Pink: 2+ and Yellow: 3+).
Although protein identification was not the goal of this experiment, high-performance MALDI FTICR IMS also improves the ability to identify proteins observed in imaging experiments. High mass resolution IMS enables the differentiation between different proteoforms and provides the mass accuracy (<5 ppm) needed to link imaging data to orthogonal LC-based proteomics experiments and databases of previously identified biomolecules [22]. For example, the largest ion detected in this experiment was m/z 16 790.864 (highest intensity isotope). Based on previously reported protein identifications from rat brain in imaging experiments [27], it is most likely calmodulin (theoretical m/z 16 790.847, ∼1 ppm mass accuracy). Calmodulin is a Ca2+-binding protein that activates several intracellular enzymes (e.g. kinases, phosphates and adenyl cyclases) in cells [28]. In the brain, Ca2+/calmodulin signaling is involved in processes such as neurotransmitter release, transcriptional regulation, and cell death [29,30].
3.2 Case study: Protein expression in human lung tissue from a cystic fibrosis patient
Cystic fibrosis is a genetic disorder affecting 1 in every 3000 newborns. The disease is caused by mutations in the cystic fibrosis transmembrane conductance regulator protein, which is involved in homeostasis of epithelial sodium channels. This can cause dysregulation of sweat, gastrointestinal fluids, and mucus [31]. Hallmarked by long-term persistent bacterial colonization in the lungs, patients with late-stage lung disease develop thick mucus blocking airways and causing fibrosis, making it increasingly difficult for patients to breathe [32]. Because lung tissues from cystic fibrosis patients are relatively large, heterogeneous samples with various biologically relevant substructures, high-speed MALDI-TOF IMS is an ideal analytical technology to further study the pathogenesis of this disease.
High-speed MALDI-TOF IMS protein data collected from human lung tissue from a cystic fibrosis patient is shown in Fig. 3. Data were collected with the same experimental parameters as the previously described rat brain tissue imaging experiment. Figure 3A shows overlaid IMS data from individual ions highlighted in Fig. 3B–F. High spatial resolution (10 μm) MALD-TOF IMS data (Fig. 3G) displays the extreme spatial heterogeneity of the sample. Protein identifications were made based on mass accuracy from secondary MALDI FTICRIMS experiments (Data not shown). Hemoglobin subunit alpha (residues 2–142), is depicted in orange at m/z 15 145 and, aside from the airways, is observed throughout the lung. Hemoglobin is involved in oxygen transport from the lung to other cells in the body. Therefore, it is reasonable that this ion marks the majority of the lung cells. The observed ion at m/z 11 339 (dark blue) was determined to be histone H4. Histones are abundant proteins involved in gene regulation and they protect DNA from damage by keeping non-transcriptionally active DNA tightly bound. Histone H4 was observed at higher abundance surrounding infected airways. This is likely to be associated with a change in cell density, as the areas around these airways show an increase in immune cell recruitment. S100A6 (calcyclin) was detected at m/z 10095 (yellow), representing residues 2–90 with an acetylation. This protein is found in higher concentrations in cells under mechanical strain. Here the protein is localized to large airways within the lung parenchyma, which supports previous work that such cells are sensitive to changes in mechanical force [33,34]. Interestingly, this could be a factor in breathing difficulties when airways are infiltrated with immune cells in cystic fibrosis patients. S100A8 was found to be spatially localized primarily within infected airways. S100A8, depicted in teal at m/z 10 846, is a subunit of the neutrophil-associated protein calprotectin. Neutrophilic recruitment to airways is a hallmark of cystic fibrosis. Calprotectin was originally isolated from cystic fibrosis patients [35, 36] and was later found to have extensive antimicrobial properties through the chelation of nutrient metals [37,38]. Neutrophil defensin 1 (m/z 3450, red) is an abundant antibacterial peptide involved in host innate immune defense [39]. This protein is rich in lysine and arginine residues whose cationic properties contribute to the disruption of microbial membranes, aiding in the killing of pathogens [39].
Figure 3.
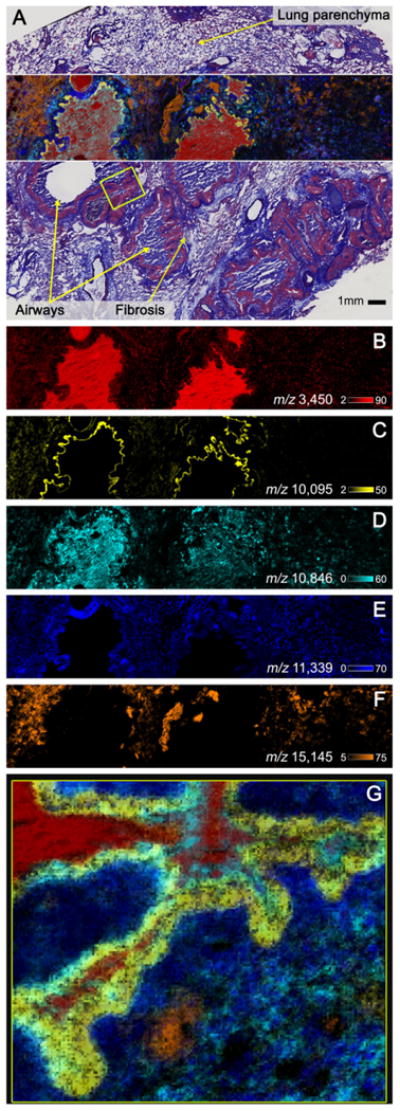
Selected ion images of human lung tissue from a cystic fibrosis patient collected using ultra-high speed MALDI-TOF IMS. Observed substructures in the overlaid 30 μm ion image of m/z 3450 (neutrophil defensin 1, red), m/z 10 095 (S100A6, yellow), m/z 10 846 (S100A8, teal), m/z 11 339 (histone H4, blue) and m/z 15 145 (hemoglobin subunit alpha, orange) were consistent with the trichrome staining following IMS acquisition (A). To highlight the spatial diversity of the selected proteins, individual images of each ion are shown in (B–F). High spatial resolution (10 μm) MALD-TOF IMS data were collected from the area outlined in yellow (G).
One of the advantages of high-throughput IMS analysis is that it allows the acquisition of data sets with large numbers of pixels. In the 30 μm spatial resolution protein imaging experiment described above, ∼141 000 pixels were acquired in about 1.5 h. The ability to produce ion images at this pace makes collecting chemically-specific mass spectrometry data with the image quality of classic histology routine. This capability enables true molecular histology and opens the door to new, advanced IMS applications including the generation of megapixel ion images. Figure 4 shows a megapixel molecular image collected using mass spectrometry (See Fig. 3 for comparable histological image). This MALDI-TOF IMS data set, represented as an overlay of four lipid images, was collected from cystic fibrosis lung tissue. The ion m/z 814.5 in blue was observed throughout the tissue. The ion at m/z 885.6 (white) was localized to the areas of inflammatory debris and mucous filled airway lumen and in regions of fibrosis surrounding the airways. The ions in pink and yellow (m/z 797.7 and m/z 861.6) were primarily observed in lung parenchyma. These ion images are constructed of 1 015 083 total pixels that were acquired at a rate of ∼50 pixels/s, allowing the entire megapixel molecular image to be collected in under 6 h. Lipid data can be acquired at higher rates than protein data because throughput is generally limited by the flight time of the largest measured m/z value. Ultra-high speed MALDI-TOF IMS provides the capabilities required to fully visualize these complex biological samples for next-generation molecular imaging applications.
Figure 4.
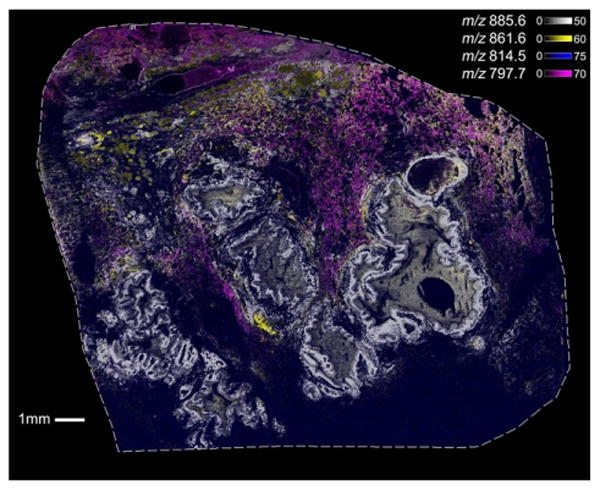
Ultra-high speed MALDI-TOF IMS data (20 μm) of human lung tissue from a cystic fibrosis patient consisting of over 1 million total pixels collected in ∼6 h. Highlighted are the overlaid ion images of lipids observed at m/z 885.6 (white), m/z 861.6 (yellow), m/z 814.5 (blue) and m/z 797.7 (pink).
3.3 Case study: protein expression in clear cell renal cell carcinoma (ccRCC)
Cancer diagnoses of the kidney and renal pelvis are estimated to reach over 61 000 people in the United States in 2015, with roughly a 23% mortality rate [40]. Over 90% of these diagnoses will be of renal cell carcinoma, of which the majority will be clear cell renal cell carcinoma (ccRCC) [40]. Detection and imaging of these tumors have typically been performed through computed tomography (CT) and magnetic resonance imaging (MRI) [41], though immunological and biomarker assays have become more prevalent in diagnostics [42]. Many ccRCC tumors are resistant to chemotherapy and radiation therapy, so nephrectomies still remain the gold standard of treatment with a greatly improved prognosis if the tumor is completely removed [43]. Unfortunately, visual and histological assessments of tumor margins can prove insufficient, with incomplete resections leading to disease recurrence [44]. Molecular localization patterns in and around the tumor can provide insight into the tumor microenvironment and aid in defining the molecular margin [45].
MALDI FTICR IMS protein data collected from human ccRCC tissue is shown in Fig. 5. These data have similar figures of merit to the previously discussed rat brain FTICR IMS analysis. The average spectrum from the entire imaging experiment shows ions detected with good sensitivity up m/z ∼ 16000 (Fig. 4B). The data were collected with a resolving power of ∼ 75 000 at m/z 5000 resulting in 4051 peaks detected between m/z 2000-16000 with S/N > 20. An overlay of the proteins detected at m/z 5653.732, m/z 4936.536 and m/z 7934.107 show good correlation to tissue substructures visualized by histological staining (Fig. 5A). Hemoglobin subunit beta was detected at m/z 7934.107 (HBB, [M+2H]2+,4.7ppm) and was observed throughout the kidney with regions of highest intensities near the tumor regions. Normal kidney functions include removing excess organic molecules from the blood through small filtration units called glomeruli. However, renal cell carcinoma, like many other tumors, utilizes the process of angiogenesis to promote vascularization in and around the developing tumor. This in turn supplies the tumor with blood rich in nutrients for growth and proliferation [46]. Localization of hemoglobin to these regions likely corresponds to a highly vascularized carcinoma. The ion observed at m/z 4936.536 was found to be N-terminally acetylated thymosin β10 (Thyβ10-AC, [M+H]1+, 1.1 ppm) and was localized specifically to the tumor region, with relatively low abundance in surrounding normal tissue. Thymosin β10 organizes the cytoskeleton between cells by regulating the formation of actin polymers. The relative abundances have been shown to rapidly increase during the development of various cancers, including renal cell carcinoma [47]. Histones are core components of the nucleosome and regulate DNA repair and replication. They have been shown to have many post-translational modifications, effectively altering their function within biological systems. Histone H4 has been observed in relatively lower abundance in cancerous regions compared to normal tissue [48], however recent work has shown that renal cell carcinoma and many other cancers can alter histone modification pathways, changing the post-translational modifications that are expressed [49]. The image of m/z 5653.732, determined to be histone H4 with an acetylation and dimethylation (HH4-AC/2Me, [M+2H]2+, -4.4 ppm), shows an increased abundance in the adjacent normal tissue, with significantly lower signal in the tumor region.
Figure 5.
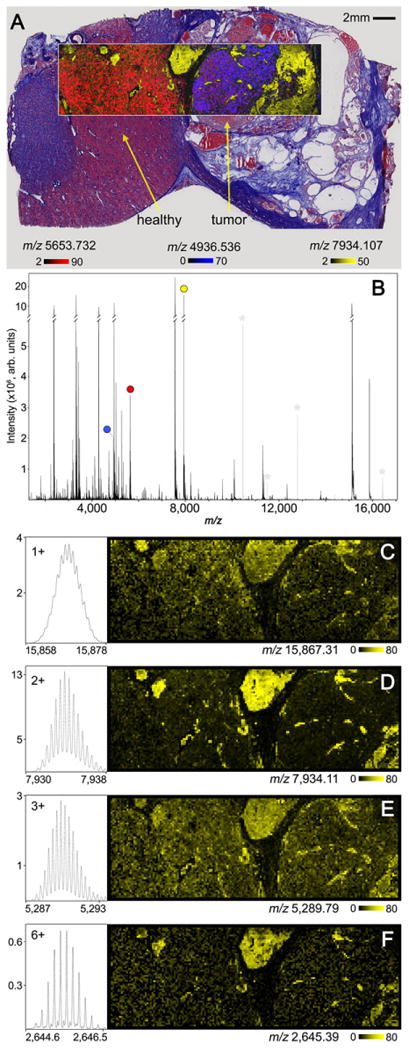
MALDI FTICR protein imaging data collected from a clear cell renal cell carcinoma human sample. Observed substructures in the overlaid 30 μm ion image of m/z 5653.732 (HH4-AC/2Me, [M+2H]2+, red), m/z 4936.536 (Thyβ10-AC, [M+H]1+, blue), and m/z 7934.107 (HBB, [M+2H]2+, yellow), were consistent with the trichrome staining following IMS acquisition (A). The overall average spectrum for the 100 μm imaging experiment is shown in B highlighting each peak used to generate the selected ion images (A). Ion images and isotopic distributions for the [M+H]1+, [M+2H]2+, [M+3H]3+, and [M+6H]6+ charge states of hemoglobin subunit beta are shown in (C–F). Electronic noise peaks have been greyed and marked (*) to simplify the spectrum (B).
A unique aspect of performing protein imaging experiments using MALDI FTICR IMS is the ability to both generate multiply charged ions using MALDI matrices such as DHA and then accurately determine the charge state of highly charged ions. Figure 5C–F show the ion images and isotopic distributions for the [M+H]1+, [M+2H]2+, [M+3H]3+, and [M+6H]6+ charge states of hemoglobin subunit beta. Although the 2+ charge state is detected with much greater intensity, the other ions are still detected with good sensitivity. The generation of multiply charged ions using low mass resolution instruments can complicate spectral interpretation, particularly for complex samples such as biological tissues. However, the ability to produce highly charged ions using high resolving power instrumentation that can differentiate overlapping isotopic patterns to simplify interpretation is advantageous in moving larger proteins into the effective m/z range of the instrument. This potentially improves the capability of top-down fragmentation experiments directly from tissue.
4 Concluding remarks
Next-generation MALDI imaging platforms can provide unprecedented performance in terms of spatial resolution, image acquisition speed, and mass resolution for spatial proteomics experiments. We have demonstrated here the capabilities of ultra-high speed MALDI-TOF IMS to collect protein images at acquisition rates > 25 pixels/s and lipid images at ∼50 pixels/s. This is an improvement of almost 10x over traditional IMS platforms for the analysis of intact proteins. MALDI-TOF IMS of rat brain tissue at 10 μm demonstrates the ability to clearly visualize substructures within the brain as small as ∼50 μm with good sensitivity. High-speed data acquisition also enabled the visualization of protein expression at high spatial resolution throughout a relatively large human lung tissue section from a cystic fibrosis patient. This case study provided an example of an experiment that requires high spatial resolution IMS data to be acquired over large areas due to the high degree of heterogeneity of the sample. In these experiments, we were able to detect a number of proteins including those associated with host innate immune response. S100A8 (m/z 10864) and neutrophil defensin 1 (m/z 3450) are among those highlighted that were found to localize specifically in the mucus-filled airways. Both proteins have antimicrobial properties and are known to localize at sites of infection. Similar localizations were reported in lipid imaging experiments where we showed the first example of megapixel molecular imaging using ultra-high speed MALDI-TOF IMS.
We have also shown the advantages of performing imaging experiments of intact proteins using MALDI FTICR IMS. In our analysis of rat brain tissue, we demonstrated the ability to detect proteins with good sensitivity up to m/z ∼17000 and proteins as large as ∼20 kDa. This is an m/z increase of almost 5000 over previously reported results. IMS of rat brain tissue and clear cell renal cell carcinoma tissue from a human patient using MALDI FTICR IMS produced ion images with high mass resolution (∼75 000 at m/z 5000) and accuracy (< 5 ppm). Our analysis of ccRCC tissue elucidated proteins that were observed to be at greater abundance in the healthy tissue regions of the tissue (HH4-AC/2Me, [M+2H]2+, -4.4ppm), within the tumor (Thyβ10-AC, [M+H]1+, 1.1 ppm), and also localized to areas of increased vascularization around the tumor (HBB, [M+2H]2+, 4.7 ppm). These data showed the capabilities of MALDI FTICR IMS to provide the molecular specificity needed to overcome the challenges associated with direct tissue analysis.
Ultra-high speed MALDI-TOF IMS and high mass resolution MALDI FTICR IMS represent the next-generation of analytical tools for protein imaging experiments. Like all analytical technologies, each platform has its own unique advantages and disadvantages. Ultra-high speed MALDI-TOF IMS can produce high spatial resolution results rapidly enabling the acquisition of “microscopy-like” images. MALDI FTICR IMS can provide unprecedented molecular specificity for protein imaging experiments. Together, these tools are bringing the field closer than ever before to true molecular histology.
Significance of the study.
Imaging mass spectrometry of proteins has unique challenges associated with throughput, sensitivity at high spatial resolution, molecular specificity, and identification. This study utilizes ultra-high speed MALDI-TOF MS and high mass resolution MALDI FTICR MS to improve protein image acquisition rates by ∼10x, achieve 10 μm spatial resolution with good sensitivity, and isotopically resolve proteins ionized by MALDI up to ∼20 kDa. These are critical advancements in protein imaging capabilities because high-throughput data acquisition is necessary for the practicality of high spatial resolution imaging and the ability to generate protein images with high mass resolution and accuracy is essential for identification. Using these advanced imaging technologies, proteins associated with host immune response were observed in human lung tissue from a cystic fibrosis patient and the analysis of clear cell renal cell carcinoma elucidated distinct protein localizations in healthy tissue, tumor cell populations, and areas of increased vascularization around tumor regions.
Acknowledgments
The authors wish to acknowledge the support of grants from the NIH/NIGMS (5 P41 GM103391-04 and 5R01 GM058008) and the National Institutes of Health Shared Instrumentation Grant Program (1S10OD012359-01) awarded to RMC and the National Institute of Allergy and Infectious Diseases (R01 AI101171-01A1 and R21 AI107233) and Department of Veterans Affairs (Merit Grant I01BX002482) awarded to EPS. DGR is supported by the Aegis Sciences Fellowship in Chemistry, Vanderbilt University. JLM is supported by Vanderbilt Chemical Biology Interface training program (T32 GM 065086) and the Mitchum Warren Graduate Research Fellowship. MJN is supported by the NIH (2T32HL087738-06) and the Cystic Fibrosis Foundation (NOTO15D0). The authors would also like to thank Dr. Shannon Cornett and Dr. Michael Becker of Bruker Daltonics for their assistance in the collection of MALDI-TOF lipid imaging data and Dr. Jonathan Kropski and Dr. Jim Loyd for assistance obtaining explanted CF lung tissue.
Abbreviations
- AC
acetylated
- ccRCC
clear cell renal cell carcinoma
- CF
cystic fibrosis
- DAN
1,5-Diaminonaphthalene
- DHA
2,5-dihydroxyacetphenone
- HBB
Hemoglobin subunit beta
- HH4
histone H4
- IMS
imaging mass spectrometry
- 2Me
dimethylated
- Thyβ10
thymosin β10
Footnotes
References
- 1.Caprioli RM, Farmer TB, Gile J. Molecular imaging of biological samples: localization of peptides and proteins using MALDI-TOF MS. Anal Chem. 1997;69:4751–4760. doi: 10.1021/ac970888i. [DOI] [PubMed] [Google Scholar]
- 2.Nilsson A, Goodwin RJ, Shariatgorji M, Vallianatou T, et al. Mass spectrometry imaging in drug development. Anal Chem. 2015;87:1437–1455. doi: 10.1021/ac504734s. [DOI] [PubMed] [Google Scholar]
- 3.Huang JT, Hannah-Qiuhua L, Szyszka R, Veselov V, et al. Molecular imaging of drug-eluting coronary stents: method development, optimization and selected applications. J Mass Spectrom. 2012;47:155–162. doi: 10.1002/jms.2046. [DOI] [PubMed] [Google Scholar]
- 4.Bhandari DR, Schott M, Rompp A, Vilcinskas A, Spengler B. Metabolite localization by atmospheric pressure high-resolution scanning microprobe matrix-assisted laser desorption/ionization mass spectrometry imaging in whole-body sections and individual organs of the rove beetle Paederus riparius. Anal Bioanal Chem. 2015;407:2189–2201. doi: 10.1007/s00216-014-8327-1. [DOI] [PMC free article] [PubMed] [Google Scholar]
- 5.Berry KA, Hankin JA, Barkley RM, Spraggins JM, et al. MALDI imaging of lipid biochemistry in tissues by mass spectrometry. Chem Rev. 2011;111:6491–6512. doi: 10.1021/cr200280p. [DOI] [PMC free article] [PubMed] [Google Scholar]
- 6.Groseclose MR, Andersson M, Hardesty WM, Caprioli RM. Identification of proteins directly from tissue: in situ tryptic digestions coupled with imaging mass spectrometry. J Mass Spectrom. 2007;42:254–262. doi: 10.1002/jms.1177. [DOI] [PubMed] [Google Scholar]
- 7.Schober Y, Guenther S, Spengler B, Rompp A. High-resolution matrix-assisted laser desorption/ionization imaging of tryptic peptides from tissue. Rapid Commun Mass Spectrom. 2012;26:1141–1146. doi: 10.1002/rcm.6192. [DOI] [PubMed] [Google Scholar]
- 8.Deutskens F, Yang J, Caprioli RM. High spatial resolution imaging mass spectrometry and classical histology on a single tissue section. J Mass Spectrom. 2011;46:568–571. doi: 10.1002/jms.1926. [DOI] [PMC free article] [PubMed] [Google Scholar]
- 9.Seeley EH, Schwamborn K, Caprioli RM. Imaging of intact tissue sections: moving beyond the microscope. J Biol Chem. 2011;286:25459–25466. doi: 10.1074/jbc.R111.225854. [DOI] [PMC free article] [PubMed] [Google Scholar]
- 10.Vestal ML. Modern MALDI time-of-flight mass spectrometry. J Mass Spectrom. 2009;44:303–317. doi: 10.1002/jms.1537. [DOI] [PubMed] [Google Scholar]
- 11.Bednarik A, Kuba P, Moskovets E, Tomalova I, et al. Rapid matrix-assisted laser desorption/ionization time-of-flight mass spectrometry imaging with scanning desorption laser beam. Anal Chem. 2014;86:982–986. doi: 10.1021/ac402823n. [DOI] [PubMed] [Google Scholar]
- 12.Prentice BM, Chumbley CW, Caprioli RM. High-speed MALDI MS/MS imaging mass spectrometry using continuous raster sampling. J Mass Spectrom. 2015;50:703–710. doi: 10.1002/jms.3579. [DOI] [PMC free article] [PubMed] [Google Scholar]
- 13.Spengler B, Hubert M. Scanning microprobe matrix-assisted laser desorption ionization (SMALDI) mass spectrometry: instrumentation for sub-micrometer resolved LDI and MALDI surface analysis. J Am Soc Mass Spectrom. 2002;13:735–748. doi: 10.1016/S1044-0305(02)00376-8. [DOI] [PubMed] [Google Scholar]
- 14.Spraggins JM, Caprioli RM. High-speed MALDI-TOF imaging mass spectrometry: rapid ion image acquisition and considerations for next generation instrumentation. J Am Soc Mass Spectrom. 2011;22:1022–1031. doi: 10.1007/s13361-011-0121-0. [DOI] [PMC free article] [PubMed] [Google Scholar]
- 15.Zavalin A, Yang J, Hayden K, Vestal M, Caprioli RM. Tissue protein imaging at 1 mum laser spot diameter for high spatial resolution and high imaging speed using transmission geometry MALDI TOF MS. Anal Bioanal Chem. 2015;407:2337–2342. doi: 10.1007/s00216-015-8532-6. [DOI] [PMC free article] [PubMed] [Google Scholar]
- 16.Hohndorf J, Haase A, Futterer A, Becker M, Holle A. 63rd Annual ASMS Conference on Mass Spectrometry and Allied Topics; St. Louis, MO. 2015. [Google Scholar]
- 17.Marshall AG, Hendrickson CL, Jackson GS. Fourier transform ion cyclotron resonance mass spectrometry: a primer. Mass Spectrom Rev. 1998;17:1–35. doi: 10.1002/(SICI)1098-2787(1998)17:1<1::AID-MAS1>3.0.CO;2-K. [DOI] [PubMed] [Google Scholar]
- 18.Zubarev RA, Makarov A. Orbitrap mass spectrometry. Anal Chem. 2013;85:5288–5296. doi: 10.1021/ac4001223. [DOI] [PubMed] [Google Scholar]
- 19.Makarov A. Electrostatic axially harmonic orbital trapping: a high-performance technique of mass analysis. Anal Chem. 2000;72:1156–1162. doi: 10.1021/ac991131p. [DOI] [PubMed] [Google Scholar]
- 20.Wang X, Han J, Pan J, Borchers CH. Comprehensive imaging of porcine adrenal gland lipids by MALDI-FTMS using quercetin as a matrix. Anal Chem. 2014;86:638–646. doi: 10.1021/ac404044k. [DOI] [PubMed] [Google Scholar]
- 21.Cornett DS, Frappier SL, Caprioli RM. MALDI-FTICR imaging mass spectrometry of drugs and metabolites in tissue. Anal Chem. 2008;80:5648–5653. doi: 10.1021/ac800617s. [DOI] [PMC free article] [PubMed] [Google Scholar]
- 22.Spraggins JM, Rizzo DG, Moore JL, Rose KL, et al. MALDI FTICR IMS of intact proteins: using mass accuracy to link protein images with proteomics data. J Am Soc Mass Spectrom. 2015;26:974–985. doi: 10.1007/s13361-015-1147-5. [DOI] [PMC free article] [PubMed] [Google Scholar]
- 23.Yang J, Caprioli RM. Matrix sublimation/recrystallization for imaging proteins by mass spectrometry at high spatial resolution. Anal Chem. 2011;83:5728–5734. doi: 10.1021/ac200998a. [DOI] [PMC free article] [PubMed] [Google Scholar]
- 24.Hankin JA, Barkley RM, Murphy RC. Sublimation as a method of matrix application for mass spectromet-ric imaging. J Am Soc Mass Spectrom. 2007;18:1646–1652. doi: 10.1016/j.jasms.2007.06.010. [DOI] [PMC free article] [PubMed] [Google Scholar]
- 25.Thomas A, Charbonneau JL, Fournaise E, Chaurand P. Sublimation of new matrix candidates for high spatial resolution imaging mass spectrometry of lipids: enhanced information in both positive and negative polarities after 1,5-diaminonapthalene deposition. Anal Chem. 2012;84:2048–2054. doi: 10.1021/ac2033547. [DOI] [PubMed] [Google Scholar]
- 26.McDonnell LA, Walch A, Stoeckli M, Corthals GL. MSiMass list: a public database of identifications for protein MALDI MS imaging. J Proteome Res. 2014;13:1138–1142. doi: 10.1021/pr400620y. [DOI] [PubMed] [Google Scholar]
- 27.Ye H, Mandal R, Catherman A, Thomas PM, et al. Top-down proteomics with mass spectrometry imaging: a pilot study towards discovery of biomarkers for neurodevelop-mental disorders. PLoS One. 2014;9:e92831. doi: 10.1371/journal.pone.0092831. [DOI] [PMC free article] [PubMed] [Google Scholar]
- 28.Johanson RA, Sarau HM, Foley JJ, Slemmon JR. Calmodulin-binding peptide PEP-19 modulates activation of calmodulin kinase II In situ. J Neurosci. 2000;20:2860–2866. doi: 10.1523/JNEUROSCI.20-08-02860.2000. [DOI] [PMC free article] [PubMed] [Google Scholar]
- 29.Berridge MJ, Bootman MD, Roderick HL. Calcium signalling: dynamics, homeostasis and remodelling. Nat Rev Mol Cell Biol. 2003;4:517–529. doi: 10.1038/nrm1155. [DOI] [PubMed] [Google Scholar]
- 30.Monteith GR, McAndrew D, Faddy HM, Roberts-Thomson SJ. Calcium and cancer: targeting Ca2+ transport. Nat Rev Cancer. 2007;7:519–530. doi: 10.1038/nrc2171. [DOI] [PubMed] [Google Scholar]
- 31.O'Sullivan BP, Freedman SD. Cystic fibrosis. Lancet. 2009;373:1891–1904. doi: 10.1016/S0140-6736(09)60327-5. [DOI] [PubMed] [Google Scholar]
- 32.Rowe SM, Miller S, Sorscher EJ. Cystic fibrosis. N Engl J Med. 2005;352:1992–2001. doi: 10.1056/NEJMra043184. [DOI] [PubMed] [Google Scholar]
- 33.Breen EC, Fu Z, Normand H. Calcyclin gene expression is increased by mechanical strain in fibroblasts and lung. Am J Respir Cell Mol Biol. 1999;21:746–752. doi: 10.1165/ajrcmb.21.6.3312. [DOI] [PubMed] [Google Scholar]
- 34.Breen EC, Tang K. Calcyclin (S100A6) regulates pulmonary fibroblast proliferation, morphology, and cytoskeletal organization in vitro. J Cell Biochem. 2003;88:848–854. doi: 10.1002/jcb.10398. [DOI] [PubMed] [Google Scholar]
- 35.van Heyningen V, Hayward C, Fletcher J, McAuley C. Tissue localization and chromosomal assignmentofaserum protein that tracks the cystic fibrosis gene. Nature. 1985;315:513–515. doi: 10.1038/315513a0. [DOI] [PubMed] [Google Scholar]
- 36.Wilkinson MM, Busuttil A, Hayward C, Brock DJ, et al. Expression pattern of two related cystic fibrosis-associated calcium-binding proteins in normal and abnormal tissues. J Cell Sci. 1988;91(Pt 2):221–230. doi: 10.1242/jcs.91.2.221. [DOI] [PubMed] [Google Scholar]
- 37.Corbin BD, Seeley EH, Raab A, Feldmann J, et al. Metal chelation and inhibition of bacterial growth in tissue abscesses. Science. 2008;319:962–965. doi: 10.1126/science.1152449. [DOI] [PubMed] [Google Scholar]
- 38.Damo SM, Kehl-Fie TE, Sugitani N, Holt ME, et al. Molecular basis for manganese sequestration by calprotectin and roles in the innate immune response to invading bacterial pathogens. Proc Natl Acad Sci USA. 2013;110:3841–3846. doi: 10.1073/pnas.1220341110. [DOI] [PMC free article] [PubMed] [Google Scholar]
- 39.Ericksen B, Wu Z, Lu W, Lehrer RI. Antibacterial activity and specificity of the six human {alpha}-defensins. Antimicrob Agents Chemother. 2005;49:269–275. doi: 10.1128/AAC.49.1.269-275.2005. [DOI] [PMC free article] [PubMed] [Google Scholar]
- 40.Siegel RL, Miller KD, Jemal A. Cancer statistics, 2015. CA Cancer J Clin. 2015;65:5–29. doi: 10.3322/caac.21254. [DOI] [PubMed] [Google Scholar]
- 41.Wu Y, Kwon YS, Labib M, Foran DJ, Singer EA. Magnetic resonance imaging as a biomarker for renal cell carcinoma. Dis Markers. 2015:648495. doi: 10.1155/2015/648495. [DOI] [PMC free article] [PubMed] [Google Scholar]
- 42.Hernandez-Yanez M, Heymach JV, Zurita AJ. Circulating biomarkers in advanced renal cell carcinoma: clinical applications. Curr Oncol Rep. 2012;14:221–229. doi: 10.1007/s11912-012-0231-2. [DOI] [PMC free article] [PubMed] [Google Scholar]
- 43.Krabbe LM, Bagrodia A, Margulis V, Wood CG. Surgical management of renal cell carcinoma. Seminars Inter-ventional Radiology. 2014;31:27–32. doi: 10.1055/s-0033-1363840. [DOI] [PMC free article] [PubMed] [Google Scholar]
- 44.Chow WH, Dong LM, Devesa SS. Epidemiology and risk factors for kidney cancer. Nature Reviews Urology. 2010;7:245–257. doi: 10.1038/nrurol.2010.46. [DOI] [PMC free article] [PubMed] [Google Scholar]
- 45.Oppenheimer SR, Mi D, Sanders ME, Caprioli RM. Molecular analysis of tumor margins by MALDI mass spectrometry in renal carcinoma. J Proteome Res. 2010;9:2182–2190. doi: 10.1021/pr900936z. [DOI] [PMC free article] [PubMed] [Google Scholar]
- 46.Roesch-Ely M, Nees M, Karsai S, Ruess A, et al. Proteomic analysis reveals successive aberrations in protein expression from healthy mucosa to invasive head and neck cancer. Oncogene. 2007;26:54–64. doi: 10.1038/sj.onc.1209770. [DOI] [PubMed] [Google Scholar]
- 47.Hall AK. Differential expression of thymosin genes in human tumors and in the developing human kidney. Int J Cancer. 1991;48:672–677. doi: 10.1002/ijc.2910480507. [DOI] [PubMed] [Google Scholar]
- 48.Hardesty WM, Caprioli RM. In situ molecular imaging of proteins in tissues using mass spectrometry. Anal Bioanal Chem. 2008;391:899–903. doi: 10.1007/s00216-008-1972-5. [DOI] [PMC free article] [PubMed] [Google Scholar]
- 49.Ramakrishnan S, Ellis L, Pili R. Histone modifications: implications in renal cell carcinoma. Epigenomics. 2013;5:453–462. doi: 10.2217/epi.13.40. [DOI] [PMC free article] [PubMed] [Google Scholar]