

Abstract
Neuropeptides are an important class of neurochemicals; however, measuring their concentration in vivo by using microdialysis sampling is challenging due to their low concentration and the small samples generated. Capillary liquid chromatography with mass spectrometry (cLC-MS) can yield attomole limits of detection (LOD); however, low recovery and loss of sample to adsorptive surfaces can still hinder detection of neuropeptides. We have evaluated recovery during sampling and transfer to the cLC column for a selection of 10 neuropeptides. Adding acetonitrile to sample eliminated carry-over and improved LOD by 1.4 to 60 fold. The amount acetonitrile required was found to have an optimal value that correlated with peptide molecular weight and retention time on a reversed phase LC column. Treating AN69 dialysis membrane, which bears negative charge due to incorporated sulfonate groups, with polyethyleneimine (PEI) improved recovery by 1.2 to 80 fold. The effect appeared to be due to reducing electrostatic interaction between peptides and the microdialysis probe since modification increased recovery only for peptides that carried net positive charge. The combined effects improved LOD of the entire method by 1.3 to 800 fold for the different peptides. We conclude that the multifunctional nature of peptides requires combined strategies to prevent adsorption and yield best possible detection. The method was demonstrated by determining orexin A, orexin B, and a novel proopiomelanocortin (POMC) fragment that has a sequence identical to mouse β-endorphin in the rat arcuate nucleus.
Introduction
Neuropeptides are an important class of signaling molecules in the brain that are implicated in nearly every brain function. Regulation of neuropeptides can be studied by measuring tissue content of peptide or mRNA; however, better understanding of their control and role can be achieved by monitoring their extracellular concentration dynamics in vivo. Such measurements allow for direct correlation between extracellular concentration and behavior, drugs, disease state and other modulation processes1–5. A potentially useful technique for such measurements is microdialysis sampling. Although microdialysis is routinely used for small molecule neurotransmitters, its use for sampling peptides remains relatively rare and challenging due to low extracellular concentration of peptides (1–100 pM) and small samples generated (1–10 μL). Analytical challenges are exacerbated by low recovery of neuropeptides through microdialysis probes and losses due to adsorption. In this report we describe methods for improving the sampling recovery and detection sensitivity of neuropeptides for in vivo analysis.
Levels of neuropeptides have usually been determined in dialysate by immunoassays6–9; however, capillary liquid chromatography coupled to mass spectrometry (cLC-MS)10–20 is emerging as a powerful alternative. With this method, microliter samples can be concentrated onto a nanoliter volume column to enable detection of peptides at low picomolar concentration (attomole quantity). Unlike immunoassays, cLC-MS allows specific sequences to be detected, which is important since many subtle variations of peptides exist due to post-translational processing, and is well-suited to detecting multiple target peptides in one sample. Despite its potential for high sensitivity and specificity, only 10 of the over 200 known mammalian neuropeptides have been quantitatively measured at their endogenous concentration in vivo using this technique10–18. Expanding the repertoire of neuropeptides that can be detected requires considering not only the assay method, but also improving recovery during in vivo sampling and transfer to the cLC column.
Work on peptide drugs and tryptic peptides for shotgun proteomics applications has shown that addition of organic solvent, such as acetonitrile21, ethanol22, or dimethylsulfonate (DMSO)23 to samples improves repeatability and sensitivity of LC assays. This effect is attributed to preventing adsorptive loss by hydrophobic interactions with surfaces, e.g. of sample vials. This concept was recently extended to 3 neuropeptides (neurotensin, neuromedin N, and neuromedin B)18,24. Although promising, it remains questionable how widely applicable this approach is and whether organic additive to dialysate samples can provide enough improvement for in vivo detection of larger neuropeptides such as β-endorphin and orexins, where poor LC-MS sensitivity may have more complicated origin.
Another challenge for in vivo neuropeptide monitoring is low recovery of peptides by microdialysis probes. It is not uncommon for relative recovery (concentration in dialysate divided by concentration in sample) to be less than 1.5%8,25,26. Methods explored to improve recovery include using high molecular weight cut-off (MWCO) membranes, blocking protein in perfusion media, push-pull microdialysis, and affinity-enhanced microdialysis27–30. While potentially effective, these methods do not prevent adsorption to the membrane itself. Microdialysis catheter modification has been investigated for reducing adsorption loss. For example, a triblock copolymer Pluronic® F-127 was coated onto hydrophobic microdialysis membrane and tubing to reduce adsorption when sampling protein from human cerebrospinal fluid in vitro31,32, and siliconized tubing was applied in orexin A in vivo microdiaysis to prevent peptide loss to plastic tubing26. These methods focus on reducing adsorption loss to hydrophobic membrane and tubing surfaces (i.e., similar to the effect of using organic solvent in samples to prevent adsorption). Studies of reducing adsorption to improve recovery from already hydrophilic membranes, the more common material for microdialysis, have not been reported.
We have evaluated recovery during sampling and transfer to the cLC column for a selection of 10 neuropeptides. Adding acetonitrile to dialysate sample was found to eliminate carry-over and improve LOD by 1.4 to 60 fold. The amount of acetonitrile added that yielded the best signal was found to have an optimal value that correlated with peptide molecular weight (MW) and retention time on a reversed phase LC column. Treating the dialysis membrane and fused silica tubing with polyethyleneimine (PEI) improved recovery by 1.2 to 80 fold. The effect appeared to be due to reducing electrostatic interaction between peptides and the microdialysis probe since modification increased recovery only for peptides that carried net positive charge. The combined effects yield substantial improvements for some peptides. We conclude that the multifunctional nature of peptides requires combined strategies to prevent adsorption and yield best possible results.
As a demonstration of utility of these approaches, we show that the method allows recovery and detection of intact orexin A and orexin B from rat arcuate nucleus in vivo. Orexins are neuropeptides that regulate sleep-wake cycle and feeding behavior33,34. Monitoring their concentration in vivo may provide useful information on their in vivo processing and function. From the same samples we also detected a novel fragment of rat pro-opiomelanocortin (POMC) that has a sequence identical to mouse β-endorphin. This result demonstrates the power of using sequence specific detection.
MATERIALS AND METHODS
Chemicals and materials
Orexin A, orexin B, β-endorphin (mouse, rat), cholecystokinin-4 (CCK-4), galanin (Gal), and orphanin-FQ (OFQ) were from Phoenix pharmaceuticals (Burlingame, CA). α-Melanocyte stimulating hormone (α-MSH), deacetylated α-MSH and dynorphin A1–17 (DynA1–17) were from American Peptide Company (Sunnyvale, CA). HPLC grade solvent, including water, methanol (MeOH) and acetonitrile were purchased from Honeywell (Muskegon, MI). LC-MS grade formic acid (FA), glass autosampler vials and glass inserts were from Fisher Scientific (Waltham, MA). PEI (average Mn = 1800 by gel permeation chromatography, average MW = 2000 by light scattering, 50% by weight in H2O) and substance P (Sub P) were from Sigma-Aldrich (St. Louis, MO). A Ringer’s solution consisting of 148 mM NaCl, 2.7 mM KCl, 1.2 mM CaCl2 and 0.85 mM MgCl2 was used as microdialysis perfusion media. High K+ Ringer’s solution was the same except that the KCl concentration was 100 mM and NaCl concentration was 51 mM. Fused silica capillaries were purchased from Molex (Phoenix, AZ) and 5 μm Alltima™ C18 packing was from Grace Davison (Waltham, MA).
Microdialysis probe modification and in vitro recovery determination
CMA 12 probe with 4 mm polyarylethersulphone (PAES) membrane for in vitro recovery measurement was from CMA Microdialysis (North Chelmsford, MA). Concentric AN69 microdialysis probes for both in vitro and in vivo studies were constructed in-house using AN69 dialysis membrane (Hospal, Bologna, Italy) with 300 μm outer diameter (O.D.) by 2 mm active membrane length. The probe inlet was connected to a section of 127 μm inner diameter (I.D.) fluorinated ethylene propylene tubing with 10 μL dead volume (Zeus, Orangeburg, SC), and the outlet to a 100 μm I.D./360 μm O.D. fused silica capillary. PEI modification of the probe was achieved by immersing the probe into a stirred vial containing 5% PEI and pumping the same PEI solution through the probe and tubing at 0.5 μL/min for 12 h. After modification, the catheter was washed by Ringer’s solution at 1 μL/min for 8 h to remove unadsorbed PEI. Immediately after treatment probes were used for in vitro sampling or in vivo implantation.
To measure in vitro recovery, probes were perfused at 0.5 μL/min and placed in a stirred vial containing 1 nM peptide in Ringer’s solution. Fractions of 10 μL volume were collected into vials pre-loaded with the proper volume of acetonitrile and FA to result in optimal acetonitrile percentage and 0.5% FA in the fraction.
In vivo microdialysis sampling
Adult Sprague-Dawley rats (Harlan Laboratories, Inc.) were used for all experiments. Rats were housed in a temperature and humidity controlled room with 12 h light/dark cycles with access to food and water ad libitum. Animals were treated as approved by the University of Michigan Unit for Laboratory Animal Medicine (ULAM) and in accordance with the National Institute of Health (NIH) Guidelines for the Care and Use of Laboratory Animals. All animal experiments were conducted within the guidelines of Animal Research Reporting in vivo Experiments (ARRIVE). Surgical procedures for inserting probes were similar to previously described35. Briefly, rats were anesthetized using an isoflurane vaporizer and placed in a Model 963 stereotaxic frame (David Kopf Instruments, Tujunga, CA, USA). AN69 probes, either treated or untreated by PEI, were inserted into the arcuate nucleus using the following coordinates from bregma and top of skull36: AP −2.2 mm, ML ±1.0 mm, DV −10.0 mm inserted at 3.5° angle. The probes were secured with skull screws and acrylic dental cement. Following surgery, rats were allowed to recover for 24 h with free access to food and water. Prior to measurements, microdialysis probes were flushed at 2 μL/min with Ringer’s solution for 1 h using a Fusion 400 syringe pump (Chemyx, Stafford, TX, USA). Perfusion flow rate was then reduced to 0.5 μL/min and probes flushed for an additional 1.5 h prior to beginning fraction collection. Microdialysis fractions were collected at 20 min intervals. When experiments were completed, animals were euthanized and the brains were removed to confirm probe placement by histology. Dialysis samples were stored for up to 3 days in −80 °C freezer. Pilot studies showed that tested peptides were stable for this period (Supporting Information Figure S-1).
Capillary LC-MS
Column and emitter tip preparation are described in detail elsewhere15. Briefly, an 8 cm length of 75/360 μm I.D./O.D. fused silica capillary was slurry-packed with a 5 mg/mL 5μm Alltima™ C18 slurry to a bed length of 4 cm. The outlet was connected to a fused silica electrospray emitter tip through a Teflon tubing connector. The column assembly was connected to a dual-valve, dual-pump LC system depicted in Figure 1. The system contained two 6-port Cheminert valves (Valco, Houston, TX), a high pressure syringe pump (Teledyne Isco, Lincoln, NE), an Agilent 1100 HPLC pump (Santa Clara, CA), and a WPS-3000TPL autosampler (Dionex, Sunnyvale, CA). All tubing connections, including sample loop and sample needle, were made from 360 μm O.D. fused silica capillaries.
Figure 1.
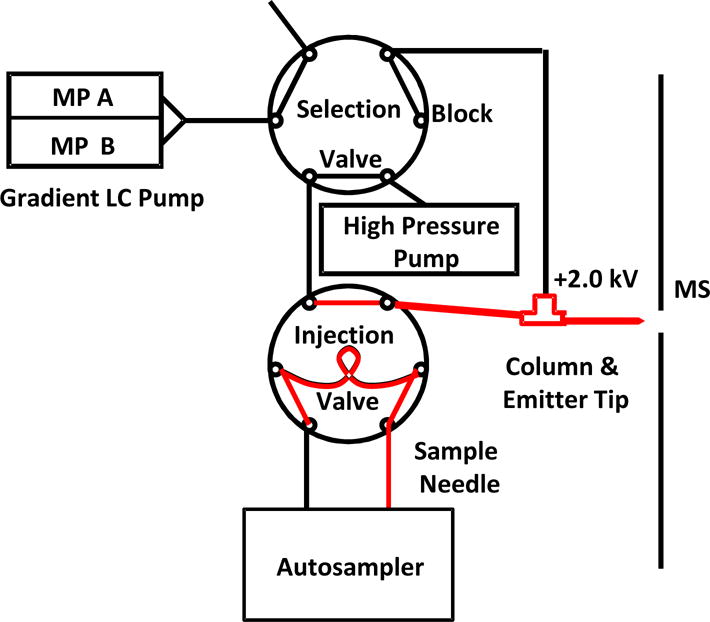
Plumbing diagram for cLC system used in this work. The autosampler loads sample. A selection valve is used to switch between a high pressure pump for rapid sample loading and column rinsing and a gradient LC pump for elution. Electrospray voltage applied at a tee at column inlet. The flow path of sample is highlighted in red to illustrate the surfaces that contact peptide during loading and injection. Sample needle, sample loop and connection tubing between the injection valve and column were all made from fused silica capillaries.
Operation of the system has been described before13. A selection valve switched a high pressure pump or the gradient LC pump flow into the injection valve (Figure 1). The auto-sampler (equipped with 16 μL sample loop) was used to load 8 μL of sample into the sample loop. The high pressure pump, operated at 5 μL/min (~3500 psi), was in-line for 5 min to inject the sample and then rinse the column with 0.1% FA. The selection valve was then switched so that the HPLC pump was in-line to elute the peptides with the following mobile phase gradient: 0.0–1.5 min: 5%–95% mobile phase B (MPB), 1.5–7.0 min: 95% MPB, 7.0–7.1 min: 95%–5% MPB, 7.1–10.0 min: 5% MPB, where mobile phase A was 0.1% FA in water and MPB was 0.1% FA in MeOH. Elution flow rate was 150 nL/min. After injection the sample needle was washed with 100 μL wash solvent containing 50% MeOH, 50% water and 0.2% FA to prevent carry-over.
The capillary system was interfaced to a linear ion trap (LTQ XL, Thermo Scientific) mass spectrometer operating at positive ion mode. Peptides were detected either in MS2 or MS3 mode by collision induced dissociation depending on the sensitivity of each mode for a given peptide (see Table S-1 in Supporting Information for MS transitions used). Detection was achieved with the following parameters: spray voltage = 2.0 kV, capillary temperature = 150 °C, automatic gain control (AGC) on, q = 0.25, isolation width = 3 m/z, activation time = 0.25 ms, number of micro scans = 1. To maintain ion optics for best peptide sensitivity, the linear ion trap was tuned bimonthly by infusing 2 μM orexin A solution dissolved in 50: 50 MeOH: water, 0.2% FA, and monitoring daughter ion at m/z = 854.
RESULTS AND DISCUSSION
Addition of organic additive to reduce post collection, pre-column peptide loss
Our objective was to evaluate an overall sampling and cLC-MS method for a panel of 10 neuropeptides (Table 1 and Table 2). These peptides were selected because of their potential role in brain circuits that control feeding behavior. Initial cLC-MS analysis revealed an over 100-fold range in LOD, from 0.2 to 30 pM, for injections of 8 μL of peptide dissolved in Ringer’s solution with 0.5% FA (Table 1). Subsequent study revealed that many of the peptides with higher LODs also generated significant carry-over, i.e. signals for peptide during injections of blank solutions after a sample injection (Figure S-2, Supporting Information). These observations suggested that adsorption to surfaces as peptides were transported from the glass autosampler vial to column were causing both effects.
Table 1.
LOD and Calibration Curve Slope for Injections with Totally Aqueous Standard or Standard Spiked With Acetonitrile to Optimal Concentration.
| peptide | optimal acetonitrile % | LOD (pM) with 0 % acetonitrile | LOD (pM) with optimal acetonitrile % | slope (pM−1) with 0 % acetonitrile | slope (pM−1) with optimal acetonitrile % |
|---|---|---|---|---|---|
| α-MSH | 15 | 2 | 0.8 | 5.2×10² | 1.2×10³ |
| β-endorphin, mouse | 25 | 4 | 0.6 | 3.5×10² | 4.2×10³ |
| CCK-4 | 10 | 1 | 0.7 | 56 | 1.5×10² |
| Deacetylated α-MSH | 10 | 0.2 | 0.1 | 4.6×10² | 2.4×10³ |
| DynA1–17 | 15 | 20 | 2 | 54 | 5.6×10² |
| Gal | 20 | 5 | 1 | 2.5×10² | 8.8×10² |
| OFQ | 10 | 1 | 0.3 | 7.3×10² | 3.8×10³ |
| orexin A | 25 | 30 | 0.5 | 98 | 1.9×10³ |
| orexin B | 25 | 5 | 0.6 | 1.3×10² | 3.0×10³ |
| Sub P | 10 | 0.5 | 0.1 | 2.4×10² | 8.0×10² |
LOD was calculated by using equations: LoB = meanblank + 1.645(SDblank), LOD = LoB + 1.645(SD low concentration sample), LoB = limit of blank, SD = standard deviation. To confirm peptide detection at LOD, peptide calibration curve was made by triplicate injections of standards whose lowest concentration was close to the calculated LOD.
Table 2. In Vitro Recovery Value for Each Peptide, Recovery Improvement and Overall Improvement.
Net charge was estimated using equation , where N represents number of residue/termini and i and j represent basic or acidic residue/termini, respectively45.
| peptide | MW | net charge | recovery-untreated probe (%) | recovery-PEI treated probe (%) | recovery improvement (fold) | LOD improvement (fold) | combined improvement (fold) |
|---|---|---|---|---|---|---|---|
| α-MSH | 1665 | 1.1 | 23 ± 3 | 27 ± 4 | 1.2 | 2 | 2.4 |
| β-endporpin, mouse | 3436 | 4 | 0.3 ± 0.3 | 11 ± 4 | 37 | 6.7 | 248 |
| CCK-4 | 597 | 0 | 49 ± 8 | 46 ± 4 | 0.94 | 1.4 | 1.3 |
| Deacetylated α-MSH | 1623 | 2.1 | 0.7 ± 0.04 | 18 ± 4 | 26 | 2 | 52 |
| DynA1–17 | 2148 | 4 | 0.1 ± 0.04 | 8 ± 4 | 80 | 10 | 800 |
| Gal | 3165 | 1.2 | 0.7 ± 0.4 | 8 ± 2 | 11 | 5 | 55 |
| OFQ | 1809 | 4 | 0.3 ± 0.2 | 16 ± 2 | 53 | 3.3 | 175 |
| orexin A | 3561 | 1 | 0.08 ± 0.05 | 0.2 ± 0.03 | 2.5 | 60 | 150 |
| orexin B | 2936 | 4 | 0.5 ± 0.3 | 10 ± 3 | 20 | 8.3 | 166 |
| Sub P | 1348 | 3 | 12 ± 5 | 33 ± 6 | 2.8 | 5 | 14 |
Organic modifier added to samples had previously been shown to improve sensitivity for peptides23,24; therefore, we investigated the effect of acetonitrile added at different concentrations (5–30%) on detection of our panel of neuropeptides. As shown in Figure 2 A–D, adding acetonitrile to samples increased signal for all peptides tested; but, adding too much decreased signal so that each peptide had an optimal acetonitrile percentage. Optimal acetonitrile concentrations were from 10 to 25% (Figure 2 A–D). The optimal acetonitrile concentration correlated with both MW and retention time (Figure 2 E and F). These results can be understood by considering that increasing organic modifier decreases the tendency of a peptide to interact with solid surfaces by hydrophobic interactions during the injection process; however, adding organic modifier also increases the elution strength of the sample on the reversed phase LC columns. This in turn reduces the ability of the column to capture and stack peptide during large volume injections. Therefore peptides have an optimal concentration that increases with potential for hydrophobic interactions, as measured by retention time. Because increasing molar volume increases dispersion interactions, this effect also correlates with MW.
Figure 2.
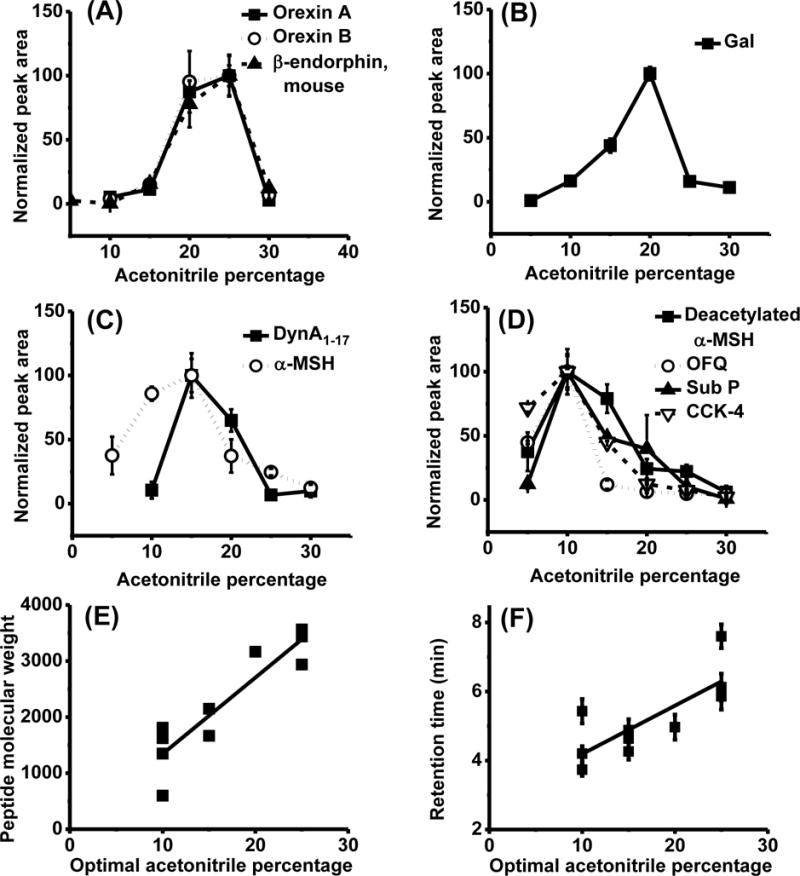
Optimal acetonitrile concentration for each individual peptide and its correlation to peptide properties. (A, B, C and D) Peptide signal, measured as peak area from reconstructed ion chromatograms (RICs) normalized to the highest for each peptide (n = 3), as a function of acetonitrile volumetric percentage in sample. 8 μL of peptides were injected at 100 pM. Balance of sample solution was Ringer’s solution and FA was added to a final concentration of 0.5%. Peptides are plotted in groups by optimal acetonitrile concentration for clarity. (E) Correlation of peptide molecular weight with optimal acetonitrile percentage of peptides. R2 = 0.77 for a linear fit. (F) Correlation of peptide retention time on a reverse phase column with the optimal acetonitrile percentage of peptides. R2 = 0.56 for a linear fit. To correlate retention time with optimal acetonitrile percentage, acetonitrile with 0.1% FA was used as MPB and a shallower gradient than the detection gradient was used to better separate peptides: 0–1 min: 2%–20% MPB, 1–9 min: 20–30% MPB, 9–10 min: 30–90% MPB, 10–12 min: 90% MPB, 12–12.1 min: 90–0% MPB, 12.1–15 min: 0% MPB. Data is average from 9 replicate injections on three cLC columns. Error bars = ± 1 standard deviation (SD) for all graphs.
Adding organic solvent improved figures of merit for the cLC-MS assay. Table 1 shows that adding the optimal amount of organic solvent to the sample increased peptide detection sensitivity (as indicated by calibration curve slope) up to 23 fold, and decreased LOD by 1.4 to 60 fold. The largest improvement was for the biggest peptides such as orexins and mouse β-endorphin, which also had the worst LODs without added organic and are more likely to be lost due to adsorption as indicated by their higher optimal acetonitrile percentage. This effect also tended to normalize the LODs giving a narrower range (0.1–2 pM) than when injecting from Ringer’s solution with 0.5% FA (0.2–30 pM). Figure 1 and Table 2 shows that addition of 25% acetonitrile to samples increased the linearity of calibration curve (represented by R2) from ~0.8 to above 0.98 for orexins and β-endorphin. Peptide signal reproducibility was also improved as indicated by the relative standard deviation (RSD) of the highest concentration injected. Without acetonitrile, the peak area RSD was as large as 70% at 200 pM for these three peptides, while injecting peptides with 25% acetonitrile lowered the RSD down to 3% and 7% at 20 pM for β-endorphin and orexin A, and 16% at 10 pM for orexin B, respectively.
Injection carry-over was reduced from 20–50% to 1–2% when adding acetonitrile to 25% for orexins. Without acetonitrile addition, orexin signal could still be observed after 3–4 blank injections (Figure S-2, Supporting Information), indicating that LC and tubing surfaces contribute significant to sample loss, in agreement with a previous peptide carryover prevention study37. It is interesting that adding organic solvent prevented adsorption even though nearly all the surfaces between vial and column are fused silica which is nominally a hydrophilic surface (see red fluid path in Figure 1). We suspect that most of the adsorption occurs in the injection valve which has stainless steel and polymeric components, both of which are more likely to participate in hydrophobic interactions more than the fused silica tubing.
Modifying microdialysis probe to increase peptide in vitro recovery
We next evaluated in vitro relative recovery using both in-house constructed microdialysis probes with 2 mm long AN69 membrane and CMA 12 probes with 4 mm long PAES membrane (MWCO = 20 kDa). Relative recovery was extremely low with both probes for most of the peptides (Table 2 and Figure 3). AN69 is a copolymer of acrylonitrile and sodium methallylsulfonate yielding a hydrophilic membrane with large MWCO (80 kDa)38,39; therefore, poor peptide recovery is unlikely to be caused by adsorption to the membrane through hydrophobic interaction or inadequate pore size. AN69 membrane carries negative charge owing to embedded sulfonate groups, while most peptides selected for this study have positive charge at pH 7.4 (Table 2) suggesting the possibility that electrostatic interaction affected recovery.
Figure 3.
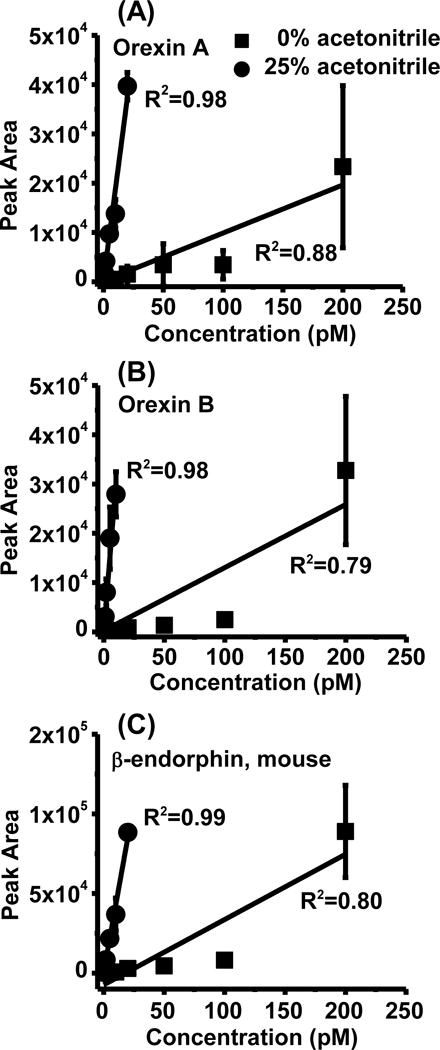
Representative calibration curve of three peptides analyzed in vivo. Standards were prepared with 0 or 25 % acetonitrile added with balance of solvent being Ringer’s solution (0.5% FA). Each data point is the average of 3 replicate injections and error bar represents ± 1 SD.
It has previously been reported that treating AN69 membranes with the polycation PEI can neutralized the negative charge of membrane40,41. Such membranes, sold commercially as AN69ST, have been used in hemodialysis to reduce coagulation. We therefore modified the probes with PEI to determine the effect on recovery of these peptides. The probes were modified by pumping PEI solution through them which also treated the connected fused silica tubing, which is also negatively charged and therefore a possible source of cationic peptide adsorption. As shown in Figure 3 and Table 2, PEI-treatment resulted in a statistically significant improvement in recovery for 7 peptides: rat β-endorphin, mouse β-endorphin, orexin B, Gal, Sub P, deacetylated α-MSH and OFQ. Another 3 peptides tended towards improved recovery. The improvements were dramatic in some cases, from 1.2 to 80-fold. Peptides with low initial recovery and 3 or more positive charges showed the most recovery improvement with PEI treatment. CCK-4 was the only peptide which showed no improvement on PEI treated probes. It was also the only peptide that has zero net charge at pH 7.4, while all other peptides carry positive charge.
Sample losses in the probe and in the LC tubing are independent; therefore, improvements in both have a synergistic effect on the overall method. As shown in Table 2, we estimate that the combined effect improved LOD of the total method (sampling and assay) by as much as 800-fold Because peptides are multifunctional, a wide range of effects were seen. Detection of hydrophobic peptides were improved by adding organic to the sample (e.g., orexin A), highly charged peptides by reversing charge on the membrane (OFQ), and peptides that had both properties were improved by both effects (e.g. DynA1–17). Relatively hydrophilic peptides without net charge (CCK) were only marginally affected by these treatments.
Detecting neuropeptide using unmodified and PEI-modified AN69 membrane probe
To test this method for in vivo study, orexin A, orexin B, and β-endorphin were monitored from rat arcuate nucleus. Orexins regulate wakefulness and feeding behavior33. Orexin B has not been measured in vivo, while orexin A has been measured in a few cases9,26,42; however, quantification has only been achieved with immunoassays which lack sequence specificity. Therefore it remains unclear whether intact orexin sequence can be detected in vivo. β-endorphin was also previously reported to be detected from this brain region using microdialysis with ELISA43.
A pilot study that compared analysis of in vivo dialysate from unmodified AN69 probe (n = 2) and PEI-modified AN69 probes (n = 2) revealed important results. PEI-modified probe yielded baseline signal for orexin B, while its signal from unmodified probe was 13 times lower (Figure 5A). Signal intensity for orexin A was more comparable between unmodified probe and modified probe (Figure 5A). These findings are in agreement with our in vitro recovery comparison that PEI treatment significantly enhanced recovery for orexin B, but not for orexin A. Rat β-endorphin was not detected using either probe despite good in vitro recovery of the probe (12 ± 4%) and low LOD (0.8 pM). Interestingly, the PEI-modified probe, but not the unmodified probe, also allowed recovery and detection of a peptide that had identical MS2 transition to mouse β-endorphin (Figure 5). This last result also agrees with in vitro probe recovery data that mouse β-endorphin had 32 fold higher recovery on PEI-modified probes than on unmodified probes. Therefore, the enhancement of recovery seen in vitro with PEI-modification was confirmed in the more complex in vivo environment.
Figure 5.
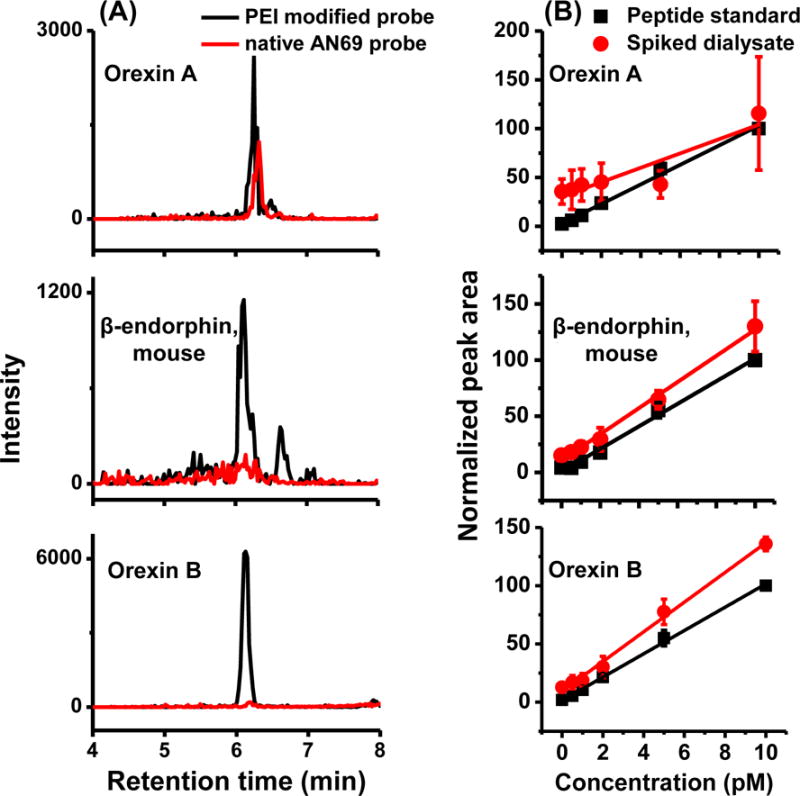
(A) Overlaid RIC for orexin A, β-endorphin and orexin B from in vivo dialysate collected using either PEI modified AN69 membrane or unmodified AN69 membrane. two rats were used for each type of probe as pilot study. (B) Comparison between standard addition curve and standard calibration curve using dialysate collected by PEI modified probes. Standard addition curve points are average of three rats on three different days and error bar is + 1 SEM. 60 μL dialysate was collected from each rat and spiked with proper volume of acetonitrile and FA to produce 25% acetonitrile and 0.5% FA in final sample, aliquoted to 6 vials and spiked with peptide standard to a final concentration of 0, 0.5, 1, 2, 5, 10 pM of all three peptides. The peptide signal from spiked dialysate was normalized to the peptide signal from highest standard (10 pM) on that day.
As indicated above, mouse but not rat β-endorphin was detected in dialysates from rats. Mouse and rat β-endorphin have a single amino acid variation (Ala26 → Val26). We investigated the potential origin of the mouse β-endorphin sequence in rat brain by searching its sequence against rodent data base in Uniprot, and found this sequence in an unreviewed rat POMC (entry: Q8K422), which had experimental evidence of existence at transcript level. Our result suggests that this peptide is indeed expressed in vivo. The discovery of this sequence in rat brain, but not the expected rat β-endorphin sequence, shows the advantage of sequence specificity afforded by MS2 as this difference might not be able to be distinguished using immunoassays. Indeed, previous studies using immunoassay have reported detecting β-endorphin43; however, our results suggest that this may have been a different peptide.
In vivo neuropeptide monitoring in rat arcuate nucleus
The validity of external calibration was examined for determining dialysate concentrations by comparing signals from dialysate spiked with 0–10 pM peptides to that of a standard calibration curve across the same range (Figure 5B). Mouse β-endorphin and orexin B showed similar responses across the entire concentration range, just offset by endogenous level. This result suggests that matrix effect was negligible and external calibration could be used for quantifying these two peptides. For orexin A, however, the standard addition curve had flatter slope compared to standard curve, indicating matrix effect suppressed orexin A signal at higher concentration (Figure 5 B). These conclusions were confirmed by comparing the concentration in dialysate by external calibration and standard addition. For orexin A, orexin B, and mouse β-endorphin were, respectively, 4.0 ± 1.0 pM, 1.5 ± 0.6 pM, and 2.4 ± 0.5 pM by external calibration and 10.1 ± 4.5 pM, 1.4 ± 0.1 pM, and 2.1 ± 0.5 pM by standard addition (n = 3). This result suggests quantification can potentially be improved by including isotopically labeled orexin A as an internal standard. We used the PEI-modified probes to monitor these three neuropeptides during perfusion of elevated high K+ concentration through the probe (Figure 6A). Stimulation with 100 mM K+ caused a substantial increase in orexin B (over 3 fold) but minor increases in orexin A and mouse β-endorphin (Figure 6A, Table 3) that appeared to only slowly dissipate after K+ was returned to physiological levels. The modest and relatively slow changes in orexin A and β-endorphin may reflect effects of post-secretion processing and metabolism on these peptides. In vitro experiments where the concentration was rapidly changed external to the probe also had fairly slow equilibration times (Figure 6B) suggesting that the temporal responses are limited by the system. This slow response could arise from slow diffusion (to the probe and through the membrane) and weak interactions with surfaces during mass transport.
Figure 6.
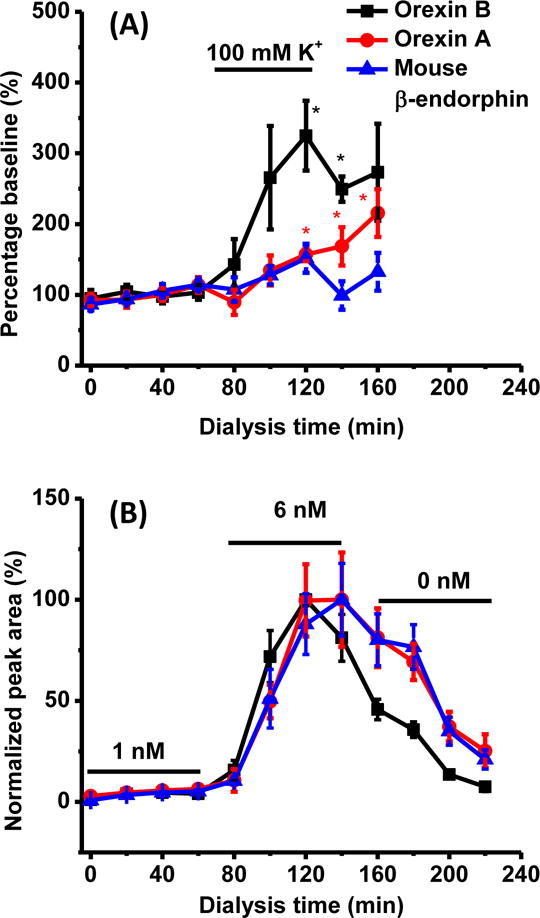
(A) Response to K+ stimulation for orexin A, β-endorphin and orexin B from in vivo dialysate collected using PEI modified probe. Points are mean for 6 animals. All data are normalized to the average of the first 4 fractions, which are considered 100% of baseline. * indicates statistically different from baseline by t test with p < 0.05. Dialysate were collected into autosampler vials spiked with proper volume of acetonitrile and FA to produce final concentration of 25% acetonitrile and 0.5% FA. (B) In vitro probe response to concentration change for same peptides. Probe was sequentially placed in stirred vials containing 1 nM, 6 nM and 0 nM peptide standard. Data points are mean for experiments with 4 different probes. All error bars are ± 1 SEM. Bars indicating stimulation and concentration application are corrected for dead volume of the system.
Table 3. Basal concentration of peptide orexins and mouse β-endorphin (n=6).
Basal dialysate concentration was calculated by external calibration and corrected for dilution of dialysate by adding acetonitrile and FA. Basal extracellular concentration was estimated according to average in vitro recovery.
| peptide | Basal ± SEM concentration in dialysate (pM) | Basal extracellular ± SEM concentration (pM) |
|---|---|---|
| Orexin A | 3.0±0.7 | 1500±350 |
| Orexin B | 2.3±0.6 | 23±6 |
| β-endorphin, mouse | 2.5±0.3 | 23±3 |
CONCLUSION
Neuropeptide detection in vivo is complicated by low concentrations that are further reduced by adsorptive loss to surfaces. Peptides are multifunctional with non-polar, polar, and charged functional groups allowing them to interact strongly with a variety of surfaces. Accounting for all possible interactions during sampling and transport is an effective strategy for improving detectability of these challenging molecules. It is apparent from this and other studies21,23,24 that hydrophobic interactions with surfaces commonly used for LC sample preparation result in significant sample loss resulting in carry-over, low sensitivity, and mediocre reproducibility. Addition of organic solvent at proper concentrations is a simple way to ameliorate this problem. Recovery through microdialysis catheters may be limited by other interactions if the probes are already polar. For the AN69 membrane, electrostatic interaction was a factor. This could be reduced by reversing the charge on the membrane which greatly improved recovery for cationic peptides. Importantly, we demonstrated that this treatment improved recovery in vivo as well (Figure 5A). The combined effects improved recovery by over 100 fold in some cases.
Presumably the PEI treatment would lower recovery for negatively charged peptides indicating the difficulty of analyzing peptides with a wide variety of properties. We observed low recovery on PAES with 20 kDa MWCO, a moderately hydrophilic membrane44 with sufficient MWCO for small peptides. We did not further explore this effect so it is difficult to speculate on the source of the low recovery.
The combined methods allowed the first detection of orexin B and sequence specific detection of orexin A in vivo. We also were able to identify a novel rat POMC peptide that has sequence identical to mouse β-endorphin. This method can be used to help elucidate the roles of these neuropeptides. Extension of the concept of addressing all surfaces that peptides contact will likely yield improved detection of many other neuropeptides.
Supplementary Material
Figure 4.
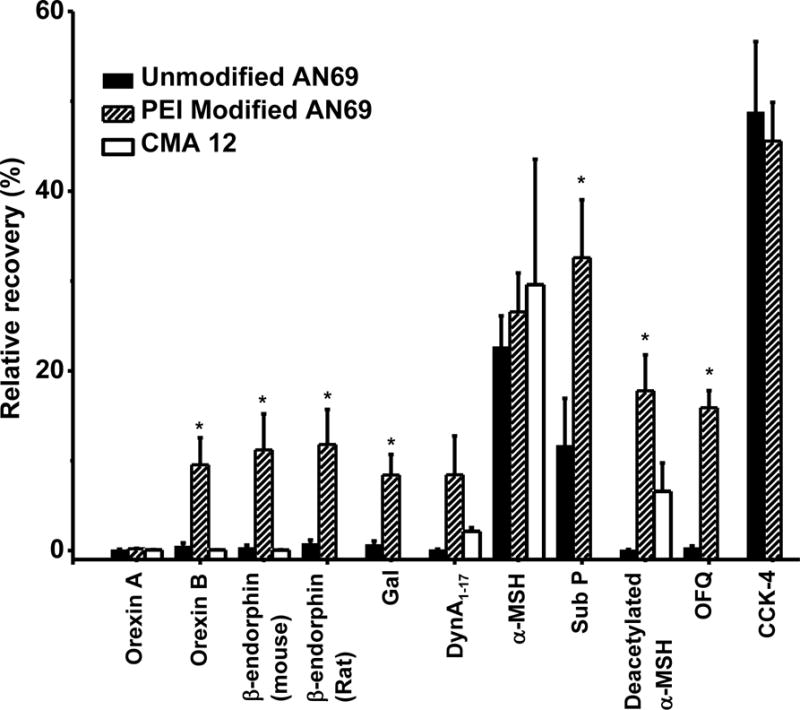
In vitro relative recovery of peptides from probes constructed from AN69 membrane (n = 4), AN69 membrane treated with PEI (n = 4), and CMA 12 probe that uses PAES membrane (n = 3). PEI modification significantly increased recovery for orexin B, mouse β-endorphin, rat β-endorphin, Gal, Sub P, Deacetylated α-MSH and OFQ (* paired t-test, p < 0.05). CMA probe was only tested for orexins, mouse β-endorphin, α-MSHs and DynA1-17. Error bar represents standard error of mean (SEM).
Acknowledgments
This work was supported by NIH R37 EB003320.
Literature Cited
- 1.DiFeliceantonio AG, Mabrouk OS, Kennedy RT, Berridge KC. Curr Biol. 2012;22:1918–1924. doi: 10.1016/j.cub.2012.08.014. [DOI] [PMC free article] [PubMed] [Google Scholar]
- 2.Geracioti TD, Carpenter LL, Owens MJ, Baker DG, Ekhator NN, Horn PS, Strawn JR, Sanacora G, Kinkead B, Price LH, Nemeroff CB. Am J Psychiat. 2006;163:637–643. doi: 10.1176/ajp.2006.163.4.637. [DOI] [PubMed] [Google Scholar]
- 3.Hanson GR, Bush L, Keefe KA, Alburges ME. J Neurochem. 2002;82:1171–1178. doi: 10.1046/j.1471-4159.2002.01053.x. [DOI] [PubMed] [Google Scholar]
- 4.Lam M, Marinelli P, Bai L, Gianoulakis C. Psychopharmacology. 2008;201:261–271. doi: 10.1007/s00213-008-1267-8. [DOI] [PubMed] [Google Scholar]
- 5.Sirinathsinghji DJS, Nikolarakis KE, Herz A. Brain Res. 1989;490:276–291. doi: 10.1016/0006-8993(89)90245-x. [DOI] [PubMed] [Google Scholar]
- 6.Frost SI, Keen KL, Levine JE, Terasawa E. J Neurosci Methods. 2008;168:26–34. doi: 10.1016/j.jneumeth.2007.09.001. [DOI] [PMC free article] [PubMed] [Google Scholar]
- 7.Guerriero KA, Keen KL, Terasawa E. Endocrinology. 2012;153:1887–1897. doi: 10.1210/en.2011-1701. [DOI] [PMC free article] [PubMed] [Google Scholar]
- 8.Blakeman KH, Wiesenfeld-Hallin Z, Alster P. Exp Brain Res. 2001;139:354–358. doi: 10.1007/s002210100756. [DOI] [PubMed] [Google Scholar]
- 9.Blouin AM, Fried I, Wilson CL, Staba RJ, Behnke EJ, Lam HA, Maidment NT, Karlsson KAE, Lapierre JL, Siegel JM. Nat Commun. 2013;4:1547–1555. doi: 10.1038/ncomms2461. [DOI] [PMC free article] [PubMed] [Google Scholar]
- 10.Andren PE, Caprioli RM. Brain Res. 1999;845:123–129. doi: 10.1016/s0006-8993(99)01751-5. [DOI] [PubMed] [Google Scholar]
- 11.Baseski HM, Watson CJ, Cellar NA, Shackman JG, Kennedy RT. J Mass Spectrom. 2005;40:146–153. doi: 10.1002/jms.733. [DOI] [PubMed] [Google Scholar]
- 12.Emmett MR, Andren PE, Caprioli RM. J Neurosci Methods. 1995;62:141–147. doi: 10.1016/0165-0270(95)00070-4. [DOI] [PubMed] [Google Scholar]
- 13.Li Q, Zubieta JK, Kennedy RT. Anal Chem. 2009;81:2242–2250. doi: 10.1021/ac802391b. [DOI] [PMC free article] [PubMed] [Google Scholar]
- 14.Mabrouk OS, Kennedy RT. J Neurosci Methods. 2012;209:127–133. doi: 10.1016/j.jneumeth.2012.06.006. [DOI] [PMC free article] [PubMed] [Google Scholar]
- 15.Zhou Y, Mabrouk OS, Kennedy RT. J Am Soc Mass Spectrom. 2013;24:1700–1709. doi: 10.1007/s13361-013-0605-1. [DOI] [PMC free article] [PubMed] [Google Scholar]
- 16.Lanckmans K, Stragier B, Sarre S, Smolders I, Michotte Y. J Sep Sci. 2007;30:2217–2224. doi: 10.1002/jssc.200700159. [DOI] [PubMed] [Google Scholar]
- 17.Mabrouk OS, Li Q, Song P, Kennedy RT. J Neurochem. 2011;118:24–33. doi: 10.1111/j.1471-4159.2011.07293.x. [DOI] [PMC free article] [PubMed] [Google Scholar]
- 18.Maes K, Béchade G, Van Schoors J, Van Wanseele Y, Van Liefferinge J, Michotte Y, Harden SN, Chambers EE, Claereboudt J, Smolders I, Van Eeckhaut A. Bioanalysis. 2015;7:605–619. doi: 10.4155/bio.14.269. [DOI] [PubMed] [Google Scholar]
- 19.Nilsson CL, Karlsson G, Bergquist J, Westman A, Ekman R. Peptides. 1998;19:781–789. doi: 10.1016/s0196-9781(97)00471-3. [DOI] [PubMed] [Google Scholar]
- 20.Behrens HL, Chen RB, Li LJ. Anal Chem. 2008;80:6949–6958. doi: 10.1021/ac800798h. [DOI] [PMC free article] [PubMed] [Google Scholar]
- 21.Warwood S, Byron A, Humphries MJ, Knight D. J Proteomics. 2013;85:160–164. doi: 10.1016/j.jprot.2013.04.034. [DOI] [PMC free article] [PubMed] [Google Scholar]
- 22.Grohganz H, Rischer M, Brandl M. Eur J Pharm Sci. 2004;21:191–196. doi: 10.1016/j.ejps.2003.10.008. [DOI] [PubMed] [Google Scholar]
- 23.van Midwoud PM, Rieux L, Bischoff R, Verpoorte E, Niederlander HAG. J Proteome Res. 2007;6:781–791. doi: 10.1021/pr0604099. [DOI] [PubMed] [Google Scholar]
- 24.Maes K, Van Liefferinge J, Viaene J, Van Schoors J, Van Wanseele Y, Bechade G, Chambers EE, Morren H, Michotte Y, Heyden YV, Claereboudt J, Smolders I, Van Eeckhauta A. J Chromatogr A. 2014;1360:217–228. doi: 10.1016/j.chroma.2014.07.086. [DOI] [PubMed] [Google Scholar]
- 25.Yadid G, Zangen A, Herzberg U, Nakash R, Sagen J. Neuropsychopharmacology. 2000;23:709–716. doi: 10.1016/S0893-133X(00)00152-4. [DOI] [PubMed] [Google Scholar]
- 26.Yoshida Y, Fujiki N, Nakajima T, Ripley B, Matsumura H, Yoneda H, Mignot E, Nishino S. Eur J Neurosci. 2001;14:1075–1081. doi: 10.1046/j.0953-816x.2001.01725.x. [DOI] [PubMed] [Google Scholar]
- 27.Nirogi R, Kandikere V, Bhyrapuneni G, Benade V, Saralaya R, Irappanavar S, Muddana N, Ajjala DR. J Neurosci Methods. 2012;209:379–387. doi: 10.1016/j.jneumeth.2012.06.010. [DOI] [PubMed] [Google Scholar]
- 28.Schmerberg CM, Li LJ. Anal Chem. 2013;85:915–922. doi: 10.1021/ac302403e. [DOI] [PMC free article] [PubMed] [Google Scholar]
- 29.Takeda S, Sato N, Ikimura K, Nishino H, Rakugi H, Morishita R. Neuroscience. 2011;186:110–119. doi: 10.1016/j.neuroscience.2011.04.035. [DOI] [PubMed] [Google Scholar]
- 30.Herbaugh AW, Stenken JA. J Neurosci Methods. 2011;202:124–127. doi: 10.1016/j.jneumeth.2011.05.006. [DOI] [PMC free article] [PubMed] [Google Scholar]
- 31.Dahlin AP, Hjort K, Hillered L, Sjodin MOD, Bergquist J, Wetterhall M. Anal Bioanal Chem. 2012;402:2057–2067. doi: 10.1007/s00216-011-5614-y. [DOI] [PubMed] [Google Scholar]
- 32.Dahlin AP, Wetterhall M, Caldwell KD, Larsson A, Bergquist J, Hillered L, Hjort K. Anal Chem. 2010;82:4376–4385. doi: 10.1021/ac1007706. [DOI] [PubMed] [Google Scholar]
- 33.Tsujino N, Sakurai T. Pharmacol Rev. 2009;61:162–176. doi: 10.1124/pr.109.001321. [DOI] [PubMed] [Google Scholar]
- 34.Sakurai T, Amemiya A, Ishii M, Matsuzaki I, Chemelli RM, Tanaka H, Williams SC, Richarson JA, Kozlowski GP, Wilson S, Arch JR, Buckingham RE, Haynes AC, Carr SA, Annan RS, McNulty DE, Liu WS, Terrett JA, Elshourbagy NA, Bergsma DJ, Yanagisawa M. Cell. 1998;92:573–585. doi: 10.1016/s0092-8674(00)80949-6. [DOI] [PubMed] [Google Scholar]
- 35.Patterson CM, Wong JM, Leinninger GM, Allison MB, Mabrouk OS, Kasper CL, Gonzalez IE, Mackenzie A, Jones JC, Kennedy RT, Myers MG., Jr Endocrinology. 2015;156:1692–1700. doi: 10.1210/en.2014-1986. [DOI] [PMC free article] [PubMed] [Google Scholar]
- 36.Paxinos G, Watson CJ. The Rat Brain in Stereotaxic Coordinates. Elsevier; 2007. [DOI] [PubMed] [Google Scholar]
- 37.Mitulović G, Stingl C, Steinmacher I, Hudecz O, Hutchins JRA, Peters J-M, Mechtler K. Anal Chem. 2009;81:5955–5960. doi: 10.1021/ac900696m. [DOI] [PubMed] [Google Scholar]
- 38.Thomas M, Moriyama K, Ledebo I. In: High-Performance Membrane Dialyzers. Saito A, Kawanishi H, Yamashita AC, Mineshima M, editors. Vol. 173. 2011. pp. 119–129. [Google Scholar]
- 39.Silva AI, de Matos AN, Brons IG, Mateus M. Med Res Rev. 2006;26:181–222. doi: 10.1002/med.20047. [DOI] [PubMed] [Google Scholar]
- 40.Thomas M, Valette P, Mausset AL, Dejardin P. Int J Artif Organs. 2000;23:20–26. [PubMed] [Google Scholar]
- 41.Lavaud S, Canivet E, Wuillai A, Maheut H, Randoux C, Bonnet JM, Renaux JL, Chanard J. Nephrol Dial Transplant. 2003;18:2097–2104. doi: 10.1093/ndt/gfg272. [DOI] [PubMed] [Google Scholar]
- 42.Fenzl T, Flachskamm C, Rossbauer M, Deussing JM, Kimura M. Behavioural brain research. 2009;203:143–145. doi: 10.1016/j.bbr.2009.04.012. [DOI] [PubMed] [Google Scholar]
- 43.Zangen A, Herzberg U, Vogel Z, Yadid G. Neuroscience. 1998;85:659–662. doi: 10.1016/s0306-4522(98)00050-5. [DOI] [PubMed] [Google Scholar]
- 44.Zhang Q, Zhang S, Bi W. Polymer. 2011;52:5471–5478. [Google Scholar]
- 45.Moore DS. Biochemical Education. 1985;13:10–11. [Google Scholar]
Associated Data
This section collects any data citations, data availability statements, or supplementary materials included in this article.