

Abstract
Purpose
To compare the effectiveness of home-based (HB) computer vergence/accommodative therapy (HB-C) to HB near target push-up therapy (HB-PU) and to HB placebo treatment (HB-P) among children aged 9 to <18 years with symptomatic convergence insufficiency (CI).
Methods
In this multi-center randomized clinical trial, participants were randomly assigned to computer therapy, near target push-ups, or placebo. All therapy was prescribed for 5 days per week at home. A successful outcome at 12 weeks was based on meeting predetermined composite criteria for the CI Symptom Survey, near point of convergence, and positive fusional vergence at near.
Results
204 participants were randomly assigned to HB-C (n=75), HB-PU (n=85), or HB-P (n=44). At 12 weeks, 16 of 69 (23%, 95% CI: 14% to 35%) in the HB-C group, 15 of 69 (22%, 95% CI: 13% to 33%) in the HB-PU group, and 5 of 31 (16%, 95% CI: 5% to 34%) in the HB-P group were classified as having a successful outcome. The difference in the percentage of participants with a successful outcome in the HB-C group compared with the HB-PU group was −4% (2-sided 97.5% CI: −19% to +11%; P=0.56) and with the HB-P group was +5%, (2-sided 97.5% CI: −12% to +22%; P=0.52), adjusted for baseline levels of the composite outcome components.
Conclusions
The majority of participants with symptomatic CI did not have a successful outcome at 12 weeks. Some participants treated with placebo were successful. With recruitment reaching only 34% of that originally planned and differential loss to follow-up among groups, estimates of success are not precise and comparisons across groups are difficult to interpret.
Keywords: convergence insufficiency, home-based, home-based computer vergence/accommodative therapy, home-based near target push-up therapy, home-based placebo therapy, vision therapy, orthoptics, near point of convergence
Convergence insufficiency (CI) is a binocular vision disorder that has been reported to affect approximately 4% of school-age children in the United States.1–4 Symptoms occur while reading or doing close work and include loss of place, having to re-read a word or phrase, reading slowly, poor comprehension, sleepiness, blurred vision, diplopia, headaches, and eye strain.5–14 Treatment strategies include non-surgical treatments, such as base-in prism or pencil push-ups, and variations of office-based and home-based vision therapy. Recent randomized clinical trials have shown office-based vergence/accommodative therapy with home reinforcement to be more effective than office-based placebo therapy,14–16 home-based pencil push-ups alone,14–16 and home-based computer vergence/accommodative therapy plus pencil push-ups14 in treating children with symptomatic CI.
Home-based treatments require fewer office visits and less patient-doctor contact time and may be less costly than office-based therapy, although formal cost-effectiveness studies have not been done. However, home-based computer vergence/accommodative therapy and home-based pencil push-up treatments have not been compared with placebo controls, raising questions about their clinical effectiveness.14, 15 Another unknown is whether strategies to improve treatment compliance may increase success rates for children treated by home-based computer vergence/accommodative therapy and other home-based therapies.
The study reported herein was a multi-center randomized clinical trial designed to compare the effectiveness of home-based computer vergence/accommodative therapy (HB-C) with home-based near target push-up therapy (HB-PU; commonly referred to as pencil push-ups), and to compare HB-C to home-based placebo therapy (HB-P) in children 9 to <18 years of age with symptomatic CI.
METHODS
The study was supported through a cooperative agreement with the National Eye Institute of the National Institutes of Health, Department of Health and Human Services and was conducted according to the tenets of the Declaration of Helsinki by the Pediatric Eye Disease Investigator Group (PEDIG) at 30 clinical sites (private practices or academic institutions). The protocol and Health Insurance Portability and Accountability Act (HIPAA)-compliant informed consent forms were approved by the institutional review boards (IRB). A parent or guardian (referred to subsequently as “parent”) of each study participant gave written informed consent and each participant assented to participation if required by site IRBs. Study oversight was provided by an independent data and safety monitoring committee. The study is listed on www.clinicaltrials.gov, under identifier NCT01515943, accessed 4/23/15. The complete study protocol is available on the PEDIG website (www.pedig.net, accessed 4/23/15).
Patient Selection
All participants presented to a PEDIG pediatric ophthalmologist or optometrist either seeking treatment or for routine care. Data were not collected to document which of the two reasons applied. Major eligibility included (1) age 9 to <18 years, (2) near exophoria ≥ 4 prism diopters (PD) greater than at distance, (3) reduced positive fusional vergence at near (PFV), defined as <20 PD mean PFV blur or failing Sheards’ criterion (mean PFV measured less than twice the near phoria magnitude), (4) mean near point of convergence (NPC) of ≥ 6 cm break, (5) symptomatic CI, defined as a Convergence Insufficiency Symptom Survey (CISS) (see SDC Figure 1, available at [LWW insert link]).8, 17 score of ≥ 16 points, (6) best-corrected visual acuity of 20/25 or better in each eye at distance and near, and (7) near random dot stereoacuity of at least 400 seconds of arc. Additional eligibility criteria were applied to maintain masking of participants to their randomized treatments. A complete listing of inclusion and exclusion criteria can be found in Appendix Table 1, available at [LWW insert link].
Randomization and Treatment
Data were entered on the PEDIG website, and participants were randomly assigned (using a permutated block design stratified by site) to 1 of 3 HB treatment groups (HB-C group, HB-PU group, and HB-P group) in a 2:2:1 ratio with a 1 in 5 chance of being randomized to the HB-P group.
All therapies were prescribed 5 days per week for 12 weeks to be performed at home and are described in the CITS Procedures Manual (http://publicfiles.jaeb.org/pedig/protocol/CITS_Procedures_Manual_v_5_0_03_04_14.pdf). The HB-C group was prescribed 15 minutes of active computer vergence/accommodative therapy (CVAT) and 5 minutes of placebo flipper exercises. The HB-PU group was prescribed 15 minutes (in full or split into three 5-minute intervals) of a well-defined near target push-up (NTP) procedure and 5 minutes of placebo CVAT. The HB-P group was prescribed 15 minutes of placebo CVAT and 5 minutes of placebo flipper exercises.
All therapies were performed using (or in conjunction with) customized versions of the Home Therapy System (HTS, Home Vision Therapy, Inc., Gold Canyon, AZ) computer software that included a series of timed procedures within each therapy session. This software tracked the amount of time spent on each activity within each therapy session. The active CVAT consisted of fusional vergence procedures (base-in, base-out, autoslide, jump ductions) and an accommodative facility program. Placebo CVAT was similar to the active version except there was no specific accommodation program and the procedures were designed not to stimulate or exert any extra demand on the vergence system.
At enrollment, participants demonstrated their ability to perform the therapies for their assigned treatment group after instruction from study-certified personnel regarding program installation and completion of therapy procedures. Participants were to remain masked to their treatment group until they completed the study.
Testing Procedures
At each visit, the CISS was administered first, followed by clinical testing performed without cycloplegia in participants’ optimal refractive correction at enrollment (if required) by a study-certified examiner. Eligibility testing consisted of the CISS; ocular alignment (cover/uncover testing, prism and alternative cover test); 3 repeated trials of NPC (break, recovery), PFV (blur, break, recovery), and near point of accommodation (NPA) in the right eye; stereoacuity using the Randot Preschool Stereotest at near (Stereo Optical Co., Chicago, IL); and a cycloplegic refraction performed within 6 months prior to enrollment. For eligibility and follow-up examinations, the mean of the 3 repeated trials was computed for the NPA, NPC break, and PFV blur (the break point was used if no blur was reported for that trial) assessments. A full description of the test procedures are provided in the aforementioned CITS Procedures Manual.
With the exception of the cycloplegic refraction and stereoacuity testing, the CISS and clinical testing were repeated at each follow-up examination by an examiner who was masked to participants’ treatment group. Ocular alignment, NPC, PFV, and NPA were required to be performed by a pediatric optometrist, pediatric ophthalmologist, or certified orthoptist.
Follow-up Visits and Primary Outcome
Unmasked site personnel prescribed treatment for a 12-week period, consisting of a 1-week phone call to inquire about installation of the computer programs, and two visits 6 and 12 weeks after randomization. The primary outcome was “a successful outcome” based on meeting pre-defined composite criteria at 12 weeks. Participants were classified as achieving a successful outcome if they met “success” criteria at 12 weeks for all 3 measures as follows: 1) CISS score of <16 points and improvement of ≥ 9 points since baseline, (2) mean NPC break of <6 cm and a 12-week to baseline ratio of <0.763 for mean NPC break, and (3) mean PFV blur of >15 PD and a 12-week to baseline ratio of >1.419 for mean PFV blur. Previously reported repeatability data were used to define the improvement criterion for a single CISS score and for the mean of 3 repeated NPC break and PFV blur trials.14
Treatment Compliance
Compliance, defined as completion of the prescribed therapy session for ≥ 5 days per week, was actively monitored for all treatment groups each week using electronic data transferred from participants’ computer programs to a secure server via the internet. While study personnel were able to electronically view treatment usage data for each of the therapies, performance data were only available for the active CVAT. Unmasked site personnel contacted participants who were non-compliant with one or both of their therapy procedures. In addition, performance checks (only available for the HB-C group) were conducted within the first 3 weeks of treatment to verify proper setup and use of the therapy.
For each treatment regimen, unmasked site personnel estimated the average frequency and duration of completed therapy per session from 0 to 6 weeks and from 6 to 12 weeks based on electronic data from the computer programs and interview with the participant and/or parent. The estimated percentage of prescribed therapy completed was categorized as 0 to 25%, >25% to 50%, >50% to 75%, >75%, or unknown (if unable to quantify the amount of treatment).
Statistical Analyses
The primary outcome was success at 12 weeks. The pre-planned sample size was 595 participants (238 participants in each of the two active treatment groups, 119 participants in the placebo (HB-P) group) to have 90% power to detect a treatment group difference for each of the two pairwise comparisons, HB-C versus HB-PU and HB-C versus placebo, assuming true population success percentages of 30%, 15% and 10% for the HB-C group, HB-PU group, and HB-P group, respectively, with a type I error rate of 2.5% per comparison (5% overall) including adjustments for 3 planned interim analyses for futility and no more than 10% loss to follow-up. The assumed success percentages were determined based on the Convergence Insufficiency Treatment Trial (CITT)14 and clinical expertise. Due to sample size considerations, it was not feasible to compare the HB-PU group with the HB-P group as a primary outcome pairwise comparison based on the assumed successful outcome percentages of 15% versus 10%.
After 27 months of recruitment, the study’s steering committee stopped enrollment into the trial due to insufficient recruitment. No interim monitoring was performed.
The primary analysis included two pairwise treatment group comparisons of the percentages of participants achieving a successful outcome using binomial regression adjusting for baseline covariates of CISS score (<28 points vs ≥ 28 points), mean NPC break (<10 cm vs ≥ 10 cm), and mean PFV blur (≥ 15 PD vs <15 PD). The two pairwise treatment group comparisons were performed using linear contrasts with Bonferroni adjustment for multiple comparisons. The primary analysis included data from 12-week examinations completed between 10 and 18 weeks (inclusive), following a modified intent-to-treat principle that excluded participants with missing 12-week outcomes. Alternative analyses yielded similar results (data not shown) and included the following: exclusion of 12-week examinations completed outside of the protocol window (12 to 15 weeks, inclusive), imputation of 12-week outcomes for participants with a missing 12-week examination using two different multiple imputation strategies; and two post-hoc analyses that (1) included 12-week examinations completed outside of the analysis window and (2) assumed a ‘non-success’ outcome for those with missing 12-week examinations.
Secondary outcomes included the percentage of participants who met success criteria for the individual components of the primary outcome composite measure and for both vergence measures (NPC and PFV), and percentage classified as improvers (12-week CISS score improvement of ≥ 9 points since baseline, 12-week to baseline ratio of <0.763 for mean NPC break, and 12-week to baseline ratio of >1.419 for mean PFV blur). For the HB-C group, the association between CVAT completion (defined as achieving ≥ 15 stars for the jump vergence exercise) and success at 12 weeks was evaluated using Bernard’s exact test. All analyses were conducted using SAS version 9.4 (SAS Inc., Cary, NC).
RESULTS
At 30 sites between June 2012 and August 2014, 204 participants were randomly assigned to the HB-C group (n=75), HB-PU group (n=85), or the HB-P group (n=44). The mean age was 12.4 years at enrollment. The mean baseline CISS score was 29.9 points, and the mean NPC break and mean PFV blur were 14.0 cm and 12.1 PD, respectively. Table 1 shows that baseline characteristics were similar across the three treatment groups.
Table 1.
Baseline characteristics of randomized participants.
| Treatment Group
|
Overall (n=204) |
|||||||
|---|---|---|---|---|---|---|---|---|
| HB-C (n=75) |
HB-PU (n=85) |
HB-P (n=44) |
||||||
|
| ||||||||
| N | % | N | % | N | % | N | % | |
| Sex | ||||||||
| Female | 46 | 61% | 46 | 54% | 26 | 59% | 118 | 58% |
|
| ||||||||
| Race/Ethnicity | ||||||||
| White | 29 | 39% | 33 | 39% | 16 | 36% | 78 | 38% |
| Black/African American | 13 | 17% | 22 | 26% | 9 | 20% | 44 | 22% |
| Hispanic | 25 | 33% | 23 | 27% | 13 | 30% | 61 | 30% |
| Asian | 5 | 7% | 1 | 1% | 3 | 7% | 9 | 4% |
| Native Hawaiian/Other Pacific Islander | 1 | 1% | 0 | 0 | 0 | 0 | 1 | <1% |
| More than one race | 2 | 3% | 6 | 7% | 3 | 7% | 11 | 5% |
|
| ||||||||
| Age Group at Baseline (Years) | ||||||||
| 9 to <13 | 48 | 64% | 49 | 58% | 28 | 64% | 125 | 61% |
| 13 to <18 | 27 | 36% | 36 | 42% | 16 | 36% | 79 | 39% |
| Mean (SD) | 12.2 (2.4) | 12.6 (2.5) | 12.3 (2.3) | 12.4 (2.4) | ||||
|
| ||||||||
| Refractive Correction Use | ||||||||
| Currently wearing | 29 | 39% | 26 | 31% | 15 | 34% | 70 | 34% |
|
| ||||||||
| Right Eye Baseline Spherical Equivalent (Diopters) | ||||||||
| +1.00 < to +5.63 | 7 | 9% | 13 | 15% | 6 | 14% | 26 | 13% |
| +0.25 < to +1.00 | 15 | 20% | 37 | 44% | 15 | 34% | 67 | 33% |
| −0.25 to +0.25 | 26 | 35% | 16 | 19% | 13 | 30% | 55 | 27% |
| −7.30 to < −0.25 | 27 | 36% | 19 | 22% | 10 | 23% | 56 | 27% |
| Mean (SD) | −0.41 (1.70) | +0.16 (1.37) | +0.40 (1.61) | 0.00 (1.58) | ||||
|
| ||||||||
| Left Eye Spherical Equivalent (Diopters) | ||||||||
| +1.00 < to 5.50 | 10 | 13% | 12 | 14% | 7 | 16% | 29 | 14% |
| +0.25 < to +1.00 | 13 | 17% | 35 | 41% | 16 | 36% | 64 | 31% |
| −0.25 to +0.25 | 24 | 32% | 20 | 24% | 9 | 20% | 53 | 26% |
| −6.80 to < −0.25 | 28 | 37% | 18 | 21% | 12 | 27% | 58 | 28% |
| Mean (SD) | −0.39 (1.65) | +0.19 (1.31) | +0.39 (1.67) | +0.02 (1.55) | ||||
|
| ||||||||
| CI Symptom Survey Score (Points) | ||||||||
| 16 to < 23 | 21 | 28% | 21 | 25% | 13 | 30% | 55 | 27% |
| 23 to < 29 | 17 | 23% | 16 | 19% | 10 | 23% | 43 | 21% |
| 29 to < 37 | 21 | 28% | 21 | 25% | 11 | 25% | 53 | 26% |
| 37 to 57 | 16 | 21% | 27 | 32% | 10 | 23% | 53 | 26% |
| Mean (SD) | 28.6 (8.0) | 31.4 (10.2) | 29.1 (10.2) | 29.9 (9.5) | ||||
|
| ||||||||
| Average Near Point of Convergence (NPC) Break (cm)* | ||||||||
| 6 to < 9 | 19 | 25% | 25 | 29% | 13 | 30% | 57 | 28% |
| 9 to < 12 | 22 | 29% | 14 | 16% | 11 | 25% | 47 | 23% |
| 12 to < 18 | 18 | 24% | 24 | 28% | 8 | 18% | 50 | 25% |
| 18 to 44.5 | 16 | 21% | 22 | 26% | 12 | 27% | 50 | 25% |
| Mean (SD) | 14.1 (7.7) | 14.1 (6.8) | 13.7 (7.2) | 14.0 (7.2) | ||||
|
| ||||||||
| Average Positive Fusional Vergence (PFV) Blur (PD)* | ||||||||
| 2 to < 9 | 13 | 17% | 26 | 31% | 10 | 23% | 49 | 24% |
| 9 to < 12 | 18 | 24% | 21 | 25% | 6 | 14% | 45 | 22% |
| 12 to < 15 | 22 | 29% | 23 | 27% | 14 | 32% | 59 | 29% |
| 15 to 30 † | 22 | 29% | 15 | 18% | 14 | 32% | 51 | 25% |
| Mean (SD) | 12.3 (4.3) | 11.3 (4.7) | 13.1 (5.3) | 12.1 (4.7) | ||||
|
| ||||||||
| Average Near Point of Accommodation (NPA) (cm)* | ||||||||
| 0.5 to < 9 | 14 | 19% | 22 | 26% | 11 | 25% | 47 | 23% |
| 9 to < 12 | 22 | 29% | 20 | 24% | 12 | 27% | 54 | 26% |
| 12 to < 16 | 25 | 33% | 21 | 25% | 10 | 23% | 56 | 27% |
| 16 to 20 | 14 | 19% | 22 | 26% | 11 | 25% | 47 | 23% |
| Mean (SD) | 12.2 (3.8) | 12.4 (4.1) | 12.0 (4.3) | 12.3 (4.1) | ||||
|
| ||||||||
| Exophoria at Near (PD) | ||||||||
| 4 to <8 | 24 | 32% | 29 | 34% | 13 | 30% | 66 | 32% |
| 8 to < 12 | 21 | 28% | 30 | 35% | 14 | 32% | 65 | 32% |
| > 12 to 25 ** | 30 | 40% | 26 | 31% | 17 | 39% | 73 | 36% |
| Mean (SD) | 10.3 (4.7) | 9.8 (4.3) | 10.1 (4.5) | 10.0 (4.5) | ||||
|
| ||||||||
| Exophoria at Distance (PD)^ | ||||||||
| 0 | 40 | 53% | 48 | 56% | 23 | 52% | 111 | 54% |
| 1 to < 3 | 17 | 23% | 24 | 28% | 12 | 27% | 53 | 26% |
| 3 to 9 | 18 | 24% | 13 | 15% | 9 | 20% | 40 | 20% |
| Mean (SD) | 1.8 (2.5) | 1.2 (1.7) | 1.5 (2.1) | 1.5 (2.1) | ||||
Computed as an average of three repeated measurements at enrollment.
Eight participants (2 HB-C, 4 HB-PU and 2 HB-P) met eligibility criteria for reduced positive fusional vergence solely based on Sheard’s criterion (average PFV is less than twice the magnitude of the near phoria).
Includes prism and alternate cover test (PACT) measurement prism diopter magnitudes of 12 PD, 14 PD, 16 PD, 18 PD, 20 PD and 25 PD.
There were no cases of esophoria (distance) at baseline.
HB-C = home-based computer vergence/accommodative therapy; HB-PU = home-based near target push-up therapy; HB-P = home-based placebo therapy; PD = prism diopters; SD = standard deviation
Visit Completion and Treatment Compliance
The 12-week primary outcome examination was completed within the analysis window by 69 (92%), 69 (81%), and 31 (70%) participants in the HB-C, HB-PU, and HB-P groups, respectively (Figure 1). Examiners were masked to treatment group for all examinations.
Figure 1.
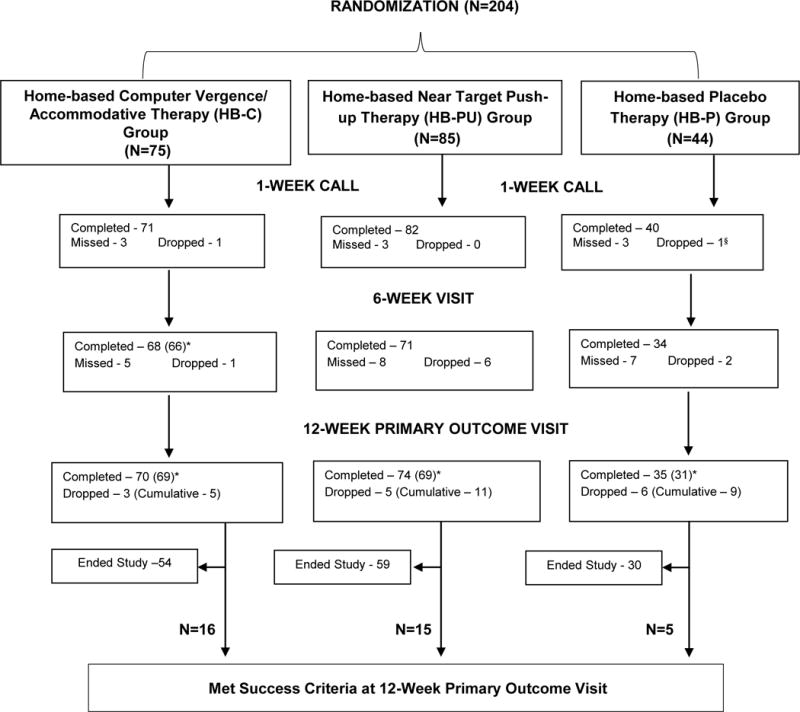
Visit Completion by Treatment Group. *Numbers enclosed in parentheses indicate the number of participants who completed the examination within the analysis window. Visits completed outside of the predefined analysis windows were considered missed and excluded from the analyses. §Participant was withdrawn from the study against protocol immediately after randomization due to ineligibility.
Averaging over the 12 weeks of treatment, completion of >75% of prescribed treatment for the primary (15-minute) therapy was reported by 47 of 69 participants (68%) in the HB-C group, 34 of 69 participants (49%) in the HB-PU group, and 17 of 31 participants (55%) in the HB-P group (Table 2). For the secondary (5-minute) therapy, completion of >75% of prescribed treatment was reported by 45 of 69 participants (65%) in the HB-C group, 44 of 69 participants (64%) in the HB-PU group, and 19 of 31 participants (61%) in the HB-P group.
Table 2.
Estimated compliance with prescribed therapy by treatment group according to duration of therapy.
| Treatment Compliance by Randomized Group
|
|||||||||||
|---|---|---|---|---|---|---|---|---|---|---|---|
| Treatment Duration | 0 to 6 Weeks | 6 to 12 Weeks | Average Compliance | ||||||||
|
| |||||||||||
| HB-C (n=66) | HB-PU (n=71) | HB-P (n=34) | HB-C (n=69) | HB-PU (n=69) | HB-P (n=31) | HB-C (n=69) | HB-PU (n=69) | HB-P (n=31) | |||
| Primary Therapy (15 Minutes)* | Estimated Percentage of Prescribed Therapy Completed | ||||||||||
| >75% | N | 51 | 50 | 25 | 46 | 38 | 17 | 47 | 34 | 16 | |
| % | 77% | 70% | 74% | 67% | 55% | 55% | 68% | 49% | 52% | ||
| >50–75% | N | 4 | 2 | 2 | 3 | 5 | 3 | 5 | 16 | 7 | |
| % | 6% | 3% | 6% | 4% | 7% | 10% | 7% | 23% | 23% | ||
| >25–50% | N | 5 | 7 | 3 | 10 | 11 | 4 | 8 | 8 | 6 | |
| % | 8% | 10% | 9% | 14% | 16% | 13% | 12% | 12% | 19% | ||
| 0–25%¥ | N | 4 | 10 | 3 | 8 | 13 | 7 | 5 | 7 | 1 | |
| % | 6% | 14% | 9% | 12% | 19% | 23% | 7% | 10% | 3% | ||
| Unknown** | N | 2 | 2 | 1 | 2 | 2 | 0 | 4 | 4 | 1 | |
| % | 3% | 3% | 3% | 3% | 3% | 0 | 6% | 6% | 3% | ||
|
| |||||||||||
| Secondary Therapy (5 Minutes)* | Estimated Percentage of Prescribed Therapy Completed | ||||||||||
| >75% | N | 46 | 52 | 27 | 44 | 41 | 19 | 45 | 44 | 19 | |
| % | 70% | 73% | 79% | 64% | 59% | 61% | 65% | 64% | 61% | ||
| >50–75% | N | 5 | 6 | 2 | 8 | 9 | 2 | 8 | 14 | 4 | |
| % | 8% | 8% | 6% | 12% | 13% | 6% | 12% | 20% | 13% | ||
| >25–50% | N | 5 | 6 | 2 | 6 | 7 | 3 | 9 | 5 | 6 | |
| % | 8% | 8% | 6% | 9% | 10% | 10% | 13% | 7% | 19% | ||
| 0–25%† | N | 10 | 7 | 3 | 11 | 12 | 7 | 7 | 6 | 2 | |
| % | 15% | 10% | 9% | 16% | 17% | 23% | 10% | 9% | 6% | ||
| Unknown** | N | 0 | 0 | 0 | 0 | 0 | 0 | 0 | 0 | 0 | |
| % | 0 | 0 | 0 | 0 | 0 | 0 | 0 | 0 | 0 | ||
CVAT = computer vergence/accommodative therapy; HB-C = home-based computer vergence/accommodative therapy; HB-PU = home-based near target push-up therapy; HB-P = home-based placebo therapy; NTP = near target push-ups
For each therapy, compliance was based on unmasked site personnel estimates of the frequency and duration of completed therapy per session from 0 to 6 weeks and 6 to 12 weeks based on electronic data from the computer programs and interviews with the participant and/or parent at each visit.
Results include participants with 6-week visits completed within the analysis window (4 to <10 weeks after randomization) for the 0 to 6 week interval and participants with 12-week visits completed within the analysis window (10 to 18 weeks from randomization) for the 6 to 12 week interval and for the average compliance assessment for the entire 12-week treatment period. As a result, 33 participants (9 in the HB-C group, 14 in the HB-PU group, 10 in the HB-P group) were excluded from the compliance assessment from 0 to 6 weeks, and 35 participants (6 in the HB-C group, 16 in the HB-PU group, 13 in the HB-P group) were excluded from the compliance assessment at the 6- to 12-week interval and for the overall 12-week treatment period.
Primary (15 minutes/session) therapy corresponded to the active CVAT for the HB-C group, the active NTP therapy (could be split up into three 5-minute intervals) for the HB-PU group, and the placebo CVAT for the HB-P group.
Secondary (5 minutes/session) therapy corresponded to the placebo NTP therapy for both the HB-C and HB-P groups, and the placebo CVAT for the HB-PU group.
Treatment compliance at the 0 to 6 week interval and/or 6 to 12 week interval was classified as ‘Unknown’ in cases where prescribed therapy was completed but no determination could be made regarding the amount. Average treatment compliance was classified as ‘Unknown’ if treatment compliance at the 0 to 6 week interval or the 6 to 12 week interval was classified as ‘Unknown.’
At the 6-week visit, 5 participants (3 in the HB-PU group, 2 in the HB-P group) did not perform any of the primary therapy.
At the 12-week visit, 8 participants (2 in the HB-C group, 4 in the HB-PU group, 2 in the HB-P group) did not perform any primary therapy.
At the 6-week visit, 10 participants (4 in the HB-C group, 4 in the HB-PU group, 2 in the HB-P group) did not perform any secondary therapy.
At the 12-week visit, 11 participants (3 in the HB-C group, 5 in the HB-PU group, 3 in the HB-P group) did not perform any secondary therapy.
Primary Analysis: Successful Outcome after 12 Weeks of Treatment
At the 12-week primary outcome examination, 16 of 69 participants (23%, 95% CI: 14% to 35%) in the HB-C group, 15 of 69 participants (22%, 95% CI: 13% to 33%) in the HB-PU group, and 5 of 31 participants (16%, 95% CI: 5% to 34%) in the HB-P group achieved a successful outcome (Table 3). The difference in the percentage of participants with a successful outcome between the HB-C and HB-PU (reference) groups was −4% (2-sided 97.5% CI: −19% to +11%; P=0.56), after adjustment for baseline covariates. The difference between the HB-C and the HB-P (reference) groups was +5%, (2-sided 97.5% CI: −12% to +22%; P=0.52).
Table 3.
Percentage of participants who met pre-specified success criteria by randomized treatment group at the 6-week and 12-week visits.
| 12- Week Treatment Period | ||||||||||||
|---|---|---|---|---|---|---|---|---|---|---|---|---|
| 6-Week Visit* | 12-Week Primary Outcome Visit § | |||||||||||
| HB-C (n=66) | HB-PU (n=71) | HB-P (n=34) | HB-C (n=69) | HB-PU (n=69) | HB-P (n=31) | |||||||
| N | % | N | % | N | % | N | % | N | % | N | % | |
| Success Met for all 3 measures (CISS, NPC, PFV) | 5 | 8% | 2 | 3% | 1 | 3% | 16 | 23% | 15 | 22% | 5 | 16% |
| CISS Success Met | 13 | 20% | 8 | 11% | 8 | 24% | 28 | 41% | 25 | 36% | 11 | 35% |
| NPC Success Met | 24 | 36% | 20 | 28% | 5 | 15% | 33 | 48% | 33 | 48% | 11 | 35% |
| PFV Success Met | 38 | 58% | 23 | 32% | 12 | 35% | 49 | 71% | 35 | 51% | 16 | 52% |
| NPC & PFV Success Met | 20 | 30% | 10 | 14% | 3 | 9% | 30 | 43% | 22 | 32% | 9 | 29% |
| Improvement criteria met for all 3 measures (CISS, NPC & PFV) | 17 | 26% | 13 | 18% | 3 | 9% | 27 | 39% | 25 | 36% | 10 | 32% |
CISS = Convergence Insufficiency Symptom Survey; HB-C = home-based computer vergence/accommodative therapy; HB-PU = home-based near target push-up therapy; HB-P = home-based placebo therapy; NPC = near point of convergence; PFV = positive fusional vergence.
Thirty-one participants (7 in the HB-C group, 14 in the HB-PU group and 10 in the HB-P group) missed (n=20) or withdrew (n=11) prior to the 6-week visit. Of those who completed a 6-week visit, 2 participants in the HB-C group completed the visit outside of the analysis window (4 to <10 weeks after randomization); therefore, the visit was considered missed for the analyses (not included in Table 3).
Twenty-five participants (5 in the HB-C group, 11 in the HB-PU group, and 9 in the HB-P group) did not complete the 12-week primary outcome visit due to study withdrawal prior to the 12-week visit. Of those who completed the 12-week primary outcome visit, 10 participants (1 in the HB-C group, 5 in the HB-PU group, and 4 in the HB-P group) completed the visit outside of the analysis window (10 to 18 weeks after randomization); therefore, the visit was considered missed for the analyses (not included in Table 3).
The percentage of participants classified as improvers and those who met the success criteria for the individual components of the composite measure and for both vergence measures are reported in Table 3. In the HB-C group, 18% of participants who completed the CVAT (n=22) and 26% of participants who did not complete the CVAT (n=47) met success criteria at the 12-week examination (difference: −7%, 95% CI: −27% to +17%).
DISCUSSION
We sought to evaluate the effectiveness of home-based therapy regimens for children 9 to <18 years of age with symptomatic CI, specifically comparing the percentage of participants with a successful outcome who were prescribed 12 weeks of HB-C to those prescribed 12 weeks of HB-PU, or placebo therapy. The majority of participants in the HB-C and HB-PU groups did not achieve a successful outcome at 12 weeks, and some children treated with placebo therapy were successful. Approximately one-third of the preplanned sample size was recruited, which resulted in insufficient power to compare treatment groups. In addition, differential loss to follow-up (HB-C 8%, HB-PU 19%, and HB-P 30%) introduced the potential for bias. Thus, we are unable to reach any conclusions regarding the effectiveness of HB-C compared with HB-PU and with placebo.
Our composite primary outcome criteria for success were stringent. Across treatment groups, less than 25% of participants were classified as having a successful outcome after 12 weeks of therapy. Although a higher percentage of participants improved between the 6- and 12-week visits in each treatment group, these results need to be viewed cautiously due to the large number of missing 12-week outcomes, particularly in the HB-PU and HB-P groups.
Reported estimates of compliance were reasonably good for the primary treatment procedure for the first 6 weeks of treatment, but a substantial decrease occurred in the subsequent 6 weeks, particularly in the HB-PU and HB-P groups (Table 2). These compliance data suggest that active CVAT may have been more engaging than placebo CVAT and participants were more likely to comply with this therapy through 12 weeks. Poorer compliance between 6 and 12 weeks may be one reason why participants in the HB-PU and HB-P groups were less likely to complete the 12-week primary outcome examination [HB-PU (81%) and HB-P (70%)] than participants in the HB-C group (92%).
Within the HB-C group, completion of the jump vergence component of the active CVAT program may be a surrogate for compliance. If the active CVAT program was effective, we might expect that participants who completed the program may have been more likely to achieve a successful outcome compared with those who did not complete the program. Our data did not find such a relationship, rather, only 18% of participants who completed the active CVAT program met achieved a successful outcome versus the 26% of participants who failed to complete the active CVAT program.
There is limited information in the literature about the rate of improvement in CI symptoms and clinical signs with HB treatments, and how many weeks of HB therapy is required to achieve a successful outcome. In our study, the majority of improvement occurred between 6 and 12 weeks, suggesting that 6 weeks of treatment with either HB-C or HB-PU is not sufficient (Table 4). At the 6-week visit, only 8% in the HB-C group and 3% in both the HB-PU and HB-P groups achieved a successful outcome. It is also important to note that the clinical findings (NPC and PFV) improved more rapidly than symptoms, as measured by the CISS, during the first 6 weeks (Table 3). This phenomenon has been reported previously in the CITT study in which symptoms improved more slowly than clinical signs.18 Thus, even if the symptoms do not improve during the first 6 weeks of HB therapy in a child with symptomatic CI, it may be reasonable to continue therapy for at least 6 additional weeks, as long as the clinical findings have improved.
Table 4.
Change in outcome measures (CISS, NPC and PFV) since baseline at the 6-week and 12-week visits by treatment group.
| 6-Week Visit* | 12-Week Primary Outcome Visit§ | |||||||||||
|---|---|---|---|---|---|---|---|---|---|---|---|---|
|
| ||||||||||||
| HB-C (n=66) |
HB-PU (n=71) |
HB-P (n=34) |
HB-C (n=69) |
HB-PU (n=69) |
HB-P (n=31) |
|||||||
|
| ||||||||||||
| N | % | N | % | N | % | N | % | N | % | N | % | |
| CISS Score Change from Baseline | ||||||||||||
| 15 to 50 points improvement | 15 | 23% | 8 | 11% | 4 | 12% | 26 | 38% | 19 | 28% | 11 | 35% |
| 9 to <15 points improvement | 15 | 23% | 19 | 27% | 8 | 24% | 12 | 17% | 21 | 30% | 6 | 19% |
| 0 to < 9 points improvement | 21 | 32% | 29 | 41% | 15 | 44% | 21 | 30% | 18 | 26% | 9 | 29% |
| 0< to 18 points worsening | 15 | 23% | 15 | 21% | 7 | 21% | 10 | 14% | 11 | 16% | 5 | 16% |
| Mean (SD) | 7.2 (9.4) | 5.8 (8.0) | 6.1 (10.3) | 11.2 (12.2) | 9.7 (10.4) | 10.9 (13.1) | ||||||
| Median | 7.0 | 6.0 | 5.5 | 11.0 | 10.0 | 10.0 | ||||||
|
| ||||||||||||
| NPC Break Change from Baseline | ||||||||||||
| 10 to 37.5 cm improvement | 6 | 9% | 7 | 10% | 2 | 6% | 14 | 20% | 12 | 17% | 6 | 19% |
| 5 to <10 cm improvement | 20 | 30% | 18 | 25% | 5 | 15% | 22 | 32% | 20 | 29% | 5 | 16% |
| 0 to <5 cm improvement | 31 | 47% | 33 | 46% | 19 | 56% | 25 | 36% | 25 | 36% | 13 | 42% |
| 0< to 43 cm worsening | 9 | 14% | 13 | 18% | 8 | 24% | 8 | 12% | 12 | 17% | 7 | 23% |
| Mean (SD) | 4.4 (4.8) | 4.2 (6.5) | 1.0 (7.2) | 6.3 (6.1) | 4.7 (11.3) | 3.0 (10.1) | ||||||
| Median | 3.7 | 3.5 | 1.8 | 5.0 | 4.3 | 2.7 | ||||||
|
| ||||||||||||
| PFV Blur Change from Baseline | ||||||||||||
| 15 to 45 PD improvement | 18 | 27% | 9 | 13% | 2 | 6% | 27 | 39% | 16 | 23% | 7 | 23% |
| 5 to <15 PD improvement | 26 | 39% | 23 | 32% | 12 | 35% | 27 | 39% | 27 | 39% | 12 | 39% |
| 0 to <5 PD improvement | 19 | 29% | 30 | 42% | 9 | 26% | 12 | 17% | 19 | 28% | 6 | 19% |
| 0< to 14 PD worsening | 3 | 5% | 9 | 13% | 11 | 32% | 3 | 4% | 7 | 10% | 6 | 19% |
| Mean (SD) | 10.6 (9.7) | 6.4 (7.9) | 4.6 (7.8) | 13.4 (11.1) | 9.3 (8.7) | 7.3 (8.8) | ||||||
| Median | 8.8 | 4.0 | 3.3 | 12.3 | 7.3 | 6.7 | ||||||
CISS = Convergence Insufficiency Symptom Survey; HB-C = home-based computer vergence/accommodative therapy; HB-PU = home-based near target push-up therapy; HB-P = home-based placebo therapy; NPC = near point of convergence; PD = prism diopters; PFV = positive fusional vergence; SD = standard deviation
Thirty-one participants (7 in the HB-C group, 14 in the HB-PU group and 10 in the HB-P group) missed (n=20) or withdrew (n=11) prior to the 6-week visit. Of those who completed a 6-week visit, 2 participants in the HB-C group completed the visit outside of the analysis window (4 to <10 weeks after randomization); therefore, the visit was considered missed for the analyses (not included in Table 3).
Twenty-five participants (5 in the HB-C group, 11 in the HB-PU group, and 9 in the HB-P group) did not complete the 12-week primary outcome visit due to study withdrawal prior to the 12-week visit. Of those who completed the 12-week primary outcome visit, 10 participants (1 in the HB-C group, 5 in the HB-PU group, and 4 in the HB-P group) completed the visit outside of the analysis window (10 to 18 weeks after randomization); therefore, the visit was considered missed for the analyses (not included in Table 4).
It is unknown whether extending the duration of therapy beyond 12 weeks may lead to additional improvement. This study was not designed to determine the maximum treatment effect for any of the three treatments. Rather, we selected 12 weeks of treatment based on previous literature,14–16 consensus opinion of our planning committee, and a reluctance to keep participants on placebo therapy for longer than 3 months. Our data suggest additional improvement is unlikely given there was a decline in compliance between 6 and 12 weeks, and participants in the HB-C group who completed therapy were not more likely to be classified as a success than those who did not.
A significant limitation of the study was the differential loss to follow-up (HB-C 8%, HB-PU 19%, and HB-P 30%), which introduced the potential for bias. The successful outcome rate of 23% for HB-C may be the least subject to bias given the HB-C group had a 12-week visit completion rate of 92% (compared with 81% for HB-PU and 70% for HB-P). The upper 95% confidence limit for the proportion of participants with a successful outcome in the HB-C group is 35%, so it is unlikely there is a large treatment effect from HB-C therapy. If the success rate at outcome in the HB-PU group is unbiased, it is also unlikely there is a large treatment effect from HB-PU therapy (upper 95% confidence limit = 33%). Other potential limitations were that we did not formally assess whether participants remained masked to their treatment group during the study and the assessment of compliance was not completely objective because it was partially based on interview with the participant and/or parent in addition to electronic data from the computer programs.
During the planning stages of this study there appeared to be sufficient enthusiasm among PEDIG investigators to proceed with the study despite the required sample size of 595 participants. However, once the study launched, it became clear that many investigators were not seeing as many eligible children in their practices, leading to insufficient recruitment and early termination of the study.
It is not clear why these active therapies were not successful in treating most of the participants with symptomatic CI. Inadequate compliance with treatment and poor effectiveness of home-based therapy for improving clinical signs and symptoms associated with CI are possibilities. However, the parents and participants were sufficiently motivated to enroll in the study, the participants were symptomatic based on their enrollment CISS scores, and compliance was reasonably good across all three treatments. In addition, there was no difference in the successful outcome rates of those in the HB-C group who successfully completed the program compared with those who did not compete all phases of the program. The treatment compliance data suggest that some participants, particularly in the HB-P and HB-PU groups, may have lost motivation as the study progressed, perhaps because their symptoms were not improving, they found the treatment to be boring, or due to some other unknown reason.
Neither HB-C nor HB-PU when prescribed for 12 weeks were successful in treating the majority of children with symptomatic CI, and some children treated with placebo achieved a successful outcome. Direct comparison of the treatment groups was limited by insufficient recruitment and differential loss to follow-up.
Supplementary Material
SDC Figure 1, the Convergence Insufficiency Symptom Survey (CISS), IS available at [LWW insert link].
Appendix Table 1, a complete listing of inclusion and exclusion criteria, is available at [LWW insert link].
Acknowledgments
This study was supported by the National Eye Institute of National Institutes of Health, Department of Health and Human Services EY011751, EY023198, and EY018810. The funding organization had no role in the design and conduct of the study; collection, management, analysis, and interpretation of the data; preparation, review, or approval of the manuscript; and decision to submit the manuscript for publication. Elizabeth Lazar had full access to all the data in the study and takes responsibility for the integrity of the data and the accuracy of the data analysis. Clinical Trial Registration: The study is listed on www.clinicaltrials.gov, under identifier NCT01515943.
Footnotes
Center received support utilized for this project from an unrestricted grant from Research to Prevent Blindness Inc., New York, New York.
No conflicting relationships exist for any author.
Content from this manuscript was presented at the annual American Academy of Optometry meeting, October 2015, New Orleans, LA.
References
- 1.Rouse MW, Borsting E, Hyman L, Hussein M, Cotter SA, Flynn M, Scheiman M, Gallaway M, De Land PN. Frequency of convergence insufficiency among fifth and sixth graders. The Convergence Insufficiency and Reading Study (CIRS) group. Optom Vis Sci. 1999;76:643–9. doi: 10.1097/00006324-199909000-00022. [DOI] [PubMed] [Google Scholar]
- 2.Letourneau JE, Lapierre N, Lamont A. The relationship between convergence insufficiency and school achievement. Am J Optom Physiol Opt. 1979;56:18–22. doi: 10.1097/00006324-197901000-00004. [DOI] [PubMed] [Google Scholar]
- 3.Letourneau JE, Ducic S. Prevalence of convergence insufficiency among elementary school children. Can J Optom. 1988;50:194–7. [Google Scholar]
- 4.Rouse MW, Hyman L, Hussein M, Solan H. Frequency of convergence insufficiency in optometry clinic settings. Convergence Insufficiency and Reading Study (CIRS) Group. Optom Vis Sci. 1998;75:88–96. doi: 10.1097/00006324-199802000-00012. [DOI] [PubMed] [Google Scholar]
- 5.Cooper J, Duckman R. Convergence insufficiency: incidence, diagnosis, and treatment. J Am Optom Assoc. 1978;49:673–80. [PubMed] [Google Scholar]
- 6.Daum KM. Convergence insufficiency. Am J Optom Physiol Opt. 1984;61:16–22. doi: 10.1097/00006324-198401000-00003. [DOI] [PubMed] [Google Scholar]
- 7.Borsting E, Rouse MW, Deland PN, Hovett S, Kimura D, Park M, Stephens B. Association of symptoms and convergence and accommodative insufficiency in school-age children. Optometry. 2003;74:25–34. [PubMed] [Google Scholar]
- 8.Borsting EJ, Rouse MW, Mitchell GL, Scheiman M, Cotter S, Cooper J, Kulp MT, London R. Validity and reliability of the revised convergence insufficiency symptom survey in children aged 9–18 years. Optom Vis Sci. 2003;80:832–8. doi: 10.1097/00006324-200312000-00014. [DOI] [PubMed] [Google Scholar]
- 9.Kent PR, Steeve JH. Convergence insufficiency, incidence among military personnel and relief by orthoptic methods. Mil Surg. 1953;112:202–5. [PubMed] [Google Scholar]
- 10.Poynter HL, Schor C, Haynes HM, Hirsch J. Oculomotor functions in reading disability. Am J Optom Physiol Opt. 1982;59:116–27. doi: 10.1097/00006324-198202000-00002. [DOI] [PubMed] [Google Scholar]
- 11.Mazow ML. The convergence insufficiency syndrome. J Ped Ophthalmol. 1971;8:243–4. [Google Scholar]
- 12.Duke-Elder S, Wybar K. Ocular motility and strabismus. In: Duke-Elder S, editor. System of Ophthalmology. St Louis: Mosby; 1973. pp. 547–51. [Google Scholar]
- 13.Pickwell LD, Hampshire R. The significance of inadequate convergence. Ophthal Physiol Opt. 1981;1:13–18. [PubMed] [Google Scholar]
- 14.Convergence Insufficiency Treatment Trial (CITT) Study Group. Randomized clinical trial of treatments for symptomatic convergence insufficiency in children. Arch Ophthalmol. 2008;126:1336–49. doi: 10.1001/archopht.126.10.1336. [DOI] [PMC free article] [PubMed] [Google Scholar]
- 15.Scheiman M, Mitchell GL, Cotter S, Cooper J, Kulp M, Rouse M, Borsting E, London R, Wensveen J. A randomized clinical trial of treatments for convergence insufficiency in children. Convergence Insufficiency Treatment Trial (CITT) Study Group. Arch Ophthalmol. 2005;123:14–24. doi: 10.1001/archopht.123.1.14. [DOI] [PubMed] [Google Scholar]
- 16.Scheiman M, Mitchell GL, Cotter S, Kulp MT, Cooper J, Rouse M, Borsting E, London R, Wensveen J. A randomized clinical trial of vision therapy/orthoptics versus pencil pushups for the treatment of convergence insufficiency in young adults. Optom Vis Sci. 2005;82:583–95. doi: 10.1097/01.opx.0000171331.36871.2f. [DOI] [PubMed] [Google Scholar]
- 17.Rouse M, Borsting E, Mitchell GL, Cotter SA, Kulp M, Scheiman M, Barnhardt C, Bade A, Yamada T. Validity of the convergence insufficiency symptom survey: a confirmatory study. Convergence Insufficiency Treatment Trial (CITT) Investigator Study Group. Optom Vis Sci. 2009;86:357–63. doi: 10.1097/OPX.0b013e3181989252. [DOI] [PMC free article] [PubMed] [Google Scholar]
- 18.Scheiman M, Kulp MT, Cotter S, Mitchell GL, Gallaway M, Boas M, Coulter R, Hopkins K, Tamkins S. Vision therapy/orthoptics for symptomatic convergence insufficiency in children: treatment kinetics. Convergence Insufficiency Treatment Trial (CITT) Study Group. Optom Vis Sci. 2010;87:593–603. doi: 10.1097/OPX.0b013e3181e61bad. [DOI] [PMC free article] [PubMed] [Google Scholar]
Associated Data
This section collects any data citations, data availability statements, or supplementary materials included in this article.
Supplementary Materials
SDC Figure 1, the Convergence Insufficiency Symptom Survey (CISS), IS available at [LWW insert link].
Appendix Table 1, a complete listing of inclusion and exclusion criteria, is available at [LWW insert link].