

Abstract
Uric acid is a naturally occurring, endogenous compound that impacts mental health. In particular, uric acid levels are associated with emotion-related psychopathology (e.g., anxiety and depression). Therefore, understanding uric acid’s impact on the brain would provide valuable new knowledge regarding neural mechanisms that mediate the relationship between uric acid and mental health. Brain regions including the prefrontal cortex, amygdala, and hippocampus underlie stress reactivity and emotion regulation. Thus, uric acid may impact emotion by modifying the function of these brain regions. The present study used functional magnetic resonance imaging (fMRI) during a psychosocial stress task to investigate the relationship between baseline uric acid levels (in saliva) and brain function. Results demonstrate that activity within the bilateral hippocampal complex varied with uric acid concentrations. Specifically, activity within the hippocampus and surrounding cortex increased as a function of uric acid level. The current findings suggest that uric acid levels modulate stress-related hippocampal activity. Given that the hippocampus has been implicated in emotion regulation during psychosocial stress, the present findings offer a potential mechanism by which uric acid impacts mental health.
Keywords: fMRI, Emotion, Uric Acid, Hippocampus
Uric acid is an endogenous compound that is formed as the end-product of purine metabolism. Although imbalanced uric acid levels have a long-standing link with medical conditions such as gout, uric acid also affects the central nervous system. For example, increased uric acid levels accelerate purine transformation, leading to alterations of neural transmission (Ortiz et al., 2015; Ozten et al., 2015). Additionally, uric acid has been linked with neurodegenerative conditions, such as Alzheimer’s, Parkinson’s, and Huntington’s disease, as well as Multiple Sclerosis and mild cognitive impairment (MCI) associated with aging (Bowman et al., 2010; Fang et al., 2013). The role of uric acid in mental health is also an emerging area of research. For example, uric acid levels are associated with emotion-related psychopathology, such as anxiety and mood disorders (Albert et al., 2015; Jahangard et al., 2014; Kesebir et al., 2014; Lyngdoh et al., 2013; Machado-Vieira et al., 2008). Within non-clinical populations, individuals with elevated uric acid levels are more likely to be impulsive (Sutin et al., 2014), hyperactive (Barrera et al., 1988; Johnson et al., 2011), and disinhibited (Lorenzi et al., 2010). Together, these findings provide converging evidence that uric acid may play an important role in psychological health. However, no study to date has examined the extent to which brain function varies with uric acid levels. Thus, the neural mechanisms that mediate uric acid’s effect on mental health remain unclear. Determining whether emotion-related brain function varies with individual differences in uric acid levels will provide valuable insight into uric acid’s influence on emotion-related neural systems.
Uric acid may play an important role in mental health by modulating the emotional response to stress. For example, the autonomic response (blood pressure) to acute stress varies as a function of baseline uric acid levels (Ohno et al., 2015). Low uric acid concentrations are also associated with anxiety and depression (Bove et al., 2010; Lyngdoh et al., 2013; Wen et al., 2012). Further, the social inhibition that characterizes certain stress, anxiety, and depressive disorders may be linked to low uric acid levels (Bove et al., 2010; Wen et al., 2012). Uric acid’s role in social inhibition has also been previously demonstrated in treatment studies of bipolar disorder. Specifically, patients with bipolar disorder show higher uric acid levels during manic episodes (characterized by disinhibition), and therapeutic reductions in uric acid concentrations via allopurinol (a xanthine oxidase inhibitor) significantly reduce manic symptoms (Machado-Vieira et al., 2008). Furthermore, the degree of uric acid reduction correlates with improvement in manic symptom severity (Jahangard et al., 2014). Even within non-clinical populations, baseline uric acid has been linked to psychosocial behavioral tendencies (Lorenzi et al., 2010; Sutin et al., 2014). For example, lower uric acid levels are associated with social inhibition (i.e., general social fearfulness and introverted tendencies), whereas higher uric acid levels are associated with impulsivity and excitement seeking (characterized by a tendency to seek crowded and stimulating environments) (Lara et al., 2008; Lorenzi et al., 2010; Raina & Vats, 1982; Sutin et al., 2014). Although these findings suggest uric acid plays a modulatory role in psychosocial behavior and stress reactivity, the neural mechanisms that underlie these associations are not well understood.
Prior neuroimaging investigations of psychosocial stress suggest neural activity within the prefrontal cortex (PFC) and medial temporal lobe (MTL) support important aspects of the stress response. Specifically, the dorsolateral prefrontal cortex (dlPFC), dorsomedial prefrontal cortex (dmPFC), ventromedial prefrontal cortex (vmPFC), amygdala, and hippocampal complex (i.e., hippocampus and surrounding cortex) mediate psychosocial stress reactivity (Dedovic et al., 2009a; Khalili-Mahani et al., 2010; Pruessner et al., 2008). This prior work indicates that neural activity within these brain regions varies with stress-elicited glucocorticoid release. Thus, recruitment of the prefrontal cortex and MTL suggests that brain regions responsible for emotion expression and regulation mediate the response to psychosocial stress (Pruessner et al., 2008).
The current study examined the relationship between inter-subject variations in extant salivary uric acid levels and blood oxygen-level dependent (BOLD) functional magnetic resonance imaging (fMRI) during a psychosocial stress task (Montreal Imaging Stress Task; MIST) (Dedovic et al., 2005). Salivary uric acid was measured in the current study as a non-invasive alternative to serum uric acid measurement, which requires a blood draw. We hypothesized that stress-elicited brain activity would vary with individual differences in existing (i.e, baseline) uric acid levels given 1) uric acid affects neural transmission (Ortiz et al., 2015; Ozten et al., 2015) and 2) the link between uric acid and psychosocial stress (Bove et al., 2010; Lorenzi et al., 2010; Lyngdoh et al., 2013; Sutin et al., 2014). Specifically, we expected the BOLD signal response within the PFC and MTL, to vary with uric acid level. Thus, the present study provides a novel assessment of emotion-related brain function that may mediate the impact of uric acid on mental health.
Methods
Participants
55 right-handed volunteers (33 males, 22 females, mean age = 19.58 years, age range 18–21 years) participated in an fMRI study using a variation of the MIST. Data from one participant were excluded because the uric acid concentration fell 3 standard deviations above the mean. Remaining participants fell within the approximate range (0.5 – 7.5 mg/dL) for salivary uric acid previously reported in non-clinical samples (Shibasaki et al., 2012; Soukup et al., 2012). Three additional participants were excluded due to data acquisition errors that prevented synchronization of stimulus presentations to imaging data. Thus, 51 participants (29 males, 22 females, mean age = 19.55 years, age range 18–21 years) were included in the final analysis. All participants provided written informed consent as approved by the University of Alabama at Birmingham Institutional Review Board.
Task design
Participants were familiarized with the MIST by completing a computer administered set of practice math problems prior to entering the scanning environment. Following practice, participants completed a modified version of the MIST during BOLD Echo-Planar imaging (EPI). Two separate scans assessed Stress and Control conditions of the task. Each of these scans contained 54 trials and lasted approximately 8 minutes (Figure 1). Trials were six seconds in duration and were separated by a variable inter-trial interval (1–3 s). Each trial consisted of a response window followed by visual feedback. During the response window, a unique math problem (e.g., “6 + 3 −1 = ?”) and digit choices (range: 0–9) appeared on the screen. Participants used an MR compatible joystick (Current Designs; Philadelphia, PA) to highlight a digit choice, then selected their answer by pressing a button on the joystick. Following the response window, participants received real-time visual feedback on their performance (e.g. ‘Right’, ‘Wrong’, or ‘Time out’). Pre-recorded positive (Control condition) and negative (Stress condition) auditory feedback (described below) was presented at four fixed points (i.e., after the first 4 sets of 9 trials) during each scan (Figure 1).
Figure 1.
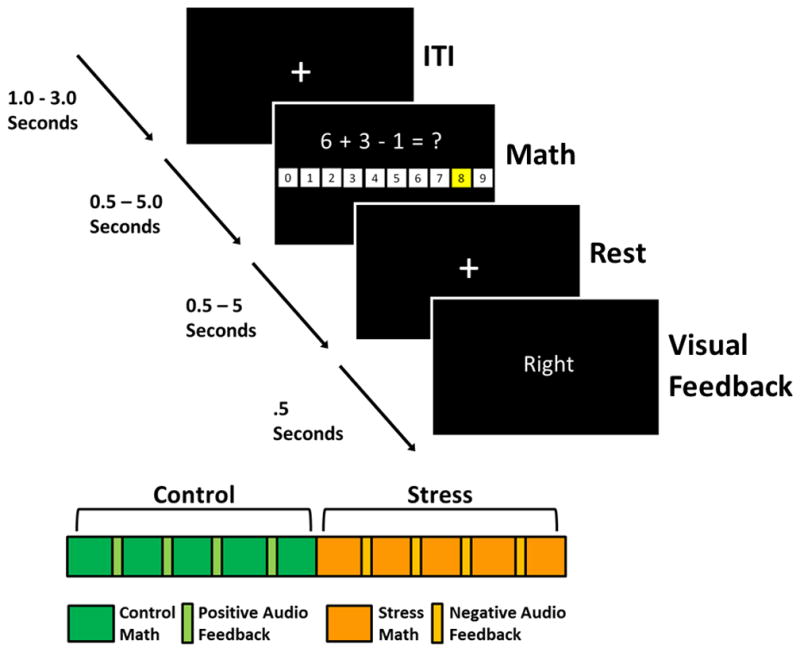
Trial and task progressions. Top panel: Each trial lasted six seconds and consisted of a unique math problem, response window, and visual feedback. Responses were made by highlighting digits (1–9) using an MR compatible joystick. Bottom Panel: Experimental sessions began with the Control version of the MIST, presented under low stress conditions. Participants then completed the Stress version of the MIST, presented under high stress conditions. Green rectangles represent periods of time when participants completed math problems during the Control MIST. Periodically, positive auditory feedback was presented to participants (light green rectangles). Likewise, orange rectangles represent the periods of time when participants completed math problems during the Stress MIST. The light orange rectangles represent periodic negative auditory feedback.
Prior to the control condition, participants were given instructions designed to lower stress during the task (e.g., “You will have 5 seconds to complete each problem. You were doing it much faster during practice.” and “We do not care if you get them all right or not.”). During the control condition, participants received pre-recorded positive and encouraging auditory feedback on their performance at 4 auditory feedback points (i.e., after the first 4 sets of 9 trials). Following the control condition and prior to the stress condition, participants were given instructions designed to increase stress during math performance (e.g., “If you do not get 80% right, we will not be able to use your data.” and “We are monitoring your performance and will give you feedback once we see how you are doing.”). Once the stress condition began, poor performance was ensured by modifying the response window duration on a trial-by-trial basis such that participants answered approximately 50% of the problems correctly. Participants received pre-recorded negative and critical auditory feedback during the 4 auditory feedback points. All other aspects of the task were identical between Stress and Control conditions.
The Control and Stress conditions were presented in a fixed order to avoid carry-over effects that can develop when the Stress condition precedes the Control condition because the stress response can take up to 90 minutes to recover to baseline levels (Dedovic et al., 2005; Gaab et al., 2005; Kirschbaum et al., 1993; Kudielka et al., 2004). Further, counterbalancing the scan order can produce extraneous variability that is unrelated to the individual differences of interest in this study. Thus, we implemented a consistent condition order to reduce variability outside of our measures of interest (i.e., uric acid level and fMRI signal). This design was optimal for detecting individual differences in fMRI signal between Stress and Control conditions, as a function of uric acid.
Uric Acid Analysis
Saliva samples to assess uric acid were collected 30 minutes after participant arrival, immediately prior to the scanning session. Saliva samples (1.0 ml) were collected using passive drool through a short straw into 2.0 ml cryovials. Samples were immediately placed on ice and then stored at −80C. Samples were shipped overnight on dry-ice for assay at the Institute for Interdisciplinary Salivary Bioscience Research (Arizona State University). Saliva samples were assayed in duplicate for salivary uric acid using a commercially available enzymatic reaction kit specifically designed for use with saliva (Salimetrics, Carlsbad). The assay used 10 μl test volume and had a range of sensitivity from 0.78 to 25 mg/dl. The average inter- and intra- assay coefficients of variation were less than 5%. All samples were assayed in duplicate and averaged to determine individual uric acid levels for later comparisons in the functional neuroimaging analyses.
Anatomical and Functional MRI
All MRI data were acquired on a 3T Siemens Allegra Scanner using a brain-specific RF head coil. High-resolution anatomical images (MPRAGE) were obtained as an anatomical reference (T1 weighted, TR=2300ms, TE=3.9ms, FOV=25.6cm, matrix=256×256, slice thickness=1mm, 0.5mm gap). BOLD fMRI was acquired using an EPI sequence (TR=2000ms, TE=30ms, FOV=24cm, matrix=64×64, slice thickness=4mm) during two scans of stimulus presentations. The Analysis of Functional NeuroImages (AFNI) software package (Cox, 1996) was used for all preprocessing and analysis of fMRI data. Functional MRI data were slice-time corrected, motion corrected using six standard motion parameters, and registered to the fifth volume of the control scan. Spatial smoothing was carried out using a 4mm full-width-at-half-maximum (FWHM) Gaussian kernel. Additional motion correction was performed by censoring images with simultaneous signal change that surpassed 3% of the total number of voxels. First-level analysis used a duration modulated gamma variate hemodynamic response function (HRF) derived from math performance (i.e., response window periods) as the regressor of interest. Specifically, duration modulated HRFs were derived based on response timing (i.e. time from trial onset to button press used to answer math problems) for each trial on a subject by subject basis. Joystick movements, button presses, auditory feedback, visual feedback events, and the six motion parameters were added to this model as regressors of no interest. General linear regression was used to obtain beta coefficients as an index of the neural response to performing mathematical operations during either Stress or Control conditions. The resultant activation maps were coregistered to the high resolution MPRAGE and normalized to the Montreal Neurological Institutes’ (MNI) 152 template.
In order to assess neural correlates of the psychosocial stress response, activation maps from math task performance during Stress and Control conditions were compared using a paired samples t-test (3dttest++ in AFNI). Individual participant’s uric acid level was included as a covariate in the analysis to assess voxel-wise BOLD signal changes as a function of uric acid. Analyses were restricted to voxels with temporal signal-to-noise ratios (tSNR; mean divided by standard deviation of fMRI time course) greater than 30 in both the stress and control scans to ensure analyses were completed in areas with sufficient signal quality for each participant. To reduce the number of voxel-wise comparisons, the analysis was restricted to 12 regions of interest, including the bilateral dlPFC, dmPFC, vmPFC, vlPFC, amygdala, and hippocampal complex, based on a priori hypotheses derived from prior literature (Dedovic et al., 2009b; Khalili-Mahani et al., 2010; Pruessner et al., 2008; Wood et al., 2012; Wood et al., 2015). ROIs were generated using the standard Harvard-Oxford atlas (http://fsl.fmrib.ox.ac.uk/fsl/) with a probability threshold of 30. Voxel-wise covariate analysis data within these ROIs were assessed using a p<0.05 (corrected) significance threshold to reduce family-wise error (FWE). The corrected significance threshold was determined by Monte Carlo simulations (3dClustSim [version compiled July 9, 2016]) using an uncorrected significance threshold of p<0.01 and volume correction thresholds that varied with the size and smoothness, averaged across subjects (based on spherical autocorrelation function [ACF] parameters output by 3dFWHMx in AFNI), for each ROI. Results of the simulations corresponding to AFNI clusterize options for nearest neighbor 1 (NN1) and bi-sided criteria were used to determine cluster volume thresholds for each ROI.
Results
Uric Acid Measurement
Baseline uric acid levels were assessed prior to fMRI scanning in order to determine whether individual differences in uric acid vary with the neural response to stress. Participant’s salivary uric acid levels in the current study (Mean = 3.32 mg/dL, S.D. = 1.41; range = 0.78 and 7.38 mg/dL) were similar to the levels reported in prior studies of non-clinical populations (e.g., Shibasaki et al., 2012: Mean = 2.95 mg/dL, S.D. = 1.31; Soukup et al., 2012: Mean = 3.11 mg/dL, S.D. = 1.32).
Functional MRI
Paired samples t-tests (3dttest++ in AFNI) revealed differences in brain activity between the Stress and Control conditions of the MIST that varied as a function of baseline uric acid level (Figure 2). Specifically, differential (Stress vs Control) activation of the left and right hippocampal complex varied with uric acid (left cluster size = 307 mm3; right cluster size = 488 mm3). Clusters of differential activation that varied with uric acid were defined using a p < 0.05 corrected threshold. Results of the Monte Carlo simulations yielded a cluster extent threshold of 208 mm3 for the left hippocampal complex and 208 mm3 for the right hippocampal complex. The fMRI signal response in other ROIs, including the bilateral dlPFC, dmPFC, vmPFC, vlPFC, and amygdala, did not vary with uric acid level. For descriptive purposes, the mean BOLD signal response was extracted (3dROIstats in AFNI) from volumes of activation within the hippocampal complex to further characterize the relationship between uric acid level and brain activity. A positive linear relationship was observed between uric acid and the differential (Stress-Control) fMRI signal response within the bilateral hippocampal complex (Figure 2). Within these clusters, mean voxel signal correlated with uric acid in both the right hippocampal complex, r= 0.49, p<0.001 (peak voxel: X=26, Y= −32, Z= −15) and the left hippocampal complex, r = 0.47, p<0.001 (peak voxel: X=−30, Y= −30, Z= −13).
Figure 2.
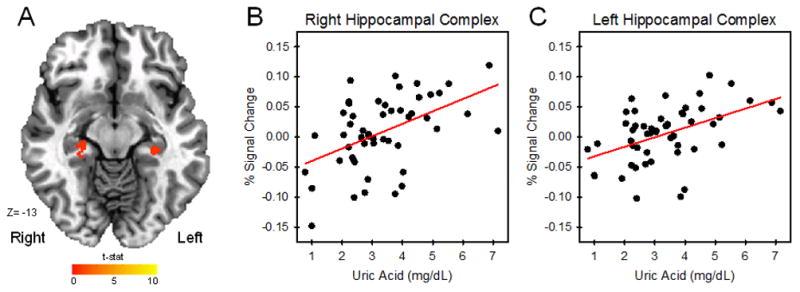
Uric acid and the fMRI signal response. Activity (Stress vs Control) within the hippocampus varied with uric acid level during the MIST (A). As uric acid level increased, the differential fMRI signal response (Stress-Control) increased (B–C).
Both left and right hippocampal cluster volumes surpassed the p<0.05 corrected threshold used in the initial analysis. However, we also implemented a more conservative approach to reduce family-wise error (FWE) across statistical tests applied to analyses of the 12 ROIs. Cluster extent thresholds were determined for each of the 12 ROIs using a Bonferroni adjusted p < 0.004 (i.e., p<0.05/12 ROIs=p<0.004) corrected threshold. Results of the additional Monte Carlo simulations yielded a cluster extent threshold of 360 mm3 for the left hippocampal complex and 371 mm3 for the right hippocampal complex. The right hippocampal complex cluster volume survived the more conservative Bonferroni corrected threshold, while the left hippocampal cluster did not reach the cluster extent threshold.
Discussion
In the current study, the relationship between baseline uric acid level and the human brain response to acute psychosocial stress was assessed to determine uric acid’s impact on emotion-related brain activity. Uric acid has been linked with a variety of psychological conditions, including neurodegenerative conditions and emotion-related psychopathology (Albert et al., 2015; Bowman et al., 2010; Fang et al., 2013; Jahangard et al., 2014; Kesebir et al., 2014; Lyngdoh et al., 2013; Machado-Vieira et al., 2008). Although variations in uric acid level alters neural transmission (Ortiz et al., 2015; Ozten et al., 2015), the brain functions that link uric acid and mental health have yet to be determined. The current study found a positive relationship between bilateral hippocampal complex activity and uric acid concentrations. Given the relationship between hippocampal activity and emotion regulation (Dedovic et al., 2005; Khalili-Mahani et al., 2010; Pruessner et al., 2008), the current findings may have important implications regarding the neurobiological mechanisms that mediate uric acid’s relationship with mental health.
The results of the current study demonstrate that uric acid concentrations vary with hippocampal activation (Stress vs Control conditions) during psychosocial stress. Specifically, as uric acid concentrations increased, differential hippocampal activation to psychosocial stress increased. The hippocampus plays an important role in regulation of the emotional response to stress (van der Werff et al., 2013). For example, psychosocial stress decreases hippocampal activity and ultimately leads to disinhibition (i.e., a transient halt in inhibition) of the emotional response to a stressor. This disinhibition results in the subsequent increase in arousal that is characteristic of the stress response (Dedovic et al., 2009b; Dedovic et al., 2005; Khalili-Mahani et al., 2010; Pruessner et al., 2008). In contrast, greater hippocampal activity has been linked to inhibition of the emotional response to stress (Dedovic et al., 2009c). This prior work indicates that hippocampal activity regulates emotional arousal. Taken together, the present study and prior work suggest uric acid modulates the hippocampal response to stress and, in turn, the hippocampal response regulates emotion (Dedovic et al., 2005; Dedovic et al., 2009c; Khalili-Mahani et al., 2010; Pruessner et al., 2008; van der Werff et al., 2013).
Recent reports have suggested mechanisms by which increased uric acid levels may alter brain function (Alvarez-Lario & Macarron-Vicente, 2011; Fang et al., 2013; Ortiz et al., 2015). Uric acid is considered a neuroprotective factor against oxidative stress. Specifically, uric acid suppresses the damaging effects of reactive oxygen species on neurons by preserving the integrity of the plasma membrane (Guerreiro et al., 2009). Low uric acid levels are associated with neuronal death and diminished protective effect against oxidative stress (Yu et al., 1998). Additionally, uric acid may affect regional neural function by disrupting structural connectivity (i.e., white matter) within the brain (Fang et al., 2013). Alternatively, upstream effects within the purine metabolic process is another possible mechanism by which uric acid may affect neural function. Enzymatic degradation of adenosine and adenosine triphosphate (ATP) and uric acid production result from purine metabolism. Although uric acid does not act as a direct neuromodulator, extracellular levels of uric acid exert modulatory effects on purine transformation. Alterations in purine transformation can influence adenosine levels and ATP, affecting adenosine-related transmission between neurons (Ortiz et al., 2015; Ozten et al., 2015). Regardless of which of these neurobiological mechanisms underlies uric acid’s effects on brain function, multiple lines of evidence suggest that uric acid levels modulate regional brain function.
Prior research that indicates uric acid levels are associated with emotion-related psychopathology and socially anxious traits implies that uric acid affects brain regions that underlie emotion expression and regulation (Albert et al., 2015; Jahangard et al., 2014; Kesebir et al., 2014; Lara et al., 2008; Lorenzi et al., 2010; Lyngdoh et al., 2013; Machado-Vieira et al., 2008). Given that the hippocampal response to stress varies with uric acid, the hippocampus may be an important brain region that mediates the effects of uric acid on psychological functioning. Additionally, low uric acid levels are associated with socially anxious, introverted, and avoidant tendencies, whereas high uric acid levels are associated with disinhibited temperaments, hyperactivity, and impulsivity (Barrera et al., 1988; Johnson et al., 2011; Lara et al., 2008; Lorenzi et al., 2010; Lyngdoh et al., 2013; Sutin et al., 2014). Thus, uric acid may mediate these relationships by modifying the hippocampal response to psychosocial stress, which in turn may alter stress reactivity.
Conclusion
The current study provides novel evidence that brain function varies with baseline uric acid level. Specifically, these results demonstrate that uric acid is associated with a greater hippocampal response to psychosocial stress. Given the hippocampus regulates arousal during acute stress (Dedovic et al., 2005; Dedovic et al., 2009c; Khalili-Mahani et al., 2010; Pruessner et al., 2008), the relationship between uric acid and hippocampal activity in the present study is consistent with prior work that links uric acid with social tendencies and emotion-related psychopathology. Thus, uric acid’s impact on the hippocampus provides a neural mechanism that may mediate the relationship between uric acid and emotional reactivity to psychosocial stress. The conclusion that emotion-related brain function varies with individual differences in uric acid levels provides a mechanistic understanding into uric acid’s influence on emotion-related neural systems.
Highlights.
Uric acid is linked to mental health, yet, the neural mechanisms remain unclear.
Uric acid level was compared with brain function during a psychosocial stress task.
Activity within the hippocampus increased as a function of salivary uric acid.
Hippocampal inhibition during stress may mediate uric acid’s link to mental health.
Acknowledgments
This research was funded by the National Institute of Mental Health of the National Institutes of Health [grant number MH098348].
Footnotes
Disclosure: In the interest of full disclosure DAG is Founder and Chief Scientific and Strategy Advisor at Salimetrics LLC and SalivaBio LLC and these relationships are managed by the policies of the committees on conflict of interest at the Johns Hopkins University School of Medicine and Research Adherence and Integrity at Arizona State University.
Publisher's Disclaimer: This is a PDF file of an unedited manuscript that has been accepted for publication. As a service to our customers we are providing this early version of the manuscript. The manuscript will undergo copyediting, typesetting, and review of the resulting proof before it is published in its final citable form. Please note that during the production process errors may be discovered which could affect the content, and all legal disclaimers that apply to the journal pertain.
References
- Albert U, De Cori D, Aguglia A, Barbaro F, Bogetto F, Maina G. Increased uric acid levels in bipolar disorder subjects during different phases of illness. J Affect Disord. 2015;173:170–175. doi: 10.1016/j.jad.2014.11.005. [DOI] [PubMed] [Google Scholar]
- Alvarez-Lario B, Macarron-Vicente J. Is there anything good in uric acid? QJM. 2011;104(12):1015–1024. doi: 10.1093/qjmed/hcr159. [DOI] [PubMed] [Google Scholar]
- Barrera CM, Ruiz ZR, Dunlap WP. Uric acid: a participating factor in the symptoms of hyperactivity. Biol Psychiatry. 1988;24(3):344–347. doi: 10.1016/0006-3223(88)90205-3. [DOI] [PubMed] [Google Scholar]
- Bove M, Carnevali L, Cicero AF, Grandi E, Gaddoni M, Noera G, et al. Psychosocial factors and metabolic parameters: is there any association in elderly people? The Massa Lombarda Project. Aging Ment Health. 2010;14(7):801–806. doi: 10.1080/13607861003713299. [DOI] [PMC free article] [PubMed] [Google Scholar]
- Bowman GL, Shannon J, Frei B, Kaye JA, Quinn JF. Uric acid as a CNS antioxidant. J Alzheimers Dis. 2010;19(4):1331–1336. doi: 10.3233/JAD-2010-1330. [DOI] [PMC free article] [PubMed] [Google Scholar]
- Cox RW. AFNI: software for analysis and visualization of functional magnetic resonance neuroimages. Comput Biomed Res. 1996;29(3):162–173. doi: 10.1006/cbmr.1996.0014. [DOI] [PubMed] [Google Scholar]
- Dedovic K, D’Aguiar C, Pruessner JC. What stress does to your brain: a review of neuroimaging studies. Can J Psychiatry. 2009a;54(1):6–15. doi: 10.1177/070674370905400104. [DOI] [PubMed] [Google Scholar]
- Dedovic K, Duchesne A, Andrews J, Engert V, Pruessner JC. The brain and the stress axis: the neural correlates of cortisol regulation in response to stress. Neuroimage. 2009b;47(3):864–871. doi: 10.1016/j.neuroimage.2009.05.074. [DOI] [PubMed] [Google Scholar]
- Dedovic K, Renwick R, Mahani NK, Engert V, Lupien SJ, Pruessner JC. The Montreal Imaging Stress Task: using functional imaging to investigate the effects of perceiving and processing psychosocial stress in the human brain. J Psychiatry Neurosci. 2005;30(5):319–325. [PMC free article] [PubMed] [Google Scholar]
- Dedovic K, Rexroth M, Wolff E, Duchesne A, Scherling C, Beaudry T, et al. Neural correlates of processing stressful information: an event-related fMRI study. Brain Res. 2009c;1293:49–60. doi: 10.1016/j.brainres.2009.06.044. [DOI] [PubMed] [Google Scholar]
- Fang P, Li X, Luo JJ, Wang H, Yang XF. A Double-edged Sword: Uric Acid and Neurological Disorders. Brain Disord Ther. 2013;2(2):109. doi: 10.4172/2168-975X.1000109. [DOI] [PMC free article] [PubMed] [Google Scholar]
- Gaab J, Rohleder N, Nater UM, Ehlert U. Psychological determinants of the cortisol stress response: the role of anticipatory cognitive appraisal. Psychoneuroendocrinology. 2005;30(6):599–610. doi: 10.1016/j.psyneuen.2005.02.001. [DOI] [PubMed] [Google Scholar]
- Guerreiro S, Ponceau A, Toulorge D, Martin E, Alvarez-Fischer D, Hirsch EC, et al. Protection of midbrain dopaminergic neurons by the end-product of purine metabolism uric acid: potentiation by low-level depolarization. J Neurochem. 2009;109(4):1118–1128. doi: 10.1111/j.1471-4159.2009.06040.x. [DOI] [PubMed] [Google Scholar]
- Jahangard L, Soroush S, Haghighi M, Ghaleiha A, Bajoghli H, Holsboer-Trachsler E, et al. In a double-blind, randomized and placebo-controlled trial, adjuvant allopurinol improved symptoms of mania in in-patients suffering from bipolar disorder. Eur Neuropsychopharmacol. 2014;24(8):1210–1221. doi: 10.1016/j.euroneuro.2014.05.013. [DOI] [PubMed] [Google Scholar]
- Johnson RJ, Gold MS, Johnson DR, Ishimoto T, Lanaspa MA, Zahniser NR, et al. Attention-deficit/hyperactivity disorder: is it time to reappraise the role of sugar consumption? Postgrad Med. 2011;123(5):39–49. doi: 10.3810/pgm.2011.09.2458. [DOI] [PMC free article] [PubMed] [Google Scholar]
- Kesebir S, Tatlidil Yaylaci E, Suner O, Gultekin BK. Uric acid levels may be a biological marker for the differentiation of unipolar and bipolar disorder: the role of affective temperament. J Affect Disord. 2014;165:131–134. doi: 10.1016/j.jad.2014.04.053. [DOI] [PubMed] [Google Scholar]
- Khalili-Mahani N, Dedovic K, Engert V, Pruessner M, Pruessner JC. Hippocampal activation during a cognitive task is associated with subsequent neuroendocrine and cognitive responses to psychological stress. Hippocampus. 2010;20(2):323–334. doi: 10.1002/hipo.20623. [DOI] [PubMed] [Google Scholar]
- Kirschbaum C, Strasburger CJ, Langkrar J. Attenuated cortisol response to psychological stress but not to CRH or ergometry in young habitual smokers. Pharmacol Biochem Behav. 1993;44(3):527–531. doi: 10.1016/0091-3057(93)90162-m. [DOI] [PubMed] [Google Scholar]
- Kudielka BM, Buske-Kirschbaum A, Hellhammer DH, Kirschbaum C. HPA axis responses to laboratory psychosocial stress in healthy elderly adults, younger adults, and children: impact of age and gender. Psychoneuroendocrinology. 2004;29(1):83–98. doi: 10.1016/s0306-4530(02)00146-4. [DOI] [PubMed] [Google Scholar]
- Lara DR, Lorenzi TM, Borba DL, Silveira LC, Reppold CT. Development and validation of the Combined Emotional and Affective Temperament Scale (CEATS): towards a brief self-rated instrument. J Affect Disord. 2008;111(2–3):320–333. doi: 10.1016/j.jad.2008.07.025. [DOI] [PubMed] [Google Scholar]
- Lorenzi TM, Borba DL, Dutra G, Lara DR. Association of serum uric acid levels with emotional and affective temperaments. J Affect Disord. 2010;121(1–2):161–164. doi: 10.1016/j.jad.2009.05.023. [DOI] [PubMed] [Google Scholar]
- Lyngdoh T, Bochud M, Glaus J, Castelao E, Waeber G, Vollenweider P, et al. Associations of serum uric acid and SLC2A9 variant with depressive and anxiety disorders: a population-based study. PLoS One. 2013;8(10):e76336. doi: 10.1371/journal.pone.0076336. [DOI] [PMC free article] [PubMed] [Google Scholar]
- Machado-Vieira R, Soares JC, Lara DR, Luckenbaugh DA, Busnello JV, Marca G, et al. A double-blind, randomized, placebo-controlled 4-week study on the efficacy and safety of the purinergic agents allopurinol and dipyridamole adjunctive to lithium in acute bipolar mania. J Clin Psychiatry. 2008;69(8):1237–1245. doi: 10.4088/jcp.v69n0806. [DOI] [PMC free article] [PubMed] [Google Scholar]
- Ohno S, Miyata M, Kohjitani A, Tohya A, Ohishi M, Sugiyama K. Associations between blood pressure responses to acute stress and impaired renal function and serum uric acid level. Clin Exp Hypertens. 2015;37(8):656–660. doi: 10.3109/10641963.2015.1047939. [DOI] [PubMed] [Google Scholar]
- Ortiz R, Ulrich H, Zarate CA, Jr, Machado-Vieira R. Purinergic system dysfunction in mood disorders: a key target for developing improved therapeutics. Prog Neuropsychopharmacol Biol Psychiatry. 2015;57:117–131. doi: 10.1016/j.pnpbp.2014.10.016. [DOI] [PMC free article] [PubMed] [Google Scholar]
- Ozten E, Kesebir S, Eryilmaz G, Tarhan N, Karamustafalioglu O. Are uric acid plasma levels different between unipolar depression with and without adult attention deficit hyperactivity disorder? J Affect Disord. 2015;177:114–117. doi: 10.1016/j.jad.2015.01.047. [DOI] [PubMed] [Google Scholar]
- Pruessner JC, Dedovic K, Khalili-Mahani N, Engert V, Pruessner M, Buss C, et al. Deactivation of the limbic system during acute psychosocial stress: evidence from positron emission tomography and functional magnetic resonance imaging studies. Biol Psychiatry. 2008;63(2):234–240. doi: 10.1016/j.biopsych.2007.04.041. [DOI] [PubMed] [Google Scholar]
- Raina MK, Vats A. Serum uric acid, serum cholesterol and personality. J Psychosom Res. 1982;26(3):291–299. doi: 10.1016/0022-3999(82)90001-0. [DOI] [PubMed] [Google Scholar]
- Shibasaki Koichi, Kimura Masatoshi, Ikarashi Ryuichi, Yamaguchi Akira, Watanabe Takuya. Uric acid concentration in saliva and its changes with the patients receiving treatment for hyperuricemia. Metabolomics. 2012;8(3):484–491. doi: 10.1007/s11306-011-0334-z. [DOI] [Google Scholar]
- Soukup M, Biesiada I, Henderson A, Idowu B, Rodeback D, Ridpath L, et al. Salivary uric acid as a noninvasive biomarker of metabolic syndrome. Diabetol Metab Syndr. 2012;4(1):14. doi: 10.1186/1758-5996-4-14. [DOI] [PMC free article] [PubMed] [Google Scholar]
- Sutin AR, Cutler RG, Camandola S, Uda M, Feldman NH, Cucca F, et al. Impulsivity is associated with uric acid: evidence from humans and mice. Biol Psychiatry. 2014;75(1):31–37. doi: 10.1016/j.biopsych.2013.02.024. [DOI] [PMC free article] [PubMed] [Google Scholar]
- van der Werff SJ, van den Berg SM, Pannekoek JN, Elzinga BM, van der Wee NJ. Neuroimaging resilience to stress: a review. Front Behav Neurosci. 2013;7:39. doi: 10.3389/fnbeh.2013.00039. [DOI] [PMC free article] [PubMed] [Google Scholar]
- Wen S, Cheng M, Wang H, Yue J, Wang H, Li G, et al. Serum uric acid levels and the clinical characteristics of depression. Clin Biochem. 2012;45(1–2):49–53. doi: 10.1016/j.clinbiochem.2011.10.010. [DOI] [PubMed] [Google Scholar]
- Wood KH, Ver Hoef LW, Knight DC. Neural mechanisms underlying the conditioned diminution of the unconditioned fear response. Neuroimage. 2012;60(1):787–799. doi: 10.1016/j.neuroimage.2011.12.048. [DOI] [PubMed] [Google Scholar]
- Wood KH, Wheelock MD, Shumen JR, Bowen KH, Ver Hoef LW, Knight DC. Controllability modulates the neural response to predictable but not unpredictable threat in humans. Neuroimage. 2015;119:371–381. doi: 10.1016/j.neuroimage.2015.06.086. [DOI] [PMC free article] [PubMed] [Google Scholar]
- Yu ZF, Bruce-Keller AJ, Goodman Y, Mattson MP. Uric acid protects neurons against excitotoxic and metabolic insults in cell culture, and against focal ischemic brain injury in vivo. J Neurosci Res. 1998;53(5):613–625. doi: 10.1002/(SICI)1097-4547(19980901)53:5<613::AID-JNR11>3.0.CO;2-1. [DOI] [PubMed] [Google Scholar]