

Abstract
Background
Altered brain connectivity is implicated in the development and clinical burden of schizophrenia. Relative to matched controls, schizophrenia patients show (1) a global and regional reduction in the integrity of the brain's white matter (WM), assessed using diffusion tensor imaging (DTI) fractional anisotropy (FA), and (2) accelerated age‐related decline in FA values. In the largest mega‐analysis to date, we tested if differences in the trajectories of WM tract development influenced patient–control differences in FA. We also assessed if specific tracts showed exacerbated decline with aging.
Methods
Three cohorts of schizophrenia patients (total n = 177) and controls (total n = 249; age = 18‐61 years) were ascertained with three 3T Siemens MRI scanners. Whole‐brain and regional FA values were extracted using ENIGMA‐DTI protocols. Statistics were evaluated using mega‐ and meta‐analyses to detect effects of diagnosis and age‐by‐diagnosis interactions.
Results
In mega‐analysis of whole‐brain averaged FA, schizophrenia patients had lower FA (P = 10−11) and faster age‐related decline in FA (P = 0.02) compared with controls. Tract‐specific heterochronicity measures, that is, abnormal rates of adolescent maturation and aging explained approximately 50% of the regional variance effects of diagnosis and age‐by‐diagnosis interaction in patients. Interactive, three‐dimensional visualization of the results is available at http://www.enigma-viewer.org.
Conclusion
WM tracts that mature later in life appeared more sensitive to the pathophysiology of schizophrenia and were more susceptible to faster age‐related decline in FA values. Hum Brain Mapp 37:4673–4688, 2016. © 2016 Wiley Periodicals, Inc.
Keywords: DTI, schizophrenia, aging
INTRODUCTION
The genetic and environmental risk factors for schizophrenia may disproportionately affect brain areas with prolonged maturation, while sparing brain areas that develop soon after birth [Kochunov and Hong, 2014]. Cerebral white matter (WM) may especially be at risk of abnormal development, as many fiber tracts continue to develop into mid‐adulthood, well past the average age of onset of schizophrenia [Flechsig, 1901; Kochunov and Hong, 2014; Yakovlev and Lecours, 1967]. The development of WM tracts is “heterochronic”: difference in timing of development and senescence among white matter regions. For example, motor and sensory white matter bundles become fully myelinated soon after birth [Gao et al., 2009; Yakovlev and Lecours, 1967] while multimodal associative fibers continue to develop into the fourth decade of life (Fig. 1) [Bartzokis, 2004; Bartzokis et al., 2010; Flechsig, 1901; Kochunov et al., 2010a, 2011a; Yakovlev and Lecours, 1967]. Age‐related decline shows a reverse trend: multimodal associative fibers decline rapidly with age despite reaching peak myelination later in life [Bartzokis, 2004; Bartzokis et al., 2003; Flechsig, 1901; Yakovlev and Lecours, 1967]. We hypothesized that WM areas that develop past the age of onset of schizophrenia and into adulthood will show larger patient–control differences as development past the age of onset will make them more vulnerable to schizophrenia risk factors and the disease itself. Second, we hypothesized that age‐related decline would be accelerated in WM areas that develop later in life. The second hypothesis is based on the findings that later myelinated areas such as frontal WM are more vulnerable to chronic age‐related illnesses such as hypertension, heart disorders and neurodegenerative disorders [Bartzokis, 2004; Bartzokis et al., 2003; Kochunov et al., 2010b, 2011b]. Schizophrenia may increase individual risks for accelerated aging [Ito and Barnes, 2009; Jeste et al., 2011; Kirkpatrick et al., 2008] due to increased rate of diseases commonly associated with aging including cardiovascular disease, type‐2‐diabetes, and other [Hennekens et al., 2005]. Schizophrenia patients have increased mortality rate and shorter (by as much as twenty years) average lifespan even after accounting for suicide [Brown, 1997; Kirkpatrick et al., 2008; Saha et al., 2007; Tsuang and Woolson, 1978]. We tested these hypotheses by mapping patient–control differences and accelerated WM aging in patients using diffusion tensor imaging (DTI) fractional anisotropy (FA) values. We measured patient–control DTI‐FA differences and related them to previously published normative rates of cross‐sectional regional DTI‐FA maturation and decline calculated from a large group (N = 831) of healthy individuals ages ranged from 11 to 90 that had no overlap with the present sample [Kochunov et al., 2011a] (Table 1; Supporting Information Fig. S1).
Figure 1.
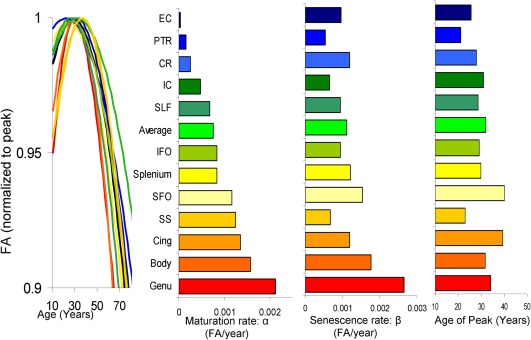
Regional heterochronicity of white matter development color‐coded based on the rate of normal maturation during adolescence (top row). These measurements were derived using FA extracted from a large (N = 831) cross‐sectional sample of normal subjects (age range = 11–90 years) and presented in Kochunov et al. [2012b]. [Color figure can be viewed at http://wileyonlinelibrary.com]
Table 1.
White matter tracts used in the analysis (C = Commissural, P = Projection, A = Association)
| Area | Fiber type | Connections | Rate of maturation (*10−4 FA/year) | Rate of senescence (*10−4 FA/year) | Age of peak (years) |
|---|---|---|---|---|---|
| Average FA values | 7.5 | 11.7 | 32.1 | ||
| Genu of Corpus Callosum (GCC) | C/A | Cerebral Hemispheres | 21.3 | 26.5 | 34.2 |
| Body of Corpus Callosum (BCC) | C/A | Cerebral Hemispheres | 14.7 | 17.6 | 31.8 |
| Splenium of Corpus Callosum (SCC) | C/A | Cerebral Hemispheres | 8.4 | 12.1 | 29.9 |
| Cingulum (Cing) | A | Cingulate Gyrus/Hippocampus | 13.6 | 12.0 | 39.4 |
| Corona Radiata (CR) | P | Cortical/Subcortical | 2.5 | 12.0 | 27.9 |
| External Capsule (EC) | A | Frontal/Temporal/Occipital | 0.3 | 9.7 | 25.6 |
| Internal Capsule (IC) | P | Subcortical/Brainstem/Cortex | 10.9 | 14.5 | 31.0 |
| Superior Frontal‐Occipital (SFO) | A | Frontal/Parietal/Occipital | 11.7 | 15.3 | 40.1 |
| Inferior Frontal Occipital (IFO) | A | Frontal/Parietal/Occipital | 8.3 | 9.4 | 29.1 |
| Posterior Thalamic Radiation (PTR) | P | Thalamus/Cortex | 1.5 | 5.4 | 28.8 |
| Sagittal Stratum (SS) | A/P | Occipital/Temporal | 12.4 | 6.7 | 23.1 |
| Superior Longitudinal Fasciculus (SLF) | A | Frontal/Temporal/Occipital | 6.8 | 9.4 | 28.8 |
The rates of normal, age‐related maturation, age‐of‐peak and the rate of age‐related decline were taken from [Kochunov et al., 2012b].
WM integrity's rise during development is followed by a peak and age‐related decline. WM development and aging trends are regionally heterochronic and some development continues into the fourth decade [Flechsig, 1901; Kochunov et al., 2012b; Yakovlev and Lecours, 1967] (Fig. 1) [Ben Bashat et al., 2005; Flechsig, 1901; Gao et al., 2009; Kochunov et al., 2011a, 2012b]. These regional differences in timing of development and aging in healthy populations have been mapped non‐invasively using DTI‐FA values [Hasan et al., 2009a, 2009b; Kochunov et al., 2012b]. FA describes the directional selectivity of the random diffusion of water molecules [Basser, 1994; Conturo et al., 1996; Pierpaoli and Basser, 1996; Ulug et al., 1995]. Higher FA values are observed in heavily myelinated WM tracts [Pierpaoli and Basser, 1996], but absolute WM FA values are sensitive to myelination levels, the degree of intra‐voxel fiber crossing, axonal density and average axonal diameter [Beaulieu, 2002; Jones et al., 2013]. Changes in regional FA values during normal maturation, aging, and brain disorders are often attributed changes in myelination [Budde et al., 2007; Madler et al., 2008; Song et al., 2003, 2005]. Nonetheless, the DTI‐FA is neither a direct measurement of myelination nor of white matter integrity [Jones et al., 2013]. Instead, FA is a convenient index sensitive to the anisotropy of the water diffusion, created by intra‐axonal flow and the barriers of cellular membranes, especially the myelin layer of the axonal cell membranes [Pierpaoli and Basser, 1996].
Reduced fractional anisotropy (FA) emerged as a highly consistent finding in schizophrenia [Alba‐Ferrara and de Erausquin, 2013; Ellison‐Wright and Bullmore, 2009; Friedman et al., 2008; Glahn et al., 2013; Kubicki et al., 2007; Nazeri et al., 2012; Perez‐Iglesias et al., 2011; Phillips et al., 2012; Wright et al., 2015]. Additional evidence to support our hypothesis includes reports that findings of lower FA values are more commonly observed in multimodal WM areas such as the frontal WM including the genu of corpus callosum versus motor and sensory areas [Ellison‐Wright and Bullmore, 2009; Friedman et al., 2008; Kubicki et al., 2007; Nazeri et al., 2012; Perez‐Iglesias et al., 2011], even in young and unmedicated patients [Bloemen et al., 2010; Carletti et al., 2012; Karlsgodt et al., 2009]. Likewise there is evidence for accelerated decline in FA values in patients in multimodal WM areas including associative fibers in the corpus callosum [Friedman et al., 2008; Kochunov et al., 2012a, 2014a; Mori et al., 2007], a finding not observed in major depression [Kochunov et al., 2012a]. A challenge for testing this hypothesis is the need for a large sample to calculate the pattern of schizophrenia‐related regional differences in FA, making it necessary to combine imaging data collected on multiple scanners. We used a mega‐analysis approach developed by the ENIGMA‐DTI workgroup [Jahanshad et al., 2013] to pool data from three independent cohorts. Besides the differences in imaging scanners, the overall ascertainment, clinical assessments, and control group recruitment used the same clinical methods across the three cohorts.
The mega‐analysis developed by the ENIGMA‐DTI working group uses data homogenization to create a single aggregated population by combining data across all cohorts. We previously used it to aggregate data across multiple cohorts [Van Erp et al., 2015]; the mega‐analytic estimates of brain differences were able to independently predict findings in later studies [Kochunov et al., 2015a, 2015b]. We performed traditional meta‐analysis by aggregating statistics from each separate cohort, which may be viewed as a more conservative approach. For each hypothesis test, we compared the performance of the mega‐analysis to that of the meta‐analysis. We tested whether findings were consistent across three cohorts analyzed independently.
METHODS
Subjects
We tested the study's hypotheses in three cohorts of subjects. All data were acquired at the Maryland Psychiatric Research Center (MPRC) over the last decade (2004–2015), each with its own healthy control group. The cohorts reflect the evolution of the imaging technology (cohort A is the most recent; cohort C was the first collected). No subject was included in more than one of the three cohorts. If a participant was initially in more than one cohort, only the latest scan was used. Uniform clinical assessment and exclusion criteria were equivalent across the three cohorts. Informed written consents, approved by the local Internal Review Boards, were obtained from all participants.
All participants were 18–61 years old, with no current or past neurological conditions or major medical conditions. Patient participants were diagnosed with either schizophrenia or schizoaffective disorder as determined by the Structured Clinical Interview for DSM‐IV or IV‐TR (SCID). Controls had no past or present Axis I psychiatric disorder as determined with the SCID. Participants were excluded if they had DSM‐IV substance abuse in the last 3 months (except nicotine) or substance dependence within the past 6 months. Other exclusion criteria included diagnosis with uncontrolled hypertension, type 2 diabetes, heart disorders, or a major neurological event such as stroke or transient ischemic attack. All patients underwent a uniform psychiatric interview that included Brief Psychiatric Rating Scale (BPRS) assessment of clinical symptoms. Only current medication dose was recorded. The current medication use was converted to chlorpromazine equivalence. The data analyzed by this manuscript was collected under three research protocols. Here, we presented only the data that was available for all subjects across the protocols.
Cohort A
Subjects
This cohort included 205 participants (105/101 males/females, average age = 35.3 ± 13.6 years, range = 18‐61) (Table 2). Among them were 65 patients diagnosed with schizophrenia (44/21 males/females, age = 34.6 ± 13.7 years) and 140 healthy controls (61/79 males/females, age 35.6 ± 13.8 years). Additional clinical and epidemiological information is provided in Table 2.
Table 2.
Subject demographics for three cohorts
| Average age, range (years) | BPRS | Age‐of‐onset (years) | Illness duration (years) |
Education (year) |
IQ |
Handedness (% right) |
Medication dose (CPZ) |
Current smokers | FTND | DSST processing speed | ||
|---|---|---|---|---|---|---|---|---|---|---|---|---|
| Cohort A | Patients (44M/21F) |
34.6 ± 13.7 18–61 |
30.7 ± 11.0 | 18.1 ± 8.5 | 21.5 ± 15.1 | 13.0 ± 2.0 | 91.1 ± 15.5 | 90.2 | 400.5 ± 352.2 | 29% | 4.2 ± 2.1 | 55.2 ± 15.7 |
| Controls (61M/79F) |
35.6 ± 14.4 18–61 |
n/a | n/a | n/a | 14.0 ± 2.5 | 97.8 ± 18.5 | 98.0 | n/a | 27% | 4.1 ± 2.1 | 73.5 ± 15.6 | |
| P value | 0.6 | n/a | n/a | n/a | 0.003 | 0.06 | 0.15 | n/a | 0.9 | 0.3 | 10−10 | |
| Cohort B | Patients (61M/62F) |
35.3 ± 9.5 20–61 |
30.7 ± 9.5 | 18.9 ± 7.8 | 20.1 ± 13.7 | 13.0 ± 2.2 | n/c | 83.0 | 630.5 ± 544.2 | 55% | 5.1 ± 2.3 | 47.3 ± 11.3 |
| Controls (31M/45F) |
40.3 ± 11.9 20–61 |
n/a | n/a | n/a | 14.5 ± 2.5 | n/c | 88.3 | n/a | 35% | 5.3 ± 2.2 | 64.9 ± 11.6 | |
| P value | 0.006 | n/a | n/a | n/a | 0.001 | n/c | 0.43 | n/a | 0.15 | 0.1 | 10−9 | |
| Cohort C | Patients (50M/13F) |
37.7 ± 12.5 18–61 |
31.2 ± 8.5 | 18.5 ± 7.5 | 19.7 ± 13.6 | 12.2 ± 2.2 | n/c | 87.8 | 453.5 ± 371.6 | 68% | 4.7 ± 2.5 | 51.6 ± 14.9 |
| Controls (27M/18F) |
39.1 ± 13.8 20–61 |
n/a | n/a | n/a | 14.9 ± 2.5 | n/c | 88.1 | n/a | 44% | 4.5 ± 2.6 | 68.9 ± 14.6 | |
| P value | 0.60 | n/a | n/a | n/a | 0.001 | n/c | 0.83 | n/a | 0.01 | 0.5 | 10−7 |
The severity of psychiatric symptoms was ascertained using Brief Psychiatric Rating Scale (BPRS). Medical dose is provided in chlorpromazine equivalent dose (mg/day). The severity of tobacco dependence was ascertained using the Fagerstrom Test for Nicotine Dependence (FTDN). Processing speed measurements were performed using digit symbol substitution task (DSST). IQ data was only collected in Cohort A.
Diffusion tensor MR imaging
Imaging data was collected using a Siemens 3T TRIO MRI (Erlangen, Germany), running VB17 software and equipped with a 32‐channel RF head coil. DTI data was collected using a spin‐echo, EPI sequence with a spatial resolution of 1.7 × 1.7 × 3.0 mm. The sequence parameters were: TE/TR = 87/8,000 ms, FOV = 200 mm, axial slice orientation with 50 slices and no gaps, 64 isotropically distributed diffusion weighted directions, two diffusion weighting values (b = 0 and 700 s/mm2) and five b = 0 images. Subjects' head movement was minimized with restraining padding.
Cohort B
Subjects
Cohort B included a total of 113 (61/52 males/females, average age = 38.5 ± 11.3 years, range = 18–61) individuals (Table 2). Among them 49 (33/16 males/females, age = 35.3 ± 9.5 years) were patients and 64 (27/37 males/females, age 40.3.0 ± 11.9 years) were healthy controls (Table 2). Additional clinical and epidemiological information is provided in Table 2.
Diffusion tensor MR imaging
Imaging data was collected using a Siemens 3T TRIO MRI (Erlangen, Germany), running VB13 software and equipped with a 12‐channel RF head coil. DTI data was collected using a spin‐echo, EPI sequence with a spatial resolution of 1.8 × 1.8 × 3.0 mm. Sequence parameters were: TE/TR = 92/6700 ms, FOV = 210 mm, axial slice orientation with 49 slices and no gaps, 30 isotropically distributed diffusion weighted directions, two diffusion weighting values (b = 0 and 1,000 s/mm2) and three b = 0 values. Head movement was minimized with restraining padding.
Cohort C
Subjects
Cohort C included a total of 108 individuals (77/31 males/females, average age = 38.3 ± 13.0 years, range = 18–61; Table 2). Among them were 63 patients (50/13 males/females, age = 37.7 ± 12.5 years), and 45 (27/18 males/females, age 39.1 ± 13.8 years) were healthy controls (Table 2). Controls were recruited through media advertisements. Additional clinical and epidemiological information is provided in Table 2.
Diffusion tensor MR imaging
Imaging data was collected using a Siemens 3T Allegra MRI (Erlangen, Germany) running VA19 software and using a spin‐echo, EPI sequence with a spatial resolution of 1.7 × 1.7 × 4.0 mm. The sequence parameters were: TE/TR = 87/5,000 ms, FOV = 200 mm, axial slice orientation with 35 slices and no gaps, 12 isotropically distributed diffusion weighted directions, and 2 diffusion weighting values (b = 0 and 1,000 s/mm2). The entire protocol was repeated five times to improve signal‐to‐noise ratio. Head movement was minimized with restraining padding and an individually fitted bite‐bar. DTI data from this cohort has been used in a prior study of accelerated aging [Kochunov et al., 2012a]. We re‐examined the mega‐analysis results with and without this cohort and global and regional age‐by‐diagnosis interactions remained consistent.
Image Processing
DTI data for all three cohorts was processed using the ENIGMA‐DTI analysis pipeline (http://enigma.ini.usc.edu/ongoing/dti-working-group/), which includes quality control and assurance QC/QA steps [Jahanshad et al., 2013]. Briefly, the DTI data were corrected for motion and eddy current distortions using the eddy correction tool distributed as a part of FMRIB Software Library (FSL) package [Smith et al., 2006]. FA maps were generated by voxel‐wise fitting of the local diffusion tensor. Next, individual FA maps were warped to an ENIGMA‐DTI template and projected onto the ENIGMA‐DTI skeleton that represents the middle of the tract of major white matter structures. ENIGMA‐DTI per‐tract average values were calculated by averaging values along tract regions of interest in both hemispheres. Overall average FA values were calculated by averaging values for the entire white matter skeleton, including the tract regions of interest and also more peripheral white matter. DTI data is sensitive to artifacts brought about by subject's motion [Yendiki et al., 2014]. All data included in the analysis passed the ENIGMA‐DTI QA/QC. The QA/QC steps included: visual inspection of raw and FA images, followed by calculating the average subject motion per frame and the average projection distance onto the skeleton. Seven individual datasets, four from cohort A and three from cohort B, were removed from the analysis. Four datasets (two each from cohorts A and B) were removed as they exceeded the recommended threshold of 2.5 mm for the average motion per DTI frame [Acheson et al., In Review]. There was no significant difference in the head motion between patient and controls in each cohort (P = 0.6, 0.4 and 0.7 for cohorts A, B and C). Three data sets, from cohort B, were removed due to poor spatial normalization quality, with an average projection distance greater than 3.7 mm [Acheson et al., In Review]. There was no significant difference in the projection distance patient and controls in each sample (all P > 0.5).
Statistical Analyses
The two hypotheses were tested first using the mega and then using meta‐statistical analyses. The first set of analyses quantified patient–control differences in FA values across different WM areas. The second set of analyses examined age‐related decline in FA values. In both analyses, the patient–control differences and the age‐related declines were compared with the normal rate of FA changes in different WM areas. The mega‐analysis normalizes data from each cohort to remove scanner‐and‐cohort related biases in FA values (Table S1, Supporting Information) and then pools all the data together [Kochunov et al., 2014b]. We used the mega‐analysis, developed by ENIGMA‐DTI workgroup [Jahanshad et al., 2013; Kochunov et al., 2014b] and implemented in the SOLAR‐Eclipse software (http://www.nitrc.org/projects/se_linux). A classical meta‐analysis was performed as a validation to demonstrate agreement between mega‐ and meta‐analytical approaches of pooling data. We also repeated analyses in the three cohorts separately to examine if large biases arose from any particular cohort.
The significance of regional findings was corrected for multiple (N = 12) comparisons using Bonferroni correction. Findings with 0.0042 < P ≤ 0.05 were deemed suggestively significant.
All significance testing was performed assuming two‐tailed distribution. The significance of regional findings was corrected for multiple (N = 12) comparisons using Bonferroni correction. Findings with 0.0042 < P ≤ 0.05 were deemed suggestively significant.
Patient–Control FA Differences
Mega‐analysis
The ENIGMA‐DTI mega‐analysis algorithm was used to combine the data into a single population following regression of nuisance covariates and data homogenization [Kochunov et al., 2014b] (Supporting Information Fig. S2). The ENIGMA‐DTI mega‐analysis uses two normalization steps: regression of covariates, per cohort, followed by the per‐cohort inverse Gaussian normalization of data (Supporting Information Fig. S2‐II). This produced the mega‐analytic sample for testing the model described in Eq. (1):
| (1) |
where age, sex, age2, age × sex, age2 × sex were treated as cohort‐specific covariates.
An example of this analysis is shown in Figure 2. The average FA values follow a non‐linear trend with age. Mega‐analysis removes the quadratic age effects and thus producing linear patient–control differences in the aging trend (Fig. 2). The linear DX × Age model [Eq. (1)] may not account for non‐linear aging differences between patients and controls. Therefore, we repeated DX × Age analyses in subjects older than the age‐of‐peak for the respective track. This analysis had different number of subjects for each track. This approach captures the mostly linear down‐slope of the aging‐related decline to re‐assess the Dx × age effect. The goal of this ad‐hoc analysis was to study consistency between β DX × Age coefficients obtained using this approach and these obtained using the full sample.
Figure 2.
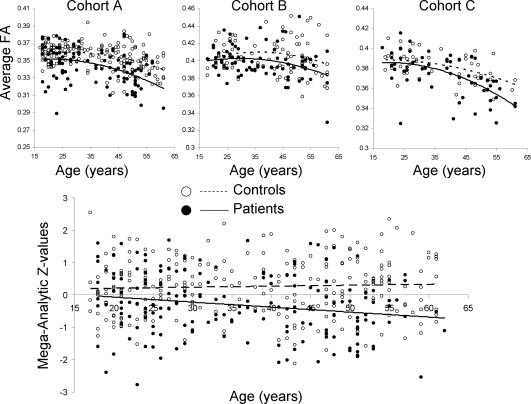
Mega‐analytic analysis of the effects of diagnosis (DX) and DX by age interaction. The non‐linear aging trends in FA values are regressed in each cohort separately, thus producing linear trends of patient–control differences in aging.
Individual cohort analyses
The DX and DX × Age modeling in individual cohorts was also performed as a part of the meta‐analyses in each cohort independently (Supporting Information Fig. S2‐II, bottom panel)
| (2) |
The results were then used for the meta‐analytical calculation of the overall effect (Supporting Information Fig. S2‐II, bottom panel). The cohort‐specific modeling was performed using the R software using the lm function and maximum likelihood algorithm [R‐Development‐Core‐Team, 2009].
Meta‐analysis
The significance of the βDX for each individual cohort was converted to Z‐score statistics (Supporting Information Fig. S2‐II, bottom panel). The meta‐analytical significance was calculated from the Z Meta values obtained using the square‐root of N‐weighted Stouffer method [Stouffer, 1949], [Eq. (3)]:
| (3) |
where Z i and N i are the z‐value and sample size for cohort “i”. The Stouffer meta‐analysis method assigns greater weight to larger cohorts. It is reduced to the arithmetic mean of Z‐values per cohort when the sample sizes are all equal.
Effects of symptom‐severity, medication dosage, and smoking on FA values
Post‐hoc exploratory analyses were performed within the patients only to estimate effects of symptom severity and medication dose in the mega‐analytic sample and for each cohort separately. Symptom severity was expressed as BPRS scores (coefficient β BPRS), and medication dose at the time of the imaging expressed as milligram chlorpromazine equivalents calculated using the method described elsewhere [Van Erp et al., 2015] (CPZ; coefficient β CPZ). Models included nuisance effects as above. The statistical effects of smoking on FA values were analyzed in the mega‐sample population and each cohort separately with a binary variable (SMK) 1 for smoker, 0 for non‐smoker, including nuisance effects mentioned above.
RESULTS
Effect of Diagnosis on the Global and Regional FA Values
Significant β DX was observed during mega‐analytic modeling of the effect of diagnosis on average FA (P = 1.3 × 10⁻¹³), as well as in all three cohorts analyzed separately. The meta‐analysis results showed similar significance (P = 1.1 × 10⁻¹¹) (Table 3). Interactive, three‐dimensional (3D) visualization of the results is available at http://www.enigma-viewer.org.
Table 3.
The βDX ± standard errors are shown, following multiplication by (−1 × 10²) factor, with the corresponding P‐values for the whole‐brain and regional analysis of impact of diagnosis on white matter FA values
| Cohort A | Cohort B | Cohort C | Mega | Meta | |
|---|---|---|---|---|---|
| Average | 1.21 ± 0.21 ( P = 3.0E‐08) | 0.91 ± 0.31 ( P = 4E‐03) | 0.85 ± 0.35 ( P = 6E‐03) | 1.1 ± 0.1 ( P = 1E‐11) | P = 2E‐10 |
| Genu of Corpus Callosum (GCC) | 2.8 ± 0.50 ( P = 1.0E‐07) | 2.74 ± 0.91 (P = 8E‐03) | 2.2 ± 0.88 ( P = 3E‐03) | 2.5 ± 0.4 ( P = 1E‐10) | P = 8E‐10 |
| Body of Corpus Callosum (BCC) | 3.81 ± 0.71 ( P = 1E‐07) | 2.5 ± 0.80 (P = 0.06) | 1.6 ± 1.2 (P = 4E‐03) | 2.4 ± 0.5 ( P = 8.0E‐08) | P = 1E‐07 |
| Splenium of Corpus Callosum (SCC) | 2.24 ± 0.40 ( P = 9E‐08) | 1.02 ± 1.05 (P = 0.3) | 0.65 ± 0.8 (P = 0.15) | 1.50 ± 0.3 ( P = 4E‐06) | P = 7E‐05 |
| Cingulum (Cing) | 1.50 ± 0.43 ( P = 4E‐05) | 0.50 ± 0.70 (P = 0.2) | 1.45 ± 0.81 (P = 0.1) | 1.2 ± 0.3 ( P = 1E‐05) | P = 8E‐05 |
| Corona Radiata (CR) | 1.70 ± 0.40 ( P = 9E‐11) | 1.4 ± 0.7 (P = 0.01) | 0.45 ± 0.30 (P = 0.03) | 1.5 ± 0.2 ( P = 3E‐11) | P = 3E‐10 |
| Internal Capsule (IC) | 2.51 ± 0.43 ( P = 2E‐09) | 1.94 ± 0.68 (P = 0.04) | 1.2 ± 0.50 ( P = 2E‐03) | 0.9 ± 0.2 ( P = 1E‐5) | P = 2.0E‐5 |
| External Capsule (EC) | 1.50 ± 0.35 ( P = 1E‐06) | 1.41 ± 0.44 (P = 0.05) | 0.90 ± 0.45 ( P = 2.5E‐03) | 1.2 ± 0.2 ( P = 2E‐9) | P = 2E‐08 |
| Superior Frontal‐Occipital (SFO) | 2.2 ± 0.45 ( P = 3E‐07) | 1.8 ± 0.65 ( P = 3E‐04) | 2.40 ± 0.60 (P = 0.01) | 2.0 ± 0.3 ( P = 8E‐11) | P = 1E‐9 |
| Inferior Frontal Occipital (IFO) | 1.51 ± 0.51 ( P = 4E‐03) | 0.21 ± 0.81 (P = 0.15) | 1.00 ± 0.75 (P = 0.5) | 1.0 ± 0.40 ( P = 3E‐03) | P = 0.008 |
| Posterior Thalamic Radiation (PTR) | 1.48 ± 0.45 ( P = 2.5E‐04) | 0.5 ± 0.60 (P = 0.07) | 2.2 ± 0.87 (P = 0.1) | 1.1 ± 0.2 ( P = 1E‐05) | P = 7E‐05 |
| Sagittal Stratum (SS) | 2.1 ± 0.39 ( P = 6E‐08) | 1.62 ± 0.65 (P = 0.04) | 1.3 ± 0.57 (P = 0.01) | 1.7 ± 0.3 ( P = 4E‐10) | P = 1E‐9 |
| Superior Longitudinal Fasciculus (SLF) | 1.45 ± 0.35 ( P = 3E‐05) | 1.35 ± 0.50 (P = 0.05) | 1.40 ± 0.6 (P = 0.01) | 1.1 ± 0.2 ( P = 7E‐07) | P = 1E‐06 |
The β DX values indicate (Control – Patient)/100 difference, in FA values. Bolded values are significant after correcting for multiple (N = 12) comparisons. Nominally significant values are shown in italic.
Regional mega‐analytic β DX coefficients were significantly correlated with both the rate of normal FA development (r = 0.83, R 2 = 68.4%, P = 0.001) and the rate of normal FA decline (r = 0.76, R 2 = 58.0%), P = 0.005), the correlation with age of peak for FA values was positive but not statistically significant (r = 0.35, P = 0.2) (Fig. 2).
Effect of Age‐by‐Diagnoses Interaction on the Global and Regional FA Values
The mega‐analysis showed a significant age‐by‐diagnoses interaction for global FA (P = 0.02), which suggested accelerated decline in FA values in patients compared with controls (Table 4). Meta‐analysis showed a similar result (P = 0.04). Similar trends in β Age×DX effects were observed in all three cohorts separately (marginally significant in cohorts A and C (P = 0.04 for average FA) but not in cohort B (P = 0.3) (Fig. 3, Table 4). Significant (after correcting for multiple comparisons) mega‐analytic β Age×DX coefficients were observed for the genu and body of corpus callosum and corona radiata tract. No significant mega‐analytic age‐by‐diagnosis interactions were observed for the following areas: internal capsule, superior longitudinal fasciculus, posterior thalamic radiation, and inferior and superior longitudinal fasciculi (Table 4). The regional contrast between the mega‐analytical age‐by‐diagnoses trends is shown for genu of corpus callosum and posterior thalamic radiation (Supporting Information Fig. S3). Following the removal of age and age2 covariates, the normal controls and patients show diverging trends with age.
Table 4.
The β Age×DX ± standard error (P‐values) are shown, after multiplication by −104 scaling factor, for whole‐brain and regional analysis of accelerated (FA units/year) decline with in patients (DX = 1)
| Cohort A | Cohort B | Cohort C | Mega | Meta | |
|---|---|---|---|---|---|
| Average | 1.60 ± 0.8 ( P = 0.04) | 1.23 ± 1.40 (P = 0.3) | 1.45 ± 1.15 ( P = 0.04) | 1.22 ± 0.63 ( P = 0.02) | P = 0.04 |
| Genu of Corpus Callosum (GCC) | 5.4 ± 1.9 ( P = 4.0E‐03) | 7.2 ± 3.8 (P = 0.05) | 4.10 ± 3.5 (P = 0.09) | 4.4 ± 1.5 ( P = 0.004) | P = 0.01 |
| Body of Corpus Callosum (BCC) | 12.3 ± 2.5 ( P = 5.0E‐05) | 8.4 ± 3.6 (P = 0.01) | 0.5 ± 3.9 (P = 0.5) | 5.0 ± 2.0 (P = 1.0E‐04) | P = 1E‐03 |
| Splenium of Corpus Callosum (SCC) | 3.38 ± 1.5 (P = 0.01) | 7.6 ± 4.0 (P = 0.03) | 4.93 ± 2.97 (P = 0.05) | 2.9 ± 1.3 (P = 0.01) | P = 0.03 |
| Cingulum (Cing) | 3.6 ± 1.7 ( P = 1E‐03) | 5.1 ± 2.6 ( P = 1E‐03) | −0.19 ± 2.61 (P = 0.5) | 2.7 ± 1.25 (P = 0.02) | P = 0.02 |
| Corona Radiata (CR) | 3.8 ± 1.2 ( P = 1E‐03) | 2.1 ± 1.5 (P = 0.01) | 3.20 ± 1.96 (P = 0.04) | 2.7 ± 0.92 ( P = 1.0E‐03) | P = 2.0E‐03 |
| Internal Capsule (IC) | 3.3 ± 1.20 (P = 8.0E‐03) | 3.5 ± 2.1 (P = 0.07) | 1.12 ± 1.67 (P = 0.3) | 0.4 ± 0.9 (P = 0.4) | P = 0.05 |
| External Capsule (EC) | 2.5 ± 1.1 ( P = 1E‐03) | 1.2 ± 1.8 (P = 0.28) | 0.21 ± 1.73 (P = 0.45) | 1.6 ± 0.81 (P = 0.04) | P = 0.07 |
| Superior Frontal‐Occipital (SFO) | 2.1 ± 1.2 (P = 0.01) | 2.6 ± 2.6 (P = 0.2) | 2.06 ± 2.51 (P = 0.21) | 2.9 ± 1.2 (P = 0.01 ) | P = 0.02 |
| Inferior Frontal Occipital (IFO) | 5.1 ± 2.3 ( P = 1.3E‐03) | −3.0 ± 3.5 (P = 0.8) | 0.60 ± 3.12 (P = 0.42) | 1.9 ± 1.6(P = 0.1) | P = 0.2 |
| Posterior Thalamic Radiation (PTR) | 0.4 ± 1.2 (P = 0.4) | 1.1 ± 2.4 (P = 0.3) | 7.43 ± 3.30 (P = 0.01) | 0.9 ± 1.37 (P = 0.2) | P = 0.2 |
| Sagittal Stratum (SS) | 1.07 ± 1.5 (P = 0.4) | 1.7 ± 2.5 (P = 0.2) | 5.03 ± 2.11 (P = 0.01) | 1.8 ± 1.1 (P = 0.05) | P = 0.1 |
| Superior Longitudinal Fasciculus (SLF) | 1.2 ± 1.3 (P = 0.3) | 0.6 ± 1.8 (P = 0.6) | 3.99 ± 1.97 (P = 0.02) | 1.2 ± 0.89 (P = 0.1) | P = 0.15 |
Higher, positive βAge×DX values indicate greater decline with age. Bolded values are significant after correcting for multiple (N = 12) comparisons. Nominally significant values are shown in italic.
Figure 3.

Mega‐analytic estimates of patient control differences (top row) and accelerated aging (bottom row) are plotted versus the rates of normal development and decline and age of peak for FA values derived from a large cohort (N = 831) of normal subjects aged 11–90 years [Kochunov et al., 2012b]. [Color figure can be viewed at http://wileyonlinelibrary.com]
Regional mega‐analytic β Age×DX coefficients, were significantly correlated with both the rate of normal FA development and the rate of normal FA decline (r = 0.69, R 2 = 49.0% and 0.80%, R 2 = 64.0% P < 0.05, respectively) in WM regions. The correlation with age of peak for FA values was positive but not statistically significant (r = 0.46, P = 0.09) (Fig. 3, bottom row).
The regional mega‐analytic β Age×DX coefficients recalculated in subjects older than the age‐of‐peak for respective tracts were highly correlated with the β Age×DX coefficients obtained the full sample (r = 0.84, P = 0.0006) (Supporting Information Table S2; Supporting Information Fig. S4). However, the overall significance of the age‐by‐diagnosis interaction was reduced due to smaller number of subjects, for example, less than half of the subjects (N = 229) were older than age‐of‐peak of 34 years for the genu of corpus callosum (Table S4, Supporting Information). The mega‐analytic estimates of accelerated aging calculated past the age‐of‐peak for each area were significantly correlated with the rates of normal development (r = 0.70, R 2 = 0.49, P = 0.015) and decline (r = 0.69, R 2 = 0.48, P = 0.016) and the age of peak (r = 0.73, R 2 = 0.53, P = 0.01) (Supporting Information Fig. S5).
Effects of Symptom‐Severity, Age‐of‐Onset, Disorder Duration, Medication Dosage, and Smoking on FA Values
We detected no significant effects of symptom severity, expressed as BPRS scores, on the FA values in patients for any of the three cohorts. There were no significant effects of age‐of‐onset and disorder duration on FA values following the regression of linear and quadratic effects of the age. There were no significant effects of medication dosage on the patients' FA values at the time of imaging (Supporting Information Table S3). Likewise, no significant effect of smoking was detected.
Comparisons Between Regional Mega‐ Versus Meta‐Analytic Estimates
We performed a linear regression analysis to statistically compare effect sizes calculated using mega‐analytic data pooling to that of the classical meta‐analytic approach. Calculated effect sizes for diagnosis and age‐by‐diagnosis interaction were in excellent agreement (r > 0.96) with mega‐analytic estimates showing slightly (∼5%) improved significance (lower P‐values).
We repeated the mega‐analysis of patient–control differences and aging trends by excluding subjects from cohort C who had been analyzed in our previous work to show accelerated aging in schizophrenia patients [Kochunov et al., 2012a]. Mega‐analytic estimates for cohorts A and B showed excellent agreement (r > 0.9) with the mega‐analytic estimates in all three cohorts (Supporting Information Fig. S6), suggesting that the patient–control and accelerated aging trends were in good agreement among cohorts.
DISCUSSION
In this largest schizophrenia DTI analysis to date, we observed regional variations in the level of patient–control FA deficits and accelerated decline of FA values in cerebral white matter (WM) with age in patients. These effects may results from the heterochronicity—or differential timing—of normal maturation and aging of cerebral WM. FA deficits in patients are more typically reported in WM tracts associated with higher cognitive function rather than in those that carry primary motor and sensory information [Lagopoulos et al., 2013; Voineskos et al., 2010; Wheeler and Voineskos, 2014]. This pattern was robustly (r 2 ∼ 0.5) explained by known differences in the normal FA development rates across WM tracts. The direction of association indicates that the WM tracts that continued development to adulthood beyond the typical age of onset of schizophrenia had more prominent patient–control differences. Tracts with accelerated age‐related decline in patients were also those that normally have steeper age‐related decline. These tracts have prolonged maturation that goes beyond the typical age of onset of schizophrenia. The prolonged development of these tracts may expose them to the genetic and environmental risk factors for schizophrenia. These same risk factors may further contribute to their accelerated decline with age.
We found robust differences in average and regional FA values in schizophrenia patients, consistent with prior reports of patients with this disorder [Agartz et al., 2001; Buchsbaum et al., 2003; Kanaan et al., 2009; Lagopoulos et al., 2013; Whitford et al., 2010], including unmedicated first‐episode patients [Karlsgodt et al., 2009; Reis Marques et al., 2013] and adolescents at risk for psychosis [Karlsgodt et al., 2012; Peters and Karlsgodt, 2015]. Findings of regional patient–control differences suggest that associative WM areas serving higher cognitive functioning, such as the genu of the corpus callosum that connects the left and right frontal lobes, show more consistent and greater deficits than motor and sensory tracts such the fibers in the external and internal capsule [Agartz et al., 2001; Buchsbaum et al., 2003; Whitford et al., 2010]. These associative WM fibers contain thinly myelinated multimodal fibers and typically have a prolonged maturation course followed by a steeper decline with age, known since the classical work of Flechsig [1901]. The prolonged development of associative WM tracks may expose these areas to the primary or secondary risk factors of schizophrenia and make them susceptible to the schizophrenia pathology.
The relationship between heterochronicity and schizophrenia is likely to be the consequence of genetic risk factors for schizophrenia. For instance, a genotype‐by‐age interaction that affects axonal integrity, glial cell density and cellular aging may promote the development of schizophrenia and drive the relationship between diagnosis and FA deficits. One example is the genetic variations in the TP53 gene that alter oligodendrocyte development and aging mechanisms [Molina et al., 2011]; this is already among the candidate genes for schizophrenia [Lung et al., 2009; Ni et al., 2005]. Variations in this gene have been associated with deficits in FA values and reduced concentration of neurochemicals indexing glial and axonal health such as N‐acetylaspartate in frontal WM [Molina et al., 2011], and at the same time they are associated with increases in the risk for schizophrenia.
The evidence for accelerated decline in FA values with age in schizophrenia patients is consistently reported [Friedman et al., 2008; Knochel et al., 2012; Kochunov et al., 2012a; Mori et al., 2007; Wright et al., 2014, 2015]. The findings of no accelerated aging are also reported but these studies were performed in smaller cohorts (N = 20–50) where age‐by‐diagnosis interaction analysis is challenged by low statistical power [Jones et al., 2006; Voineskos et al., 2010] The accelerated aging of cerebral WM may also lead to decline in connectivity in the functional networks that support higher cognition [Sheffield et al., 2015]. We previously found that the onset of the accelerated decline in FA values in schizophrenia was correlated (r 2 = 0.36) with rates of the normal age‐related decline in a smaller sample [Kochunov et al., 2012a]. Here, around 40%–50% of the variance across the different WM fiber tracts was explained by rates of normal decline and maturation, extending the initial report to this much larger sample.
The finding of a positive correlation between the effect size of patient–control differences and the rate of FA development may appear counterintuitive as tracts that reach maturation earlier in life are expected to have faster rates of maturation. We used the rate of FA development reported from measurements in a large, cross‐sectional sample of subjects aged 11–90 years [Kochunov et al., 2012b]. Here, WM tracts that reach peak FA values early in life will have lower rates of increasing FA during the measurement period, while those tracts that reach maturation in the third and fourth decades may still undergo increased rates of change (Fig. 1). This may have led to a positive correlation between rate of FA development and the age of peak FA [Kochunov et al., 2012b]. Therefore, the regional variability in FA development is clearly an important empirical metric, but caution is needed in interpreting these trends.
The origin of the heterochronicity of WM development is not fully understood but is likely to be caused by regional differences in the rates of generating functionally mature oligodendrocytes and establishment of inter‐neuronal communication that lead to myelination of active circuits [Gibson et al., 2014]. Microscopy studies showed that oligodendrocytes that myelinate the associative tracts connecting multimodal areas are morphologically distinct from those that myelinate primary motor and sensory tracts [Lamantia and Rakic, 1990; Pfefferbaum et al., 2000; Sullivan et al., 2001; Wood and Bunger, 1984]. The oligodendrocytes of the associative WM tracts also have slower rates of myelin repair [Hof et al., 1990; Wakana et al., 2004]. Their myelination starts with a transient ensheathment of a large number of axons but only those axons that experience frequent electrical stimulation will remain myelinated [Hines et al., 2015]. Furthermore, engagement in higher cognitive and social functions requires sufficient myelination of associative WM tracts, but not for the tracts that serve the motor and sensory functions [Liu et al., 2012; Makinodan et al., 2012]. Therefore, the prolonged development of multimodal associative fibers may stem from the need to support higher cognitive and social functions that emerge in adolescence and develop through middle adulthood, functions that are compromised in schizophrenia.
At present, DTI is the most commonly used neuroimaging technique to study diffusion properties of the brain. DTI is one of many diffusion weighted imaging (DWI) approaches and DTI‐FA is a mathematic concepts derived for convenience rather than for biological interpretations [Basser and Pierpaoli, 1996]. Reduced FA values are commonly interpreted as an indexing reduced myelination, axonal damage or increased degree of intravoxel crossing based on findings in animal models and neurodegenerative disorder [Beaulieu, 2002; Jones et al., 2013; Song et al., 2003, 2005]. Reduced FA values in schizophrenia may be caused by several, complex factors. Advance DWI approaches such as diffusion kurtosis imaging (DKI) and multicompartmental diffusion signal modeling have been used to clarify the neurobiology of FA differences in schizophrenia [Jensen and Helpern, 2010; Kochunov et al., 2014a; Zhu et al., 2014] including the direct comparisons in a region with essentially no major crossing fiber architecture (sagittal band of corpus callosum) [Kochunov et al., 2013, 2014a; Zhu et al., 2014]. Reduced FA values in schizophrenia patients were associated with the rise in the free water component, reduction in permeability–diffusivity index and higher diffusion kurtosis values [Kochunov et al., 2013; Zhu et al., 2014]. The findings were interpreted as potentially reduced myelin level or abnormalities in trans‐membrane ion channels. This is consistent with reports of reduced axonal myelin levels and glial cells density by postmortem brain studies [Tkachev et al., 2003; Uranova et al., 2001, 2004, 2011] and findings from cellular neurobiology and genetic discovery studies [Blasius et al., 2011; Freedman et al., 2000; Huffaker et al., 2009; Meyer et al., 2001; Smolin et al., 2011; Smoller et al., 2013]. Further analyses are needed to clarify the biological factors that underwrite the findings of reduced FA values in this disorder.
Our analyses took advantage of the novel ENIGMA‐DTI mega‐analytic data homogenization approach. Mega‐analytic estimates of the effect of diagnosis on the regional FA values were in excellent (r > 0.95) agreement with the classic meta‐analytic estimates. Both mega‐and‐meta analytic estimates also showed good agreement with regional results derived from the individual cohorts (r = 0.94, 0.84, and 0.71, for cohorts A, B, and C, respective).
A potential limitation of this work is that the rates of the maturation and decline for different WM areas were derived based on cross‐sectional rather than longitudinal measurements [Kochunov et al., 2012b]. We cannot rule out effects from chronic antipsychotic exposure in SCZ cohorts. The mega‐analytic testing of anti‐psychotic medication effects, as calculated by the correlation of CPZ on the whole‐brain and regional FA, was not statistically significant (all P > 0.3). This design does not allow differentiation of factors involved in schizophrenia etiology from effects of chronic antipsychotic medication exposure. Ascertainment of a large antipsychotic‐naive SZ patient group is important, across different ages, to rule out interactions between medication effects and aging. Smoking is another possible contributing or confounding factor, because long‐term smoking leads to decline in FA [Gons et al., 2011; Kim et al., 2010]. Here, we observed no significant mega‐analytical effect of smoking status on the whole‐brain average FA values. Regionally, the mega‐analytic effects of smoking (being a smoker vs. a non‐smoker) were nominally significant for the corona radiata tract (P = 0.02) but this did not pass correction for multiple comparisons.
We note that this manuscript used age‐of‐peak values provided in [Kochunov et al., 2012b], calculated using quadratic models. However, some have criticized this method in favor of spline fits of aging trends, as the variable age range can influence peak time estimates [Fjell et al., 2010]. The present work should not be adversely affected by these limitations for two reasons: First, we did not perform analyses in a sample with variable age range, so regional variations in age‐of‐peak cannot be attributed to range effects. Second, the correlations between effects of schizophrenia and accelerated aging with age‐of‐peak did not reach statistical significance.
In conclusion, our study is the largest schizophrenia DTI analysis to date. We found that tract‐specific heterochronicity of normal WM development modulates the presentation of patient–control differences in WM FA values in schizophrenia. WM tracts that carry higher cognitive information and continue to mature past the average age‐of‐onset of schizophrenia are more sensitive to the pathophysiology of this disorder. The finding suggests the importance of implementing better white matter protection and treatment in supporting neurocognitive function and rehabilitation in individuals with this disorder. This study also posits regional WM measurements as promising endophenotypes for future studies of the genetic risks for schizophrenia.
Supporting information
Supporting Information
Authors declare no conflict of interest.
REFERENCES
- Agartz I, Andersson JL, Skare S (2001): Abnormal brain white matter in schizophrenia: a diffusion tensor imaging study. Neuroreport 12(10):2251–2254. [DOI] [PubMed] [Google Scholar]
- Alba‐Ferrara LM, de Erausquin GA (2013): What does anisotropy measure? Insights from increased and decreased anisotropy in selective fiber tracts in schizophrenia. Front Integr Neurosci 7:9. [DOI] [PMC free article] [PubMed] [Google Scholar]
- Bartzokis G (2004): Age‐related myelin breakdown: A developmental model of cognitive decline and Alzheimer's disease. Neurobiol Aging 25(1):5–18. [DOI] [PubMed] [Google Scholar]
- Bartzokis G, Cummings JL, Sultzer D, Henderson VW, Nuechterlein KH, Mintz J (2003): White matter structural integrity in healthy aging adults and patients with Alzheimer disease: A magnetic resonance imaging study. Arch Neurol 60(3):393–398. [DOI] [PubMed] [Google Scholar]
- Bartzokis G, Lu PH, Tingus K, Mendez MF, Richard A, Peters DG, Oluwadara B, Barrall KA, Finn JP, Villablanca P, Thompson PM, Mintz J (2010): Lifespan trajectory of myelin integrity and maximum motor speed. Neurobiol Aging 31(9):1554–1562. [DOI] [PMC free article] [PubMed] [Google Scholar]
- Basser PJ (1994): Focal magnetic stimulation of an axon. IEEE Trans Biomed Eng 41(6):601–606. [DOI] [PubMed] [Google Scholar]
- Basser PJ, Pierpaoli C (1996): Microstructural and physiological features of tissues elucidated by quantitative‐diffusion‐tensor MRI. J Magn Reson B 111(3):209–219. [DOI] [PubMed] [Google Scholar]
- Beaulieu C (2002): The basis of anisotropic water diffusion in the nervous system ‐ a technical review. NMR Biomed 15(7‐8):435–455. [DOI] [PubMed] [Google Scholar]
- Ben Bashat D, Ben Sira L, Graif M, Pianka P, Hendler T, Cohen Y, Assaf Y (2005): Normal white matter development from infancy to adulthood: Comparing diffusion tensor and high b value diffusion weighted MR images. J Magn Reson Imaging 21(5):503–511. [DOI] [PubMed] [Google Scholar]
- Blasius AL, Dubin AE, Petrus MJ, Lim BK, Narezkina A, Criado JR, Wills DN, Xia Y, Moresco EM, Ehlers C, Knowlton KU, Patapoutian A, Beutler B (2011): Hypermorphic mutation of the voltage‐gated sodium channel encoding gene Scn10a causes a dramatic stimulus‐dependent neurobehavioral phenotype. Proc Natl Acad Sci U S A 108(48):19413–19418. [DOI] [PMC free article] [PubMed] [Google Scholar]
- Bloemen OJ, de Koning MB, Schmitz N, Nieman DH, Becker HE, de Haan L, Dingemans P, Linszen DH, van Amelsvoort TA (2010): White‐matter markers for psychosis in a prospective ultra‐high‐risk cohort. Psychol Med 40(8):1297–1304. [DOI] [PubMed] [Google Scholar]
- Brown S (1997): Excess mortality of schizophrenia. A meta‐analysis. Br J Psychiatry 171:502–508. [DOI] [PubMed] [Google Scholar]
- Buchsbaum MS, Shihabuddin L, Brickman AM, Miozzo R, Prikryl R, Shaw R, Davis K (2003): Caudate and putamen volumes in good and poor outcome patients with schizophrenia. Schizophr Res 64(1):53–62. [DOI] [PubMed] [Google Scholar]
- Budde MD, Kim JH, Liang HF, Schmidt RE, Russell JH, Cross AH, Song SK (2007): Toward accurate diagnosis of white matter pathology using diffusion tensor imaging. Magn Reson Med 57(4):688–695. [DOI] [PubMed] [Google Scholar]
- Carletti F, Woolley JB, Bhattacharyya S, Perez‐Iglesias R, Fusar Poli P, Valmaggia L, Broome MR, Bramon E, Johns L, Giampietro V, Williams SC, Barker GJ, McGuire PK (2012): Alterations in white matter evident before the onset of psychosis. Schizophr Bull 38(6):1170–1179. [DOI] [PMC free article] [PubMed] [Google Scholar]
- Conturo TE, McKinstry RC, Akbudak E, Robinson BH (1996): Encoding of anisotropic diffusion with tetrahedral gradients: A general mathematical diffusion formalism and experimental results. Magn Reson Med 35(3):399–412. [DOI] [PubMed] [Google Scholar]
- Ellison‐Wright I, Bullmore E (2009): Meta‐analysis of diffusion tensor imaging studies in schizophrenia. Schizophr Res 108(1‐3):3–10. [DOI] [PubMed] [Google Scholar]
- Fjell AM, Walhovd KB, Westlye LT, Ostby Y, Tamnes CK, Jernigan TL, Gamst A, Dale AM (2010): When does brain aging accelerate? Dangers of quadratic fits in cross‐sectional studies. Neuroimage 50(4):1376–1383. [DOI] [PubMed] [Google Scholar]
- Flechsig P (1901): Developmental (myelogenetic) localisation of the cerebral cortex in the human. Lancet 158:1027–1030. [Google Scholar]
- Freedman R, Adams CE, Leonard S (2000): The alpha7‐nicotinic acetylcholine receptor and the pathology of hippocampal interneurons in schizophrenia. J Chem Neuroanat 20(3‐4):299–306. [DOI] [PubMed] [Google Scholar]
- Friedman JI, Tang C, Carpenter D, Buchsbaum M, Schmeidler J, Flanagan L, Golembo S, Kanellopoulou I, Ng J, Hof PR, Harvey PD, Tsopelas ND, Stewart D, Davis KL (2008): Diffusion tensor imaging findings in first‐episode and chronic schizophrenia patients. Am J Psychiatry 165(8):1024–1032. [DOI] [PubMed] [Google Scholar]
- Gao W, Lin W, Chen Y, Gerig G, Smith JK, Jewells V, Gilmore JH (2009): Temporal and spatial development of axonal maturation and myelination of white matter in the developing brain. AJNR Am J Neuroradiol 30(2):290–296. [DOI] [PMC free article] [PubMed] [Google Scholar]
- Gibson EM, Purger D, Mount CW, Goldstein AK, Lin GL, Wood LS, Inema I, Miller SE, Bieri G, Zuchero JB, Barres BA, Woo PJ, Vogel H, Monje M (2014): Neuronal activity promotes oligodendrogenesis and adaptive myelination in the mammalian brain. Science 344(6183):1252304. [DOI] [PMC free article] [PubMed] [Google Scholar]
- Glahn DC, Kent JW, Jr , Sprooten E, Diego VP, Winkler AM, Curran JE, McKay DR, Knowles EE, Carless MA, Goring HH, Dyer TD, Olvera RL, Fox PT, Almasy L, Charlesworth J, Kochunov P, Duggirala R, Blangero J (2013): Genetic basis of neurocognitive decline and reduced white‐matter integrity in normal human brain aging. Proc Natl Acad Sci U S A 110(47):19006–19011. [DOI] [PMC free article] [PubMed] [Google Scholar]
- Gons RA, van Norden AG, de Laat KF, van Oudheusden LJ, van Uden IW, Zwiers MP, Norris DG, de Leeuw FE (2011): Cigarette smoking is associated with reduced microstructural integrity of cerebral white matter. Brain 134(Pt 7):2116–2124. [DOI] [PubMed] [Google Scholar]
- Hasan KM, Iftikhar A, Kamali A, Kramer LA, Ashtari M, Cirino PT, Papanicolaou AC, Fletcher JM, Ewing‐Cobbs L (2009a): Development and aging of the healthy human brain uncinate fasciculus across the lifespan using diffusion tensor tractography. Brain Res 1276:67–76. [DOI] [PMC free article] [PubMed] [Google Scholar]
- Hasan KM, Kamali A, Iftikhar A, Kramer LA, Papanicolaou AC, Fletcher JM, Ewing‐Cobbs L (2009b): Diffusion tensor tractography quantification of the human corpus callosum fiber pathways across the lifespan. Brain Res 1249:91–100. [DOI] [PMC free article] [PubMed] [Google Scholar]
- Hennekens CH, Hennekens AR, Hollar D, Casey DE (2005): Schizophrenia and increased risks of cardiovascular disease. Am Heart J 150(6):1115–1121. [DOI] [PubMed] [Google Scholar]
- Hines JH, Ravanelli AM, Schwindt R, Scott EK, Appel B (2015): Neuronal activity biases axon selection for myelination in vivo. Nat Neurosci 18(5):683–689. [DOI] [PMC free article] [PubMed] [Google Scholar]
- Hof PR, Cox K, Morrison JH (1990): Quantitative analysis of a vulnerable subset of pyramidal neurons in Alzheimer's disease: I. Superior frontal and inferior temporal cortex. J Comp Neurol 301(1):44–54. [DOI] [PubMed] [Google Scholar]
- Huffaker SJ, Chen J, Nicodemus KK, Sambataro F, Yang F, Mattay V, Lipska BK, Hyde TM, Song J, Rujescu D, Giegling I, Mayilyan K, Proust MJ, Soghoyan A, Caforio G, Callicott JH, Bertolino A, Meyer‐Lindenberg A, Chang J, Ji Y, Egan MF, Goldberg TE, Kleinman JE, Lu B, Weinberger DR (2009): A primate‐specific, brain isoform of KCNH2 affects cortical physiology, cognition, neuronal repolarization and risk of schizophrenia. Nat Med 15(5):509–518. [DOI] [PMC free article] [PubMed] [Google Scholar]
- Ito K, Barnes PJ (2009): COPD as a disease of accelerated lung aging. Chest 135(1):173–180. [DOI] [PubMed] [Google Scholar]
- Jahanshad N, Kochunov P, Sprooten E, Mandl RC, Nichols TE, Almassy L, Blangero J, Brouwer RM, Curran JE, de Zubicaray GI, Duggirala R, Fox PT, Hong LE, Landman BA, Martin NG, McMahon KL, Medland SE, Mitchell BD, Olvera RL, Peterson CP, Starr JM, Sussmann JE, Toga AW, Wardlaw JM, Wright MJ, Hulshoff Pol HE, Bastin ME, McIntosh AM, Deary IJ, Thompson PM, Glahn DC (2013): Multi‐site genetic analysis of diffusion images and voxelwise heritability analysis: A pilot project of the ENIGMA‐DTI working group. NeuroImage 81:455–469. [DOI] [PMC free article] [PubMed] [Google Scholar]
- Jensen JH, Helpern JA (2010): MRI quantification of non‐Gaussian water diffusion by kurtosis analysis. NMR Biomed 23(7):698–710. [DOI] [PMC free article] [PubMed] [Google Scholar]
- Jeste DV, Wolkowitz OM, Palmer BW (2011): Divergent trajectories of physical, cognitive, and psychosocial aging in schizophrenia. Schizophr Bull 37(3):451–455. [DOI] [PMC free article] [PubMed] [Google Scholar]
- Jones DK, Catani M, Pierpaoli C, Reeves SJ, Shergill SS, O'Sullivan M, Golesworthy P, McGuire P, Horsfield MA, Simmons A, Williams SC, Howard RJ (2006): Age effects on diffusion tensor magnetic resonance imaging tractography measures of frontal cortex connections in schizophrenia. Hum Brain Mapp 27(3):230–238. [DOI] [PMC free article] [PubMed] [Google Scholar]
- Jones DK, Knosche TR, Turner R (2013): White matter integrity, fiber count, and other fallacies: The do's and don'ts of diffusion MRI. Neuroimage 73:239–254. [DOI] [PubMed] [Google Scholar]
- Kanaan R, Barker G, Brammer M, Giampietro V, Shergill S, Woolley J, Picchioni M, Toulopoulou T, McGuire P (2009): White matter microstructure in schizophrenia: Effects of disorder, duration and medication. Br J Psychiatry 194(3):236–242. [DOI] [PMC free article] [PubMed] [Google Scholar]
- Karlsgodt KH, Niendam TA, Bearden CE, Cannon TD (2009): White matter integrity and prediction of social and role functioning in subjects at ultra‐high risk for psychosis. Biol Psychiatry 66(6):562–569. [DOI] [PMC free article] [PubMed] [Google Scholar]
- Karlsgodt KH, Jacobson SC, Seal M, Fusar‐Poli P (2012): The relationship of developmental changes in white matter to the onset of psychosis. Curr Pharm Des 18(4):422–433. [DOI] [PMC free article] [PubMed] [Google Scholar]
- Kim SH, Yun CH, Lee SY, Choi KH, Kim MB, Park HK (2010): Age‐dependent association between cigarette smoking on white matter hyperintensities. Neurol Sci 33(1):45–51. [DOI] [PubMed] [Google Scholar]
- Kirkpatrick B, Messias E, Harvey PD, Fernandez‐Egea E, Bowie CR (2008): Is schizophrenia a syndrome of accelerated aging? Schizophr Bull 34(6):1024–1032. [DOI] [PMC free article] [PubMed] [Google Scholar]
- Knochel C, Oertel‐Knochel V, Schonmeyer R, Rotarska‐Jagiela A, van de Ven V, Prvulovic D, Haenschel C, Uhlhaas P, Pantel J, Hampel H, Linden DE (2012): Interhemispheric hypoconnectivity in schizophrenia: Fiber integrity and volume differences of the corpus callosum in patients and unaffected relatives. Neuroimage 59(2):926–934. [DOI] [PubMed] [Google Scholar]
- Kochunov P, Hong LE (2014): Neurodevelopmental and neurodegenerative models of schizophrenia: White matter at the center stage. Schizophr Bull 40(4):721–728. [DOI] [PMC free article] [PubMed] [Google Scholar]
- Kochunov P, Castro C, Davis D, Dudley D, Brewer J, Zhang Y, Kroenke CD, Purdy D, Fox PT, Simerly C, Schatten G (2010a): Mapping primary gyrogenesis during fetal development in primate brains: High‐resolution in utero structural MRI of fetal brain development in pregnant baboons. Front Neurosci 4:20. [DOI] [PMC free article] [PubMed] [Google Scholar]
- Kochunov P, Chiappelli J, Wright SN, Rowland LM, Patel B, Wijtenburg SA, Nugent K, McMahon Kochunov P, Glahn D, Lancaster J, Winkler A, Kent J, Olvera R, Cole S, Dyer T, Almasy L, Duggirala R, Fox P, Blangero J (2010b): Whole brain and regional hyperintense white matter volume and blood pressure: Overlap of genetic loci produced by bivariate, whole‐genome linkage analyses. Stroke 41(10):2137–2142. [DOI] [PMC free article] [PubMed] [Google Scholar]
- Kochunov P, Glahn DC, Lancaster J, Thompson PM, Kochunov V, Rogers B, Fox P, Blangero J, Williamson DE (2011a): Fractional anisotropy of cerebral white matter and thickness of cortical gray matter across the lifespan. Neuroimage 58(1):41–49. [DOI] [PMC free article] [PubMed] [Google Scholar]
- Kochunov P, Glahn DC, Lancaster J, Winkler A, Karlsgodt K, Olvera RL, Curran JE, Carless MA, Dyer TD, Almasy L, Duggirala R, Fox PT, Blangero J (2011b): Blood pressure and cerebral white matter share common genetic factors in Mexican Americans. Hypertension 57(2):330–335. [DOI] [PMC free article] [PubMed] [Google Scholar]
- Kochunov P, Glahn DC, Rowland LM, Olvera R, Wincker P, Yang D, Sampath H, Carpenter W, Duggirala R, Curran J, Blangero J, Hong LE (2012a): Testing the hypothesis of accelerated cerebral white matter aging in schizophrenia and major depression. Biol Psychiatry 73:482–491. [DOI] [PMC free article] [PubMed] [Google Scholar]
- Kochunov P, Williamson DE, Lancaster J, Fox P, Cornell J, Blangero J, Glahn DC (2012b): Fractional anisotropy of water diffusion in cerebral white matter across the lifespan. Neurobiol Aging 33(1):9–20. [DOI] [PMC free article] [PubMed] [Google Scholar]
- Kochunov P, Chiappelli J, Hong LE (2013): Permeability‐diffusivity modeling vs. fractional anisotropy on white matter integrity assessment and application in schizophrenia. NeuroImage: Clin 3:18–26. [DOI] [PMC free article] [PubMed] [Google Scholar]
- Kochunov P, Chiappelli J, Wright S, Rowland L, Patel B, Wijtenburg S, Nugent K, McMahon R, Carpenter W, Muellerklein F, Sampath H, Hong L (2014a): Multimodal white matter imaging to investigate reduced fractional anisotropy and its age‐related decline in schizophrenia. Psychiatry Res 223:148–156. [DOI] [PMC free article] [PubMed] [Google Scholar]
- Kochunov P, Jahanshad N, Sprooten E, Nichols TE, Mandl RC, Almasy L, Booth T, Brouwer RM, Curran JE, de Zubicaray GI, Dimitrova R, Duggirala R, Fox PT, Elliot Hong L, Landman BA, Lemaitre H, Lopez LM, Martin NG, McMahon KL, Mitchell BD, Olvera RL, Peterson CP, Starr JM, Sussmann JE, Toga AW, Wardlaw JM, Wright MJ, Wright SN, Bastin ME, McIntosh AM, Boomsma DI, Kahn RS, den Braber A, de Geus EJ, Deary IJ, Hulshoff Pol HE, Williamson DE, Blangero J, van 't Ent D, Thompson PM, Glahn DC (2014b): Multi‐site study of additive genetic effects on fractional anisotropy of cerebral white matter: Comparing meta and megaanalytical approaches for data pooling. Neuroimage 95C:136–150. [DOI] [PMC free article] [PubMed] [Google Scholar]
- Kochunov P, Jahanshad N, Marcus D, Winkler A, Sprooten E, Nichols TE, Wright SN, Hong LE, Patel B, Behrens T, Jbabdi S, Andersson J, Lenglet C, Yacoub E, Moeller S, Auerbach E, Ugurbil K, Sotiropoulos SN, Brouwer RM, Landman B, Lemaitre H, den Braber A, Zwiers MP, Ritchie S, van Hulzen K, Almasy L, Curran J, deZubicaray GI, Duggirala R, Fox P, Martin NG, McMahon KL, Mitchell B, Olvera RL, Peterson C, Starr J, Sussmann J, Wardlaw J, Wright M, Boomsma DI, Kahn R, de Geus EJ, Williamson DE, Hariri A, van 't Ent D, Bastin ME, McIntosh A, Deary IJ, Hulshoff Pol HE, Blangero J, Thompson PM, Glahn DC, Van Essen DC (2015a): Heritability of fractional anisotropy in human white matter: A comparison of Human Connectome Project and ENIGMA‐DTI data. Neuroimage 111:300–311. [DOI] [PMC free article] [PubMed] [Google Scholar]
- Kochunov P, Thompson PM, Winkler A, Morrissey M, Fu M, Coyle TR, Du X, Muellerklein F, Savransky A, Gaudiot C, Sampath H, Eskandar G, Jahanshad N, Patel B, Rowland L, Nichols TE, O'Connell JR, Shuldiner AR, Mitchell BD, Hong LE (2015b): The common genetic influence over processing speed and white matter microstructure: Evidence from the Old Order Amish and Human Connectome Projects. Neuroimage 125:189–197. [DOI] [PMC free article] [PubMed] [Google Scholar]
- Kubicki M, McCarley R, Westin CF, Park HJ, Maier S, Kikinis R, Jolesz FA, Shenton ME (2007): A review of diffusion tensor imaging studies in schizophrenia. J Psychiatr Res 41(1‐2):15–30. [DOI] [PMC free article] [PubMed] [Google Scholar]
- Lagopoulos J, Hermens DF, Hatton SN, Battisti RA, Tobias‐Webb J, White D, Naismith SL, Scott EM, Ryder WJ, Bennett MR, Hickie IB (2013): Microstructural white matter changes are correlated with the stage of psychiatric illness. Transl Psychiatry 3:e248. [DOI] [PMC free article] [PubMed] [Google Scholar]
- Lamantia AS, Rakic P (1990): Cytological and quantitative characteristics of four cerebral commissures in the rhesus monkey. J Comp Neurol 291(4):520–537. [DOI] [PubMed] [Google Scholar]
- Liu J, Dietz K, DeLoyht JM, Pedre X, Kelkar D, Kaur J, Vialou V, Lobo MK, Dietz DM, Nestler EJ, Dupree J, Casaccia P (2012): Impaired adult myelination in the prefrontal cortex of socially isolated mice. Nat Neurosci 15(12):1621–1623. [DOI] [PMC free article] [PubMed] [Google Scholar]
- Lung FW, Shu BC, Kao WT, Chen CN, Ku YC, Tzeng DS (2009): Association of DRD4 uVNTR and TP53 codon 72 polymorphisms with schizophrenia: A case‐control study. BMC Med Genet 10:147. [DOI] [PMC free article] [PubMed] [Google Scholar]
- Madler B, Drabycz SA, Kolind SH, Whittall KP, MacKay AL (2008): Is diffusion anisotropy an accurate monitor of myelination? Correlation of multicomponent T2 relaxation and diffusion tensor anisotropy in human brain. Magn Reson Imaging 26(7):874–888. [DOI] [PubMed] [Google Scholar]
- Makinodan M, Rosen KM, Ito S, Corfas G (2012): A critical period for social experience‐dependent oligodendrocyte maturation and myelination. Science 337(6100):1357–1360. [DOI] [PMC free article] [PubMed] [Google Scholar]
- Meyer J, Huberth A, Ortega G, Syagailo YV, Jatzke S, Mossner R, Strom TM, Ulzheimer‐Teuber I, Stober G, Schmitt A, Lesch KP (2001): A missense mutation in a novel gene encoding a putative cation channel is associated with catatonic schizophrenia in a large pedigree. Mol Psychiatry 6(3):302–306. [DOI] [PubMed] [Google Scholar]
- Molina V, Papiol S, Sanz J, Rosa A, Arias B, Fatjo‐Vilas M, Calama J, Hernandez AI, Becker J, Fananas L (2011): Convergent evidence of the contribution of TP53 genetic variation (Pro72Arg) to metabolic activity and white matter volume in the frontal lobe in schizophrenia patients. Neuroimage 56(1):45–51. [DOI] [PubMed] [Google Scholar]
- Mori T, Ohnishi T, Hashimoto R, Nemoto K, Moriguchi Y, Noguchi H, Nakabayashi T, Hori H, Harada S, Saitoh O, Matsuda H, Kunugi H (2007): Progressive changes of white matter integrity in schizophrenia revealed by diffusion tensor imaging. Psychiatry Res 154(2):133–145. [DOI] [PubMed] [Google Scholar]
- Nazeri A, Mallar Chakravarty M, Felsky D, Lobaugh NJ, Rajji TK, Mulsant BH, Voineskos AN (2012): Alterations of superficial white matter in schizophrenia and relationship to cognitive performance. Neuropsychopharmacology 38:1954–1962. [DOI] [PMC free article] [PubMed] [Google Scholar]
- Ni X, Trakalo J, Valente J, Azevedo MH, Pato MT, Pato CN, Kennedy JL (2005): Human p53 tumor suppressor gene (TP53) and schizophrenia: Case‐control and family studies. Neurosci Lett 388(3):173–178. [DOI] [PubMed] [Google Scholar]
- Perez‐Iglesias R, Tordesillas‐Gutierrez D, McGuire PK, Barker GJ, Roiz‐Santianez R, Mata I, de Lucas EM, Rodriguez‐Sanchez JM, Ayesa‐Arriola R, Vazquez‐Barquero JL, Crespo‐Facorro B (2011): White matter integrity and cognitive impairment in first‐episode psychosis. Am J Psychiatry 167(4):451–458. [DOI] [PubMed] [Google Scholar]
- Peters BD, Karlsgodt KH (2015): White matter development in the early stages of psychosis. Schizophr Res 161(1):61–69. [DOI] [PMC free article] [PubMed] [Google Scholar]
- Pfefferbaum A, Sullivan EV, Hedehus M, Lim KO, Adalsteinsson E, Moseley M (2000): Age‐related decline in brain white matter anisotropy measured with spatially corrected echo‐planar diffusion tensor imaging. Magn Reson Med 44(2):259–268. [DOI] [PubMed] [Google Scholar]
- Phillips KA, Rogers J, Barrett EA, Glahn DC, Kochunov P (2012): Genetic contributions to the midsagittal area of the corpus callosum. Twin Res Hum Genet 15(3):315–323. [DOI] [PMC free article] [PubMed] [Google Scholar]
- Pierpaoli C, Basser PJ (1996): Toward a quantitative assessment of diffusion anisotropy. Magn Reson Med 36(6):893–906. [DOI] [PubMed] [Google Scholar]
- R‐Development‐Core‐Team (2009): R: A Language and Environment for Statistical Computing.
- Reis Marques T, Taylor H, Chaddock C, Dell'acqua F, Handley R, Reinders AA, Mondelli V, Bonaccorso S, Diforti M, Simmons A, David AS, Murray RM, Pariante CM, Kapur S, Dazzan P (2013): White matter integrity as a predictor of response to treatment in first episode psychosis. Brain 137:172–182. [DOI] [PMC free article] [PubMed] [Google Scholar]
- Saha S, Chant D, McGrath J (2007): A systematic review of mortality in schizophrenia: Is the differential mortality gap worsening over time? Arch Gen Psychiatry 64(10):1123–1131. [DOI] [PubMed] [Google Scholar]
- Sheffield JM, Repovs G, Harms MP, Carter CS, Gold JM, MacDonald AW, 3rd , Ragland JD, Silverstein SM, Godwin D, Barch DM (2015): Evidence for accelerated decline of functional brain network efficiency in schizophrenia. Schizophr Bull 42:753–761. [DOI] [PMC free article] [PubMed] [Google Scholar]
- Smith SM, Jenkinson M, Johansen‐Berg H, Rueckert D, Nichols TE, Mackay CE, Watkins KE, Ciccarelli O, Cader MZ, Matthews PM, Behrens TE (2006): Tract‐based spatial statistics: Voxelwise analysis of multi‐subject diffusion data. Neuroimage 31(4):1487–1505. [DOI] [PubMed] [Google Scholar]
- Smolin B, Karry R, Gal‐Ben‐Ari S, Ben‐Shachar D (2011): Differential expression of genes encoding neuronal ion‐channel subunits in major depression, bipolar disorder and schizophrenia: Implications for pathophysiology. Int J Neuropsychopharmacol 15(7):869–882. [DOI] [PubMed] [Google Scholar]
- Smoller JW, Craddock N, Kendler K, Lee PH, Neale BM, Nurnberger JI, Ripke S, Santangelo S, Sullivan PF (2013): Identification of risk loci with shared effects on five major psychiatric disorders: A genome‐wide analysis. Lancet 381(9875):1371–1379. [DOI] [PMC free article] [PubMed] [Google Scholar]
- Song SK, Sun SW, Ju WK, Lin SJ, Cross AH, Neufeld AH (2003): Diffusion tensor imaging detects and differentiates axon and myelin degeneration in mouse optic nerve after retinal ischemia. Neuroimage 20(3):1714–1722. [DOI] [PubMed] [Google Scholar]
- Song SK, Yoshino J, Le TQ, Lin SJ, Sun SW, Cross AH, Armstrong RC (2005): Demyelination increases radial diffusivity in corpus callosum of mouse brain. Neuroimage 26(1):132–140. [DOI] [PubMed] [Google Scholar]
- Stouffer SA, Suchman EA, DeVinney LC, Star SA, Williams RM, Jr. (1949): The American soldier. Adjustment during Army life 1. Princeton Univ. Press, Princeton, NJ. [Google Scholar]
- Sullivan EV, Adalsteinsson E, Hedehus M, Ju C, Moseley M, Lim KO, Pfefferbaum A (2001): Equivalent disruption of regional white matter microstructure in ageing healthy men and women. Neuroreport 12(1):99–104. [DOI] [PubMed] [Google Scholar]
- Tkachev D, Mimmack ML, Ryan MM, Wayland M, Freeman T, Jones PB, Starkey M, Webster MJ, Yolken RH, Bahn S (2003): Oligodendrocyte dysfunction in schizophrenia and bipolar disorder. Lancet 362(9386):798–805. [DOI] [PubMed] [Google Scholar]
- Tsuang MT, Woolson RF (1978): Excess mortality in schizophrenia and affective disorders. Do suicides and accidental deaths solely account for this excess? Arch Gen Psychiatry 35(10):1181–1185. [DOI] [PubMed] [Google Scholar]
- Ulug AM, Barker PB, van Zijl PC (1995): Correction of motional artifacts in diffusion‐weighted images using a reference phase map. Magn Reson Med 34(3):476–480. [DOI] [PubMed] [Google Scholar]
- Uranova N, Orlovskaya D, Vikhreva O, Zimina I, Kolomeets N, Vostrikov V, Rachmanova V (2001): Electron microscopy of oligodendroglia in severe mental illness. Brain Res Bull 55(5):597–610. [DOI] [PubMed] [Google Scholar]
- Uranova NA, Vostrikov VM, Orlovskaya DD, Rachmanova VI (2004): Oligodendroglial density in the prefrontal cortex in schizophrenia and mood disorders: A study from the Stanley Neuropathology Consortium. Schizophr Res 67(2‐3):269–275. [DOI] [PubMed] [Google Scholar]
- Uranova NA, Vikhreva OV, Rachmanova VI, Orlovskaya DD (2011): Ultrastructural alterations of myelinated fibers and oligodendrocytes in the prefrontal cortex in schizophrenia: A postmortem morphometric study. Schizophr Res Treatment 2011:325789. [DOI] [PMC free article] [PubMed] [Google Scholar]
- Van Erp TG, Hibar DP, Rasmussen JM, Glahn DC, Pearlson GD, Andreassen OA, Agartz I, Westlye LT, Haukvik UK, Dale AM, Melle I, Hartberg CB, Gruber O, Kraemer B, Zilles D, Donohoe G, Kelly S, McDonald C, Morris DW, Cannon DM, Corvin A, Machielsen MW, Koenders L, de Haan L, Veltman DJ, Satterthwaite TD, Wolf DH, Gur RC, Gur RE, Potkin SG, Mathalon DH, Mueller BA, Preda A, Macciardi F, Ehrlich S, Walton E, Hass J, Calhoun VD, Bockholt HJ, Sponheim SR, Shoemaker JM, van Haren NE, Pol HE, Ophoff RA, Kahn RS, Roiz‐Santianez R, Crespo‐Facorro B, Wang L, Alpert KI, Jonsson EG, Dimitrova R, Bois C, Whalley HC, McIntosh AM, Lawrie SM, Hashimoto R, Thompson PM, Turner JA (2015): Subcortical brain volume abnormalities in 2028 individuals with schizophrenia and 2540 healthy controls via the ENIGMA consortium. Mol Psychiatry 21:585. [DOI] [PMC free article] [PubMed] [Google Scholar]
- Voineskos AN, Lobaugh NJ, Bouix S, Rajji TK, Miranda D, Kennedy JL, Mulsant BH, Pollock BG, Shenton ME (2010): Diffusion tensor tractography findings in schizophrenia across the adult lifespan. Brain 133(Pt 5):1494–1504. [DOI] [PMC free article] [PubMed] [Google Scholar]
- Wakana S, Jiang H, Nagae‐Poetscher LM, van Zijl PC, Mori S (2004): Fiber tract‐based atlas of human white matter anatomy. Radiology 230(1):77–87. [DOI] [PubMed] [Google Scholar]
- Wheeler AL, Voineskos AN (2014): A review of structural neuroimaging in schizophrenia: From connectivity to connectomics. Front Hum Neurosci 8:653. [DOI] [PMC free article] [PubMed] [Google Scholar]
- Whitford TJ, Kubicki M, Schneiderman JS, O'Donnell LJ, King R, Alvarado JL, Khan U, Markant D, Nestor PG, Niznikiewicz M, McCarley RW, Westin CF, Shenton ME (2010): Corpus callosum abnormalities and their association with psychotic symptoms in patients with schizophrenia. Biol Psychiatry 68(1):70–77. [DOI] [PMC free article] [PubMed] [Google Scholar]
- Wood P, Bunger RP (1984): The biology of the oligodendrocyte In: WT Norton, editor. Oligodendroglia. New York: Plenum Press; pp 1–46. [Google Scholar]
- Wright S, Kochunov P, Chiappelli J, McMahon R, Muellerklein F, Wijtenburg SA, White MG, Rowland L, Hong E (2014): Accelerated white matter aging in schizophrenia: Role of white matter blood perfusion. Neurobiol Aging 35:2411–2418. [DOI] [PMC free article] [PubMed] [Google Scholar]
- Wright SN, Hong LE, Winkler AM, Chiappelli J, Nugent K, Muellerklein F, Du X, Rowland LM, Wang DJ, Kochunov P (2015): Perfusion shift from white to gray matter may account for processing speed deficits in schizophrenia. Hum Brain Mapp 36:3793–3804. [DOI] [PMC free article] [PubMed] [Google Scholar]
- Yakovlev PI, Lecours A‐R (1967): The myelogenetic cycles of regional maturation of the brain In: Minkowski A, editor. Regional Development of the Brain in Early Life. Oxford: Blackwell Scientific Publications; pp 3–65. [Google Scholar]
- Yendiki A, Koldewyn K, Kakunoori S, Kanwisher N, Fischl B (2014): Spurious group differences due to head motion in a diffusion MRI study. Neuroimage 88C:79–90. [DOI] [PMC free article] [PubMed] [Google Scholar]
- Zhu J, Zhuo C, Qin W, Wang D, Ma X, Zhou Y, Yu C (2014): Performances of diffusion kurtosis imaging and diffusion tensor imaging in detecting white matter abnormality in schizophrenia. Neuroimage Clin 7:170–176. [DOI] [PMC free article] [PubMed] [Google Scholar]
Associated Data
This section collects any data citations, data availability statements, or supplementary materials included in this article.
Supplementary Materials
Supporting Information