

Abstract
We propose that the alternative crystal forms of outward open UlaA (which are experimental, not simulated, and contain the substrate in the cavity) can be used to interpret/validate the MD results from MalT (the substrate capture step, which involves the mobile second TMSs of the V-motifs, TMSs 2 and 7). Since the crystal contacts are the same between the two alternative crystal forms of outward open UlaA, the striking biological differences noted, including rearranged hydrogen bonds and salt bridge coordination, are not attributable to crystal packing differences. Using transport assays, we identifed G58 and G286 as essential for normal vitamin C transport, but the comparison of alternative crystal forms revealed that these residues to unhinge TMS movements from substrate-binding side chains, rendering the mid-TMS regions of homologous TMSs 2 and 7 relatively immobile. While the TMS that is involved in substrate binding in MalT is part of the homologous bundle that holds the two separate halves of the transport assembly (two proteins) together, an unequal effect of the two knockouts was observed for UlaA where both V-motifs are free from such dimer interface interactions.
Introduction
Seldom is the same conformational state, providing a third of a protein crystallized twice in alternative crystal forms, using the same crystallization conditions, in the same lattice, but in two different space groups (UlaA in the outward open state; P21A which is more unusual, and C2A which is more frequent). In this article, we propose that this scenario presents valuable information about structural flexibility, similar to the information obtained from temperature factors or from Normal Mode Analysis, yet coming from a different and independent information source. We attempt to subtract the estimates of local instability from the different information sources, to gauge where they agree and disagree. To aid the comparison, we establish a reference point in UlaA by a functional transport assay and confirm it by a superimposition experiment. These reference points are two local and homologous regions of local stability, G58 and G286, and assist in the interpretation of comparative instability data. What originally prompted our analysis was the fact that two glycines 58 and 286 that cropped up in a functional analysis of UlaA did not appear to be in mobile regions of the UlaA protein based on temperature factor data. This is in contrast to the notion that other well known mid-TMS glycines provide flexibility, such as the mid-TMS glycines of spiny helices of APC transporters (including Gly 25 and 206 of AdiC, PDB:3L1L)1. While Gly25 and 206 apparently interrupt the helical structure of the substrate channel proximal TMSs, they do not revent measurable flexibility in temperature factor plots. Glycines 58 and 286 of UlaA are, in contrast to such flexible glycines of APC transporters, located near the membrane and not in the protein interior or substrate translocation channel. We wanted to determine using NMA if the apparent lack of flexibility could be an artifact caused by the crystal packing environment and discovered that unlike many proteins, UlaA has two alternative crystal forms in the same conformation state, providing a third source of flexibility information.
Purpose
The rationale for this research is provided by considerations concerning the so called “Elevator Mechanism”2. One of the four steps of the “Elevator Mechanism” involves a transition in which the substrate is captured (outward open to outward occluded transition). Recently, the outward occluded conformation of MalT of the GFL superfamily was solved, but the “substrate capturing step” could only be simulated using MD3. We have proposed that secondary structural elements can be mapped between the GFL superfamily (MalT, ChbC) and the ascorbate-galactitol (AG) superfamily (UlaA)2 (Figure 1, Table 1 in4 or Figure S1 and Table S1). For this reason, we believe that the MD simulation of the substrate capturing step of GFL superfamily transporters can be partially “validated” by studying the alternative crystal forms of UlaA. Because the crystal contacts are the same between the alternative crystal forms, the differences seen cannot be attributed to contacts. Instead, we believe the alternative crystal forms can be found in the intermediates of the MD simulation3. The MD simulation suggests that it is the second half of the V-motifs (TMSs 2 and 7) that are involved in capturing the substrate, and that it is the mobile nature (presumably mediated by the critical glycines) that allows capture of the substrate (cf. outward open to occluded transition in UlaA, Figure S2). In the alternative crystal forms of the outward open UlaA, the substrate is present, but in the transition to the outward occluded state, it is found that many salt bridges and substrate coordinating hydrogen bonds are rearranged. An interesting parallel can be drawn to the MFS5 where a conserved movement of TMS11 releases the substrate on the inward side.
Background: PTS protein structures
The phosphoenolpyruvate (PEP):sugar phosphotransferase system (PTS) family of group translocators (TC #4.A; see TCDB, tcdb.org) is conceptually different from other major types of transport systems (e.g., primary active, secondary active or channel-based), in that the substrate is phosphorylated during transport6. The transmembrane domains of PTS porters are traditionally designated Enzymes IIC (IICs), and can be grouped into several superfamilies. Members of different superfamilies are believed to be non-homologous7. Other constituents of the PTS include the energy-coupling proteins, Enzyme I and HPr, and the phosphoryl transfer proteins, Enzymes IIA and IIB (IIA and IIB). High resolution structural information has been available for some time for two IIC proteins: the vitamin C transporter UlaA from E. coli, and the diacetylchitobiose transporter ChbC from Bacillus cereus.
Background: UlaA (TC# 4.A.7.1.1)
Bacteria, including intestinal E. coli, ferment vitamin C (L-ascorbic acid) as a carbon source, but mammals use it as a cytoplasmic reducing agent8. Vitamin C is imported into E. coli by the transport system Ula (Utilization of ascorbic acid), which includes three proteins, IIA, IIB, and IICUla 9–11. In contrast, vitamin C uptake across the mammalian intestinal brush border is mediated by a sodium-dependent secondary carrier. The E. coli transporter has 10–25 times higher affinity (lower Km) than intestinal secondary carriers12–13, indicating that the bacteria can effectively compete with the intestinal mucosal cells.
The resolution of the x-ray structures of UlaA is 1.65 and 2.35 Å for the C2 and P21 space groups, respectively. The symmetry-related core domain coordinates vitamin C binding. Two major types of PTS group translocators include the “AG” type of which UlaA is a member (The PTS L-Ascorbate (L-Asc) Family10), and the lactose family of the Glc-Fru-Lac (“GFL”) superfamily14, of which the chitobiose transporter ChbC is a member15–16. The AG and GFL superfamilies are not believed to be homologous and may have different evolutionary origins17. In fact, at least four independently evolving EIICs are currently believed to exist within the PTS domain7.
Since static light scattering experiments suggested that UlaA is a dimer in solution, the homodimeric partner in the C2 space group (PDB:4RP9), indicated as C2A′, could be generated by a crystallographic two-fold axis9. C2A and C2A′ are symmetry-related; therefore both of them have the same conformation. Only in the P21 space group (PDB:4RP8) do the two different conformations, P21A and P21B, exist. From the structural superimposition, C2A is equivalent to (=) C2A′ = P21A !=P21B (C2A, C2A′, and P21A are outward states, whereas P21B is the “occluded” state). In fact, we want to refute a suggestion9 that the two protomers in the UlaA dimer function independently, as this suggestion disagrees with the cooperative model proposed for ChbC9. The superimposition of C2A′ and P21B showed that while the structures are very similar, the core domain rotates 4.33° compared to the V motif, causing some atoms to move as much as 7 Å9. The “rigid body” model is partly based on the fact that no conformational changes occur within the core domains, although rotational movement can be measured.
Methods
Protein Expression and Purification
We selected several homologs of UlaA from different prokaryotic genomes. Their cDNAs were cloned into pET15b and pET21b (Novagen). Please refer to published protocol in Luo et al. (2015)9 for the procedures used.
Preparation of Proteoliposomes
Proteoliposomes were prepared following published protocols18,19. An E. coli polar lipid extract (Avanti Polar Lipids) was prepared in CM buffer [chloroform:methanol, 3:1 (vol/vol)] to a final concentration of 50 mg/mL and then dried under a stream of nitrogen to remove the solvent and obtain thin layer dry lipids in a glass tube. The dried lipids were resuspended in inner reaction buffer (containing 25 mM Tris-HCl, pH 8.0, 150 mM NaCl) by vortexing for 20 min to yield a final lipid concentration of 20 mg/mL. After 10 cycles of quick freezing and thawing, the liposomes were extruded at least 21 times in an Avestin extruder through a 400-nm polycarbonate filter (Avanti) to obtain unilamellar vesicles of a homogeneous size. Protein concentration was determined using Bio-Rad reagents (Bradford Assay), and the liposomes were mixed with purified protein at a concentration of 50 μg/mg lipids. The ratio (by weight) of protein to lipid used to make proteoliposomes was 0.05. To destabilize the liposomes, β-D-octyl glucoside (OG) was added to a final concentration of 1.2%, followed by incubation at 4 °C for 2 h. DDM and OG were removed by incubating with 300 mg/mL Bio-Beads (Bio-Rad) overnight and then with 100 mg/mL Bio-Beads for 2 h. After five cycles of quick freezing and thawing, the proteoliposomes were extruded 21 times in the extruder through a 400-nm polycarbonate filter. Finally, the proteoliposomes were ultracentrifuged at 100,000 × g at 4 °C for 1 h, and the resulting pellet was resuspended in outer reaction buffer (containing 25 mM citrate, pH 5.0, 150 mM NaCl) to 100 mg/mL.
Transport assay
Each reaction system had a 3 μl volume of proteoliposomes and 97 μl outer reaction buffer (25 mM citrate, pH 5.0, 150 mM NaCl), 0.66 mM 14C-ascorbate (5 μCi/ml). After incubating at 25°C for 4 minutes, the proteoliposomes and free 14C-ascorbate were vortexed and quickly placed onto a 0.45-μm filter (Sartorius) and washed in 2 mL ice-cold outer reaction buffer. Then the filter was placed into a 24-hole plate for liquid scintillation counting. All of the transport assays were repeated at least three times.
Δ-distance maps
Δ-distance maps were calculated as follows. The largest common set of Cα atoms was identified by the two conformational states of UlaA. Each state was represented as a matrix of all pairwise distance measurements. Bypassing previous convention (the “inward–outward” convention20), the matrix of the state (C2A) was subtracted from the (P21A) state.
The following parameters were used for ESCET normalization21. For 4RP8.A, Dmin=2.36 (resolution), Npar=26604 (number of parameters used in refinement, estimated), Nobs=49177 (number of reflections), Cpl=96.1 (completeness), Rfree=0.239 (free R value; fit to data used in refinement), and Rall=0.199 (R value, working and test set). For 4RP9, Dmin=1.65, Npar=26604, Nobs=71471, Cpl=94.6, Rfree=0.174, and Rall=0.136.
Normal mode analysis (NMA)
NOMAD-Ref (http://lorentz.immstr.pasteur.fr/nomad-ref.php) was used with default parameters, calculating 36 modes of arbitrary collective motions of the C2A and P21A states (the first six are trivial modes, translation and rotation), using an α-carbon representation. The average RMSD in output trajectories, the distance interaction weight parameter, and the cutoff to use for mode calculation were used with defaults (1, 5 and 10 Å, respectively) in the web server application.
Results
Identical crystal contacts suggest that alternative crystal forms of the outward open state might be substates of UlaA
The two open outward facing states (PDB:4RP9 and 4RP8.A) show differences in the number of hydrogen bonds and salt bridges, as well as significant conformational differences (Figures 3–6, and Tables 2 and 3 in4 or Figures S3–6 and Tables S2–3). These differences could represent two stable, biologically relevant sub-conformations of the outward open state (C2A and P21A), or artifacts due to the conditions of crystallization, for example, the pH or salt concentration used during crystallization, or differences in the computational refinement steps.
The crystallization conditions could affect the orientation. Looking at BetP, for example, the presence and absence of substrate in the crystal bath (before forming crystals) or in a soak (after forming crystals) changes the conformation from substrate-free to substrate-bound22. pH changes, or salt changes could alter whether sodium or protons are bound or not. It is also possible that there are sub-states formed under the same condition, especially if the crystals have formed in a different packing or symmetry group.
The unit cell dimensions of C2 and P21 lattices (C2, PDB ID 4RP9: 113.66, 85.81, 83.24, β=127.98; P21, PDB ID 4RP8: 83.78, 85.56, 88.95, β=96.73). It is noted that the unit cell volume of C2 is half the volume of P21. Actually the C2 diffraction data can be processed in a P21 lattice (with two protomers in asymmetric unit, a.u.). In this sense, the two P21 lattices have the same packing, but one with crystallographic 2-fold symmetry (e.g. C2) and the other lacking crystallographic symmetry (e.g. P21).
Crystallography (and single particle cryo EM) are the only techniques currently available for looking at detailed conformational changes in large transport proteins, but much can be influenced by the non-physiological environment imposed by the lattice. The differences between C2A and P21A are small enough to be attributable to crystal packing differences. In contrast, the difference between outward open and occluded UlaA is large enough that it is unlikely that the reduction in energy due to crystal packing would be significant enough to induce such large conformational changes if the two states did not already represent states with comparable low energy in the native conformation.
For both C2A and P21A forms, crystallization conditions were similar, where crystals were grown at 18° by the hanging drop vapor diffusion method, appearing after five days in the well buffer containing 0.1 M MES, pH 6.5, 0.1 M NaCl and 30% (v/v) PEG 400. To improve resolution, n-nonyl-β-D-glucopyranoside (β-NG) was added at 0.4% to improve diffraction at 1.65 and 2.35 Å in the C2 and P21 space groups, respectively9.
When dealing with crystallographic data, there is always a danger that observed structural differences could be artifacts of the crystal environment. This is particularly problematic for crystals of different space groups such as the two UlaA structures. To assess the potential for the differences between the C2A and P21A forms having arisen from differences in crystal contacts, the crystal lattice for each protein state was generated and superimposed. Despite the different space groups, both structures form the same crystal lattice. All contacts with symmetry partners overlapped by at least 47% of the contacting residues, indicating a close equivalence between all crystal contacts (Figure 1). Thus, the P21 lattice can be viewed as a slight deformation of the C2 lattice, eliminating the 2-fold crystallographic axis within the diad and presumably facilitating the conformational change of P21B to the occluded state. The equivalence of the two lattices, and the similarity of the crystallization conditions, suggest that crystal contacts are unlikely to play a significant role in the observed structural differences. The term lattice refers to objects with perfect translational operators. The lattice is the grid of unit cells that together with the space group (the set of symmetric operators which relate molecules within the unit cell) form the crystal in a precise mathematical sense. A 2×2×2 chunk of the crystal lattice for the two structures have different shapes, different origins, and different numbers of asymmetric units per unit cell (although they have the same number of chains per cell). However, when they are superimposed, it can be seen that in the overlapping section, a UlaA monomer is located at equivalent positions in both lattices and has equivalent contacts with its neighbors. If the 2×2×2 grids were continued, we would see that all proteins overlap to within a few Angstroms. The overall arrangement of proteins (protein packing), or the crystal form23, in each lattice is the same.
Figure 1. Comparison of crystal contacts in both UlaA forms, using the same alignment but viewed from three different orientations (a, b, c).
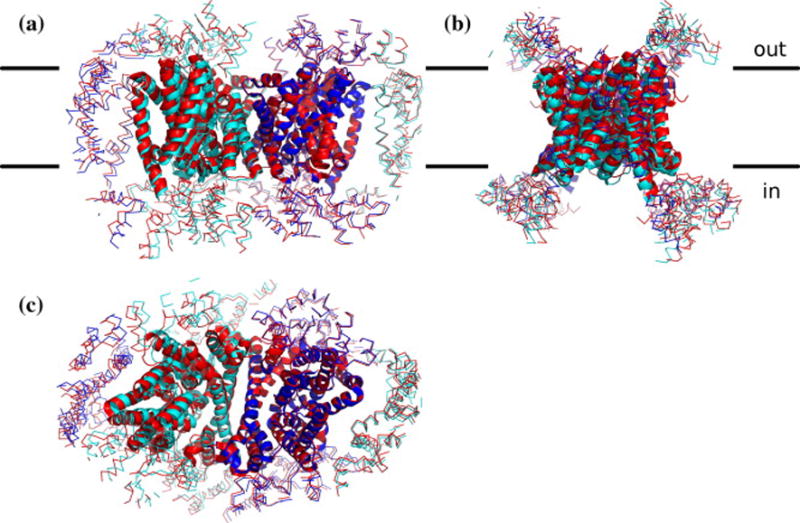
C2 data can be reprocessed in P21. One copy of the dimer is shown centrally from each structure, along with all contacting partners within 20 Å. The two outward open forms (red, C2A; blue, P21A) were superimposed. A deformation of the crystal lattice is visible due to the conformational change in P21B (cyan), but all contacts are equivalent in the two structures (47–83% of contacting residues shared). Figure generated using PyMOL.
Homologous residues (Gly58 and 286) impact vitamin C transport
The homologous V motifs can be superimposed within the same state, revealing a 47° relative tilt and hinting that this segment may have been tilted through evolution (Figure 2A). A structural alignment shows that Gly58 and 286 are at homologous positions in their corresponding V domains (Figure 2B). A time course for uptake of labeled vitamin C showed that uptake is severely impacted by replacing both functional glycines simultaneously by alanines, but that merely replacing Gly286 only reduced uptake by 50% compared to the combined knock-out effect (Figure 3).
Figure 2. Superimposition of “V motif 1” and “V motif 2” subdomains (a), and UlaA shown in cartoon representation, viewed from the extracellular space and tilted to reveal the binding site (b).
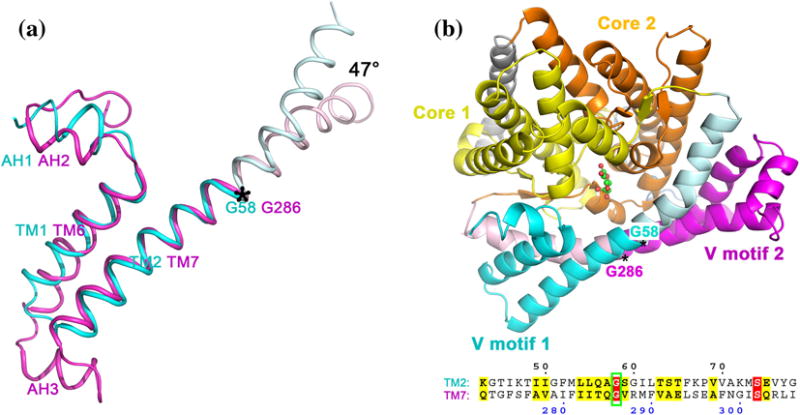
Panel (a) is based on Figure 3d in the original UlaA structure paper4. C-termini of TMSs 2 and 7 have about 47° rotational movement, probably pivoted on the well conserved Gly58/Gly286. Note that this comparison (47°) is not observed between conformational states (e.g. the C2A↔P21A to P21B model); it is observed between V1 and V2 which share a TMS duplication origin.
In panel (b), the C2 form corresponds to the outward-facing state, with “Core 2” oriented close to “V motif 2”. The transport pivots Gly58 and Gly286 are indicated. The structure-based sequence alignment between TMSs 2 and 7 is displayed below the structure. The Gly58 and 286 residues align in the structural model (highlighted in red).
Figure 3. Left, Time course of the uptake of 14C-labelled vitamin C in proteoliposomes reconstituted with UlaA (red circles) or in control liposomes (black squares). Right, 14C-vitamin C uptake assay identified the key pivotal residues Gly58 and Gly286 in the evolution of the vitamin C transporter.
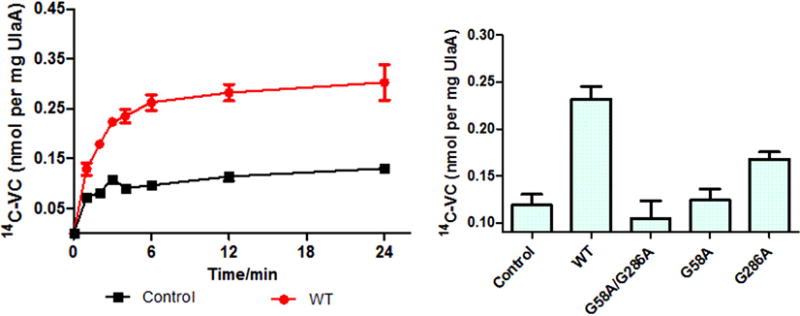
All of the transport assays were repeated at least three times. It was noticed that the control activity is higher than the G58A/G286A double mutant (measurement error).
TMS7 of MalT is comparatively short and contain conserved flanking glycines
It is not straightforward to align UlaA and MalT, but a GSAT alignment identified a conserved aligning motif close to TMS7 in both proteins (YXXXTG, Fig. 7 in Vastermark et al. (2016)4 or Fig. S7). The absence of sequence or structural evidence for a common ancestry provides the basis for suggesting these proteins are in different superfamilies in Transporter Classification Database (TCDB). However, secondary structural elements seem mappable (see supplementary file). A notable difference is that TMS7 is much shorter in MalT and appears to be flanked by rather than interspersed with glycine. G286 in UlaA has enough space around it to potentially accommodate a side-chain (Fig. 8 in Vastermark et al. (2016)4 or Fig. S8).
Differences between two outward open crystal forms of UlaA
The relative lack of internal movement between atoms contained within TMSs 3–5 and TMSs 8–10 of two crystal structures observed for UlaA agrees with the Luo et al. model of the outward open to outward occluded transition9 (Figure 4, symbol “A”). A blue line (“B”), probably representing a loop between TMSs 8 and 9, appears to have moved further away from the first core domain (denoted “core 1”; TMSs 3–5). In the transition between the C2A and the P21A crystal forms, the distance between V motif 1 and core 1 has increased. This is represented by the uniformly blue region of the plot, showing distance changes between TMSs 1–2 and 3–5 (Figure 4; symbol “C”). The area of the plot showing distance remodeling between TMS6 of V motif 2 and TMSs 8–10 is red (suggesting decreased distance; Figure 4; area “D”). TMS7, on the other hand, shows decreasing distance from TMS8, but increasing distance from TMSs 9–10 (area “E”). Considering the distance change within the V motifs, TMS1 appears to have separated from TMS2 in the transition to the more inward-facing state (area “F”). On the other hand, TMSs 6 and 7 have approached each other in the transition to the more inward-facing state (area “G”). It appears that the loops on the sides of TMS6 have approached both V motif 1 and the first core domain (area “H”), while TMS7 has clearly separated from both of these motifs (“H”). TMS1 has come closer to TMSs 8–10 whereas TMS2 appears to have moved away from TMSs 8–10 (symbol “I”; Figure 4).
Figure 4. Δ-distance maps representing the difference between the outward open C2A and P21A crystal forms of UlaA.
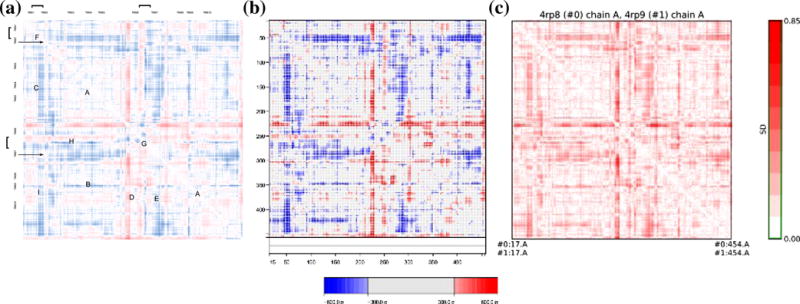
(A) Bypassing the “inward–outward” convention established earlier, we determined the PDB:4RP8.A-4RP9 distance map. As above, blue indicates a positive number, red, a negative number. Hence, blue coloring means the distance in the P21A state of UlaA (PDB:4RP8.A) is greater than in the C2A conformation of UlaA (PDB:4RP9), or that the corresponding atomic distance increased. For example, the distance between the N-terminal ends of TMS2 and TMS4 increased, including the distance between Ile42 (atom# CD1) and Gln140 (atom# OE1), which increased from 33.4 Å (4RP9) to 34.0 Å (4RP8) (hence colored blue). Conversely, the distance between mid-TMS6 and a loop between TMSs 8–9 (including atoms #CB of Ile242 CB & CD2 of Leu352) decreased from >27.4 Å (4RP9) to <27.4 Å (4RP8) (hence colored red). The color scale used goes from approximately −1.5 to +1.5 Å, but most cells have absolute values that are smaller than ±0.5 Å. The two horizontal arrows indicate the positions of the pivotal residues Gly58 and Gly286. Gly58 appears to be associated with a 7 residues-wide stationary region, possibly associated with the need to uncouple TMS2 movement from mid TMS2 residues interacting with the substrate.
(B) ESCET 0.7 was used to normalize the diagram. What appears red and blue in the normalized diagram is > 300 σ more extreme than the background, indicating that the differences are greater than the resolution limit of both structures.
(C) RR distance maps in Chimera 1.10 were used to determine that the “red cross” reached 0.85 S.D. but that the two “blue crosses” were closer to 0.5 S.D.
Normal mode simulation of outward open alternative states
Intrinsic conformational flexibility of outward open states of UlaA (PDB:4RP9, 4RP8.A) agree with some flexible areas discovered by comparing the alternative crystal forms using distance maps. Loops flanking TMSs 2 and 7 (of V1 and V2) that had previously been identified in the distance map comparisons of the alternative crystal forms, C2A and P21A, were confirmed as being intrinsically flexible. The matrix of covariant motions for each mode are directly comparable to the distance map representing the difference between the outward open conformations of UlaA (after scaling), helping us to disentangle the total difference between the outward open crystal forms and components of that movement. The NMA of the C2A and P21A crystal forms of UlaA revealed that the intrinsic flexibility conforms to the conformational switching between the alternative crystal forms. Some aspects of the mechanism of action (flexibility around the V motif) are consistent with both the crystal structures and the NMA.
Interpretation of MalT MD simulation of substrate catching
The 2nd V (approx. 240–280 residues, TMS 6–7 and beta 5–6) moved between 5 and 10 ns in the “Rep 1” experiment (triplicate 1, Fig. 9A in Vastermark et al. (2016)4 or Fig. S9A). The 2nd V moved between 5 and 10 ns (and between 20 and 25 ns) in the “Rep 3” experiment (triplicate 3, Fig. 11 in Vastermark et al. (2016)4, or Fig. S11, panels A and D). This observation is consistent with an oscillation between two substates of outward open, and consistent with movement of the substrate catching TMS. We can infer that for triplicate 3, comparing time point 5 and 25 (or 10 and 20 ns) would give no oscillatory signal. For triplicate 3, comparing time point 25 and 10 (or 5 and 15) would give “signal” (2nd V moved).
Conclusion
We present an unusual case in this paper, of greater theoretical than practical importance, comparing alternative crystal forms of the outward open state of UlaA as a new source of molecular flexibility data. One of the main differences between NMA data and temperature factor is that the latter gives an aggregate for a particular position, while the raw NMA data show collective movements. Alternative crystal data provide a “hybrid” between the two, in the sense that it is limited by crystal contacts, but shows collective movement between two sub-states (Fig. 5). The strength of the alt crystal data might be that it represents two real low energy collective states that the protein prefers, in the crystal hindering environment.
Figure 5. Comparison of alternative crystal forms of UlaA using a) NMA, b) Δ-distance map, and c) temperature factor.
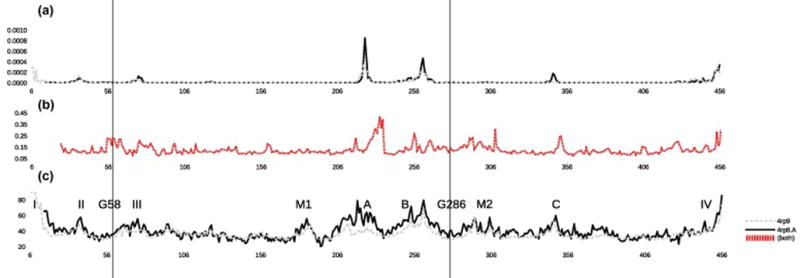
NOMAD-Ref was used to calculate non-trivial modes. The Δ-distance comparison of the alternative crystal states represents an “intermediate” between NMA and temperature factor, because these data are constrained by the crystal lattice, yet represent idealized combined motions. Some flexibility (M1 and M2) are missing in the NMA graph. Residues 6–15 are missing in one of the substates (PDB:4RP8.A), removing a crystal contact and giving the (dashed, grey) curve an elevated mobility in the N-terminal region. While P21A state of UlaA (PDB:4RP8.A) generally displays higher peaks in the merged NMA graph, the C2A conformation of UlaA (PDB:4RP9) has a higher unrestrained mobility in the N-terminus. However, if crystal contacts are taken into account, the peaks I and II of the P21A state of UlaA (PDB:4RP8.A) line are decimated. The residues of functional interest, G58 and G286 are part of beginning of peak III and M2, respectively. The positions of G58 and G286 are indicated by two vertical lines, one for each residue, across three plots. Notice that “missing” area M1 cannot be seen in the alternative crystal comparison plot (b), while “M2” can be seen. The crystal contacts are identical between (C2A) and (P21A), with instability peaks generally located between contacts. No NMA movement was found in crystal contact regions. It might have biological significance, that only the M2 area shows up as instability in the crystal comparison, meaning that conformation change in M2 area is involved in switching between (C2A) and (P21A) sub-states.
Discussion
The role of the PTS regulatory functions in addition to transport might provide insight into the undifferentiated evolution between transporters and receptors, including receptors that bind substrates without signaling24. The concept of comparing NMA and B-factor data is not new, it was first considered by Hinsen (2008)25, and he concluded that the differences are attributable to the crystal contacts. Of course, NMA is most effective to simulate large scale movements, not the small differences observed between alternative crystal forms. There is even an approach known as “crystal simulation” where MD simulations are performed in the crystal environment. NMA is a very attractive method, although it has lost most of its popularity; it is a method that can be used in a resource poor environment. Proteins have even been rationally designed to create CCFS (crystal contact free space) to study how crystal contacts affect motion26. A standardized method for comparing beta factor and NMA plots is under development, where vectors and mode frequencies are added up to create a single beta factor-like curve. A similar baseline is established and a transform such as discrete cosine transform-II is used to make the curves easy to compare.
Supplementary Material
Acknowledgments
The work was supported by NIH grants GM077402 and GM094610 (to M.S.) and by funds from the Ministry of Science and Technology of China (grant nos. 2011CB911102 and 2015CB910104) and the National Natural Science Foundation of China (31321062) to J.W. We are grateful for valuable advice and intellectual contributions (lattice analysis) by Dr Spencer Bliven, Bioinformatics and Systems Biology, University of California at San Diego, La Jolla, CA 92093-0116, USA & National Center for Biotechnology Information, National Library of Medicine, National Institutes of Health, Bethesda, MD 20894, USA. We thank Dr. Wonpil Im, Kansas University, for providing the original MalT simulation data.
Abbreviations
- C2A
P21A are space group names
- APC
is the Amino acid-Polyamine organoCation superfamily of secondary carriers
- PTS
is the bacterial Phospho-Transferase System
- NMA
is Normal Mode Analysis.
Footnotes
Publisher's Disclaimer: This is a PDF file of an unedited manuscript that has been accepted for publication. As a service to our customers we are providing this early version of the manuscript. The manuscript will undergo copyediting, typesetting, and review of the resulting proof before it is published in its final citable form. Please note that during the production process errors may be discovered which could affect the content, and all legal disclaimers that apply to the journal pertain.
Competing interests statement
The authors declare that they have no competing interests.
Author contributions
AV, AD wrote the paper. JWa, XL contributed experimental data. JWe carried our Normal Mode simulations. AV, MHS conceived of the study, and participated in its design and coordination.
References
- 1.Västermark Å, Saier MH., Jr Evolutionary relationship between 5+5 and 7+7 inverted repeat folds within the amino acid-polyamine-organocation superfamily. Proteins. 2014 Feb;82(2):336–46. doi: 10.1002/prot.24401. [DOI] [PubMed] [Google Scholar]
- 2.Vastermark A, Saier MH., Jr Time to Stop Holding the Elevator: A New Piece of the Transport Protein Mechanism Puzzle. Structure. 2016 Jun 7;24(6):845–6. doi: 10.1016/j.str.2016.05.010. [DOI] [PMC free article] [PubMed] [Google Scholar]
- 3.McCoy JG, Ren Z, Stanevich V, Lee J, Mitra S, Levin EJ, Poget S, Quick M, Im W, Zhou M. The Structure of a Sugar Transporter of the Glucose EIIC Superfamily Provides Insight into the Elevator Mechanism of Membrane Transport. Structure. 2016 Jun 7;24(6):956–64. doi: 10.1016/j.str.2016.04.003. [DOI] [PMC free article] [PubMed] [Google Scholar]
- 4.Vastermark A, Driker A, Weng J, Li X, Wang J, Saier MH. Data generated comparing alternative crystal forms of UlaA. Data in Brief. 2016 doi: 10.1016/j.dib.2016.11.087. Submitted. [DOI] [PMC free article] [PubMed] [Google Scholar]
- 5.Radestock S, Forrest LR. The alternating-access mechanism of MFS transporters arises from inverted-topology repeats. J Mol Biol. 2011 Apr 15;407(5):698–715. doi: 10.1016/j.jmb.2011.02.008. [DOI] [PubMed] [Google Scholar]
- 6.Vastermark A, Saier MH., Jr The involvement of transport proteins in transcriptional and metabolic regulation. Curr Opin Microbiol. 2014;18:8–15. doi: 10.1016/j.mib.2014.01.002. [DOI] [PMC free article] [PubMed] [Google Scholar]
- 7.Saier MH, Hvorup RN, Barabote RD. Evolution of the bacterial phosphotransferase system: from carriers and enzymes to group translocators. Biochem Soc Trans. 2005;33(Pt 1):220–224. doi: 10.1042/BST0330220. [DOI] [PubMed] [Google Scholar]
- 7.Levine M, Padayatty SJ, Espey MG. Vitamin C: a concentration-function approach yields pharmacology and therapeutic discoveries. Adv Nutr. 2011;2(2):78–88. doi: 10.3945/an.110.000109. [DOI] [PMC free article] [PubMed] [Google Scholar]
- 9.Luo P, Yu X, Wang W, Fan S, Li X, Wang J. Crystal structure of a phosphorylation-coupled vitamin C transporter. Nat Struct Mol Biol. 2015;22(3):238–241. doi: 10.1038/nsmb.2975. [DOI] [PubMed] [Google Scholar]
- 10.Zhang Z, Aboulwafa M, Smith MH, Saier MH., Jr The ascorbate transporter of Escherichia coli. J Bacteriol. 2003;185(7):2243–2250. doi: 10.1128/JB.185.7.2243-2250.2003. [DOI] [PMC free article] [PubMed] [Google Scholar]
- 11.Hvorup R, Chang AB, Saier MH., Jr Bioinformatic analyses of the bacterial L-ascorbate phosphotransferase system permease family. J Mol Microbiol Biotechnol. 2003;6(3–4):191–205. doi: 10.1159/000077250. [DOI] [PubMed] [Google Scholar]
- 12.Jeckelmann JM, Harder D, Ucurum Z, Fotiadis D. 2D and 3D crystallization of a bacterial homologue of human vitamin C membrane transport proteins. J Struct Biol. 2014;188(1):87–91. doi: 10.1016/j.jsb.2014.08.004. [DOI] [PubMed] [Google Scholar]
- 13.Boggavarapu R, Jeckelmann JM, Harder D, Schneider P, Ucurum Z, Hediger M, Fotiadis D. Expression, purification and low-resolution structure of human vitamin C transporter SVCT1 (SLC23A1) PLoS One. 2013;8(10):e76427. doi: 10.1371/journal.pone.0076427. [DOI] [PMC free article] [PubMed] [Google Scholar]
- 14.Nguyen TX, Yen MR, Barabote RD, Saier MH., Jr Topological predictions for integral membrane permeases of the phosphoenolpyruvate:sugar phosphotransferase system. J Mol Microbiol Biotechnol. 2006;11(6):345–360. doi: 10.1159/000095636. [DOI] [PubMed] [Google Scholar]
- 15.McCoy JG, Levin EJ, Zhou M. Structural insight into the PTS sugar transporter EIIC. Biochim Biophys Acta. 2015;1850(3):577–585. doi: 10.1016/j.bbagen.2014.03.013. [DOI] [PMC free article] [PubMed] [Google Scholar]
- 16.Cao Y, Jin X, Levin EJ, Huang H, Zong Y, Quick M, Weng J, Pan Y, Love J, Punta M. Crystal structure of a phosphorylation-coupled saccharide transporter. Nature. 2011;473(7345):50–54. doi: 10.1038/nature09939. [DOI] [PMC free article] [PubMed] [Google Scholar]
- 17.Saier MH, Jr, Reddy VS, Tamang DG, Vastermark A. The transporter classification database. Nucleic Acids Res. 2014;42(Database issue):D251–258. doi: 10.1093/nar/gkt1097. [DOI] [PMC free article] [PubMed] [Google Scholar]
- 18.Fang Y, Kolmakova-Partensky L, Miller C. A bacterial arginine-agmatine exchange transporter involved in extreme acid resistance. J Biol Chem. 2007;282(1):176–182. doi: 10.1074/jbc.M610075200. [DOI] [PubMed] [Google Scholar]
- 19.Reig N, del Rio C, Casagrande F, Ratera M, Gelpi JL, Torrents D, Henderson PJ, Xie H, Baldwin SA, Zorzano A. Functional and structural characterization of the first prokaryotic member of the L-amino acid transporter (LAT) family: a model for APC transporters. J Biol Chem. 2007;282(18):13270–13281. doi: 10.1074/jbc.M610695200. [DOI] [PubMed] [Google Scholar]
- 20.Vastermark A, Driker A, Li J, Saier MH., Jr Conserved movement of TMS11 between occluded conformations of LacY and XylE of the major facilitator superfamily suggests a similar hinge-like mechanism. Proteins. 2015;83(4):735–745. doi: 10.1002/prot.24755. [DOI] [PMC free article] [PubMed] [Google Scholar]
- 21.Schneider TR. Domain identification by iterative analysis of error-scaled difference distance matrices. Acta Crystallogr D Biol Crystallogr. 2004;60(Pt 12 Pt 1):2269–2275. doi: 10.1107/S0907444904023492. [DOI] [PubMed] [Google Scholar]
- 22.Perez C, Faust B, Mehdipour AR, Francesconi KA, Forrest LR, Ziegler C. Substrate-bound outward-open state of the betaine transporter BetP provides insights into Na+ coupling. Nat Commun. 2014;5:4231. doi: 10.1038/ncomms5231. [DOI] [PMC free article] [PubMed] [Google Scholar]
- 23.Xu Q, Canutescu AA, Wang G, Shapovalov M, Obradovic Z, Dunbrack RL., Jr Statistical analysis of interface similarity in crystals of homologous proteins. J Mol Biol. 2008;381(2):487–507. doi: 10.1016/j.jmb.2008.06.002. [DOI] [PMC free article] [PubMed] [Google Scholar]
- 24.Västermark Å, Rask-Andersen M, Sawant RS, Reiter JL, Schiöth HB, Williams MJ. Insulin receptor-like ectodomain genes and splice variants are found in both arthropods and human brain cDNA. J Syst Evol. 2013 Nov;51(6):664–670. doi: 10.1111/jse.12048. [DOI] [PMC free article] [PubMed] [Google Scholar]
- 25.Hinsen K. Structural flexibility in proteins: impact of the crystal environment. Bioinformatics. 2008 Feb 15;24(4):521–8. doi: 10.1093/bioinformatics/btm625. [DOI] [PubMed] [Google Scholar]
- 26.Matsuoka R, Shimada A, Komuro Y, Sugita Y, Kohda D. Rational design of crystal contact-free space in protein crystals for analyzing spatial distribution of motions within protein molecules. Protein Sci. 2016 Mar;25(3):754–68. doi: 10.1002/pro.2867. [DOI] [PMC free article] [PubMed] [Google Scholar]
Associated Data
This section collects any data citations, data availability statements, or supplementary materials included in this article.