

Abstract
Structural determination of protein-protein complexes such as multidomain nuclear receptors has been challenging for high-resolution structural techniques. Here, we present a combined use of multiple biophysical methods, termed iSPOT, an integration of shape information from small-angle X-ray scattering (SAXS), protection factors probed by hydroxyl radical footprinting, and a large series of computationally docked conformations from rigid-body or molecular dynamics (MD) simulations. Specifically tested on two model systems, the power of iSPOT is demonstrated to accurately predict the structures of a large protein-protein complex (TGFβ-FKBP12) and a multidomain nuclear receptor homodimer (HNF-4α), based on the structures of individual components of the complexes. Although neither SAXS nor footprinting alone can yield an unambiguous picture for each complex, the combination of both, seamlessly integrated in iSPOT, narrows down the best-fit structures that are about 3.3 Å and 4.2 Å in RMSD from their corresponding crystal structures, respectively. Furthermore, this proof-of-principle study based on the data synthetically derived from available crystal structures shows that the iSPOT—using either rigid-body or MD-based flexible docking—is capable of overcoming the shortcomings of standalone computational methods, especially for HNF-4α. By taking advantage of the integration of SAXS-based shape information and footprinting-based protection/accessibility as well as computational docking, this iSPOT platform is set to be a powerful approach towards accurate integrated modeling of many challenging multiprotein complexes.
1. Introduction
Large protein-protein complexes such as multidomain nuclear receptors are of fundamental importance in a variety of biological processes, where specific structural arrangements of protein domains within the complexes can dictate their own functional outcomes (Chambon, 2005; Helsen and Claessens, 2014). Typically, each of these complexes has its own distinct domain arrangement responsible for allosteric signaling and co-regulator interaction. As of now, only three human nuclear receptors have been solved (shown in Figure 1), namely, iPPRAγ-RXRα (Chandra et al., 2008), HNF-4α (Chandra et al., 2013), and LXRβ-RXRα (Lou et al., 2014), out of a total of 48. The low rate of structure elucidation hints at the challenges in solving nuclear receptors, such as androgen and estrogen receptors, and in turn highlights the need for advances in structure modeling techniques.
Figure 1.
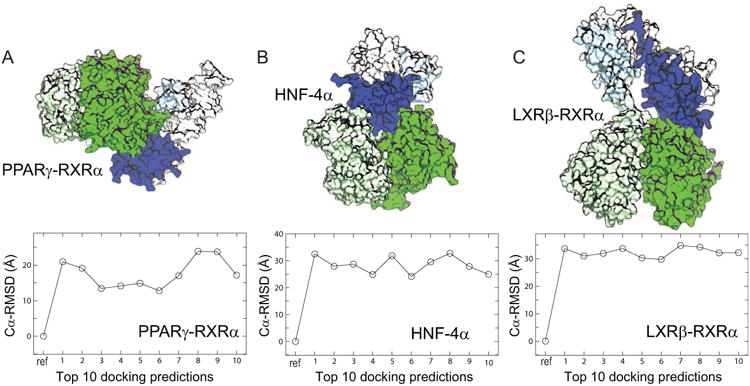
Three nuclear receptor complexes with known high-resolution structures and their docking predictions. Cartoon representations of their multidomain complexes (hetero/homo-dimers), each including the ligand-binding domains (colored in green) and the DNA-binding domains (in blue), are shown for PPRAγ-RXRα (A; PDB entry 3DZY), HNF-4α (B; PDB entry 4IQR), and LXRβ-RXRα (C; PDB entry 4NQA), respectively. The Cα-RMSD values of the top 10 predictions from rigid-body docking indicate large deviations from their corresponding crystal structures. The rigid-body docking between the ligand-binding domains and the DNA-binding domains (excluding their domain-connecting loops that are not shown) was performed using ZDOCK (see Methods).
It has been exceptionally challenging for existing high-resolution structural techniques as well as computational methods to characterize structural arrangements of multiprotein complexes in the range of 50-150 kDa. Computationally, taking the three nuclear receptors as examples, one would not expect homology modeling to perform well regarding the determination of the full complex, presumably due to their different domain-domain assemblies already observed. Experimentally, the use of a singular biophysical technique can be of limited gain as well. For example, consider small-angle X-ray scattering (SAXS). It provides information about the shape of a full complex (Bernado and Blackledge, 2010; Koch et al., 2003; Putnam et al., 2007; Yang, 2014), but it is known that over-fitting of experimental curves may yield incorrect structural models (Rambo and Tainer, 2013). Another example is the use of the so-called hydroxyl radical footprinting (Huang et al., 2015), which probes the solvent accessibility of surface residues (Hambly and Gross, 2005; Huang et al., 2015; Kaur et al., 2015; Maleknia and Downard, 2014; Sharp et al., 2004; Tullius and Dombroski, 1986; Xu and Chance, 2007). By itself, it is not able to predict the correct structure of a protein-protein complex (Kamal and Chance, 2008). Thus, it is becoming increasingly clear that the use of multiple structure-probing techniques is a necessity for accurate structure modeling, either computationally or experimentally, or both.
To address the challenge, combining multiple sources of biophysical data has become an important area of tools development for structural modeling. For example, structural information can be obtained at various levels of detail from different structural techniques such as electron microscopy, fluorescence resonance energy transfer, and cross-linking (Boura et al., 2011; Grishaev et al., 2008; Karaca et al., 2010; Robinson et al., 2007; Whitford et al., 2011). Such integrative approaches often rely on the fact that different sets of structural information are complementary to each other. One example of this complementarity is the use of SAXS, in conjunction with hydroxyl radical footprinting. Specifically, the overall shape information from SAXS is completely complementary and orthogonal to that from footprinting for locating protein-protein interfaces. This very same complementarity provides a well-justified basis for developing a highly promising approach of integrative structure modeling for previously-uncharacterized, challenging multi-domain or multi-protein complexes.
Here, we first describe each component of the integrative iSPOT platform, including a search engine that permits an exhaustive sampling of the protein-protein interacting energy-landscape. Note that while any docking techniques (such as rigid-body docking) can be used for the integration, a coarse-grained MD-based docking simulation method was used to take advantage of its built-in capability of structural flexibility offered by the nature of MD simulations. Then, the combination of SAXS and footprinting data is demonstrated on two model systems: the protein-protein TGFβ-FKBP12 complex and the multi-domain HNF-4α nuclear receptor homodimer. The iSPOT method is shown to accurately predict their structures, when compared to their respective available structures. Finally, force-field based atomic-level simulations are utilized for iSPOT-predicted structures to better refine the structure models, especially at the domain-domain interface critical for strategic design of model validations.
2. Methods and details
2.1. The integrative iSPOT platform
The iSPOT method is a multi-technique modeling framework that combines: (a) SAXS-based information about overall shape and domain arrangements within each biomolecular complex, (b) hydroxyl radical footprinting information about site-specific surfaces that are involved (and not involved) in domain-domain interfaces, and (c) survey of all plausible protein-protein conformations via computational rigid-body docking or MD-based docking simulations. Resulting iSPOT-predicted structures are subject to further atomistically-detailed simulations for refinement and assessment. Each component of this iSPOT platform is described below and further detailed in Supporting Information; in brief, computationally docked conformations are used to compare with SAXS and footprinting data via two scoring functions.
2.2. The goodness of fit χ2 for assessing SAXS data
The recently developed fast-SAXS-pro method was used to compute theoretical SAXS profiles (Ravikumar et al., 2013) for each docked conformation (described later). It should be noted that if the SAXS profiles at high-q regions (say, q>0.4 Å-1 where q is the amplitude of X-ray momentum transfer during the scattering) are required, the Fast-SAXS-pro method has been improved due to recent optimization of form factors at high-q values (Tong et al., 2016). The goodness of fit between the theoretical (Ical) and experimental (Iexp) SAXS profiles is assessed by
| (1) |
where σ is the uncertainty of log Iexp and N is the number of data points in Iexp(q), as used previously (Ravikumar et al., 2013; Yang et al., 2009; Yang et al., 2010a; Yang et al., 2010b). Specifically, a lower χ2 value represents a better fit between theoretical and experimental SAXS data. In this proof-of-principle, SAXS data are synthetically derived from known crystal structures and used as the experimental target data.
2.3. The goodness of fit φ2 for assessing footprinting data
Likewise, a scoring function of φ2 is used to measure the goodness of fit with experimental footprinting data for each computationally-docked conformation,
| (2) |
where log Pf is the protection factor of each amino acid i probed by hydroxyl radical footprinting and Nfp is the total number of amino acids probed by footprinting measurements in each molecule. Note that log Pf is previously demonstrated to be strongly correlated with the so-called solvent accessible surface area SAi for each amino acid (Huang et al., 2015; Kaur et al., 2015). In other words, the φ2 score is an average difference of solvent accessibility between each docked conformation and its target crystal structure to measure the goodness of fit with simulated footprinting data. A scaling constant c (i.e., the slope of a logPf-vs-SA plot) was used for optimal fitting. For both test cases, the value c = 1 was used and theoretical SA values from its crystal structure were used to simulate the log Pf values of all amino acids that have a higher intrinsic footprinting rate than proline (except cysteine, methionine, lysine, arginine, threonine, and serine due to their high susceptibility of oxidation), based on our own hands-on experience. A probe size of 1.4 Å (equivalent to the size of water) was used for theoretical SA calculations.
2.4. Rigid and flexible docking and data analysis
2.4.1 Rigid-body docking
The rigid-body docking was performed using a widely-used ZDOCK algorithm (Pierce et al., 2014). Two options of ZDOCK were used for generating top docking predictions. One was via its web server (ZDock 3.0.2 at http://zdock.umassmed.edu). The other was the use of its downloaded executables to generate a large set of docking poses.
2.4.2. Exhaustive RotPPR search in molecule dynamics simulations
This conformational search is two-fold: one related to a rotationally uniform pose generator and the other about translation-centric pull-push-release (PPR) sampling for docking simulations. The former pose-generator was originally developed for rigid-body docking (Solernou and Fernandez-Recio, 2010), but adopted here to achieve an optimal set of starting poses for simulations (see more details in Supporting Information). It was designed to provide a rather uniform distribution among all five rotational degrees-of-freedom (DoF) (i.e., ω1 – ω5 in Fig. 2), instead of a traditional angular mesh-grid used in most protein-ligand docking. This uniform distribution has a key advantage of avoiding the oversampling of certain regions (such as north/south poles of a protein's surface) observed in, e.g., a traditional angular mesh (SI Fig. 1A). A total of n5 starting poses are generated for subsequent simulations with n=5 used in this work, resulting in n5 = 3,125 initial poses. For the latter, based on our previously published protocol (Ravikumar et al., 2012), the PPR was utilized for docking simulations of two individual proteins. This docking was achieved via coarse-grained molecular dynamics (MD) simulations (Elcock et al., 2001; Zacharias, 2003) and by imposing a varying harmonic restraint between the centers-of-mass of two proteins along the center-of-mass distance R6 (Fig. 2 and SI Fig.1B), thus coaxing the two proteins to dock together, specifically along inter-protein translational directions (Huang et al., 2013; Ravikumar et al., 2012) (see Methods). The PPR works by repeating multiple pull-push-release cycles to facilitate the docking of interacting proteins while allowing for protein flexibility. Thus, the combined PPR and rotational searches, termed RotPPR method, is implemented into coarse-grained Langevin-based simulations (SI Eq. 2 and more details in Supporting Information).
Figure 2.
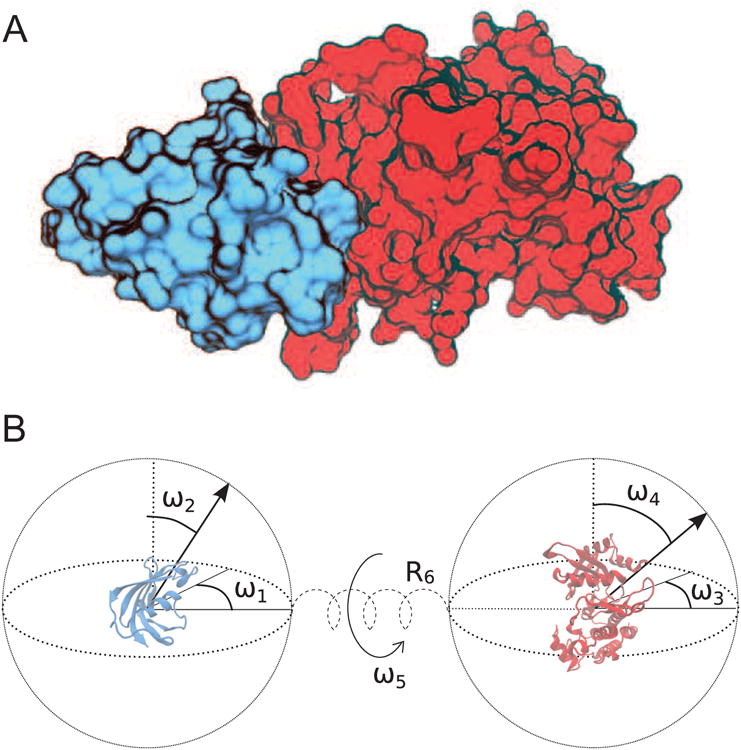
Schematic of inter-protein degrees of freedom involved in protein-protein interaction. The TGFβ-FKBP12 complex with a known high-resolution structure was used as a model system (PDB entry 1B6C) (A), where the smaller FKBP12 protein is shown in blue (PDB entry 1D6O) and the larger TGFβ is shown in red (PDB entry 1IAS). The six inter-protein degrees of freedom (DoFs) are partitioned between five angular rotations (marked by ω1 – ω5) and a translation (marked by R6) via a connecting spring along the center-of-mass axis.
2.4.3. Post-simulation analysis
The structure clustering of RotPPR-driven simulation trajectories are based on structural similarity via two specific metrics: fRMSD and oRMSD (SI Eqs. 3-6). The former is the RMSD of Cα atoms of the entire complex-forming system and the latter is orientation-specific by explicitly accounting for relative orientation between two proteins (SI Eq. 4). Based on the oRMSD clustering (detailed in Supporting Information), similar simulation-generated structures are grouped into one cluster or conformation that appear more homogenous than what was based on fRMSD clustering. In addition, the energetic stability of each resulting conformational cluster was assessed by its effective energy based on a Boltzmann distribution of all structures within the cluster (SI Eq. 7).
2.4.4. Post-integration atomic-level simulation
Standard force-field based simulations using the amber99SB force field (Hornak et al., 2006) with an implicit solvent model were applied after the full structure model of a total protein-protein complex was reconstructed. The all-atom reconstruction was based on iSPOT-predicted structures and crystal structures of individual proteins. This is followed by targeted or restrained MD simulations to achieve a realistic structure of the complex, free from steric clashes particularly at the docking interface (Huang et al., 2013). Final all-atom, explicit-solvent NPT simulations, free of any bias, were used for model assessment. The production simulations were performed using the Amber12 package (Case et al., 2005), where standard periodic boundary conditions were applied and long-range electrostatic interactions were treated with the particle-mesh Ewald method. The Amber ff99SB force field and the TIP3P water model were used. Simulations were performed at a constant temperature of 300 K and a constant pressure of 1 atm with a 2-fs time step.
3. Results and discussion
The increasing availability and predictability of high-resolution structures of individual components of a large protein complex and the ease of collecting biophysical SAXS and footprinting data for their complexes raise a critical question: can these types of structural information be integrated to predict the structure of a given protein-protein complex? It becomes even more appealing as these techniques probe the structure of the complex in solution, allowing examination of conditions close to their physiological states. Here, two large exemplary systems, TGFβ-FKBP12 and HNF-4α, are used to demonstrate such power of integration. Based on SAXS and solvent accessibility probed by footprinting that were back-calculated from their crystal structures, a newly termed iSPOT method is able to accurately predict their target structures. Finally, the best iSPOT-predicted structures are subject to further atomic-level simulations to make specific predictions regarding their domain interface that can be tested by further experiments.
3.1. Large deviation of docking-predictions on three multidomain nuclear receptors
Attempts to dock the crystal structures of individual domains appear to fail to generate any meaningful pictures of three total multidomain complexes via rigid-body docking. Specifically, rigid-body docking using ZDock (see Methods) was used to generate top 10 structure models based on the structures of their ligand-binding and DNA-binding domains for all three nuclear receptor complexes: PPRAγ-RXRα, HNF-4α, and LXRβ-RXRα. Compared to their crystal structures, Figure 1 shows that substantially large RMSD deviations (> 12 Å) between predicted and crystal structures are observed. While a better docking algorithm may improve prediction outcomes in the future, it should be noted that the target crystal structure observed is not among the top predicted conformations (as we shall see later). For this reason, it is uncertain whether rigid-body docking, which can be used as a component of the iSPOT modeling (as we shall see later), could be applied for computational prediction of these multidomain nuclear receptor assemblies alone.
3.2. Implementation of the iSPOT platform
To overcome the limitation of individual techniques (either computationally or experimentally), the integrative iSPOT method is designed to simultaneously take into account data from multiple biophysical techniques for a more complete picture of a given system of interest. By construct, it is modular and expandable to include other, extra sources of structural information. Here, for simplicity, two experimental techniques (i.e., SAXS and footprinting) providing complementary structural information are used and combined via extensive energy-landscape simulations.
A key component of the iSPOT approach is its ability to explore systematically and uniformly the conformational space of protein-protein docking (Fig. 2). To achieve this extensive search, the combination of a rotationally-uniform pose generator and a translation-centric push-pull-release (PPR) strategy, termed RotPPR, is implemented for the sake of promoting protein association while taking into account modest protein deformation upon docking (see Methods). By combining the rotation-centric pose generator and the translation-centric PPR, the RotPPR intertwines both translational and rotational sampling strategies simultaneously into a flexible-docking MD simulation, thereby providing a powerful search engine that complements those advanced sampling techniques available in the field (Dellago et al., 1998; Gan et al., 2009; Hamelberg et al., 2005; Jiang et al., 2014; Sugita and Okamoto, 1999; Yang et al., 2007). It should be noted that RotPPR is not intentionally designed to achieve thermodynamic or kinetic properties of the process itself, but rather provide an efficient tool for exhaustive conformational search. Nonetheless, it is expected that thorough conformation sampling is key here as correct docking results may not be readily identified by energy measures alone, but can be selected via goodness of fit to other sources of data.
To illustrate how RotPPR works, SI Figure 1C shows an example where a set of 3,125 initial poses were used for PPR simulations via a predictive coarse-grained energy function (see SI Eq. 2). Given the coverage over both transitional and rotational degrees of freedom, this combined rotation-translational search method, termed here RotPPR, is capable of searching all possible conformations each with a different inter-protein orientation. SI Figure 2 shows the extent to which the relevant conformational space has been visited by the RotPPR (in this case, i.e., of TGFβ-FKBP12). Specifically, each dot represents one conformer, in which one protein is aligned at the center of the sphere and the other is on the surface (SI Fig. 2A) and vice versa (SI Fig. 2B). A subset of conformers that had contacts in one region of the first protein (indicated by the red circle in Fig. 3B) were placed on the surface of the second protein (SI Fig. 2C). It is rather clear that virtually the entire rotational space has been visited by RotPPR. A more quantitative analysis is obtained by dividing both the first and the second protein's surface into a set of grids each with a 20° angular separation shows that with regards to the percentage of sampled grids, a gradual, but rapid convergence in total sampling coverage as a function of simulation time is observed by such a RotPPR-driven docking simulation (SI Fig. 2D). Thus, the RotPPR is a powerful search engine, necessary before the claim of finding a best-fit solution for experimental data.
Figure 3.
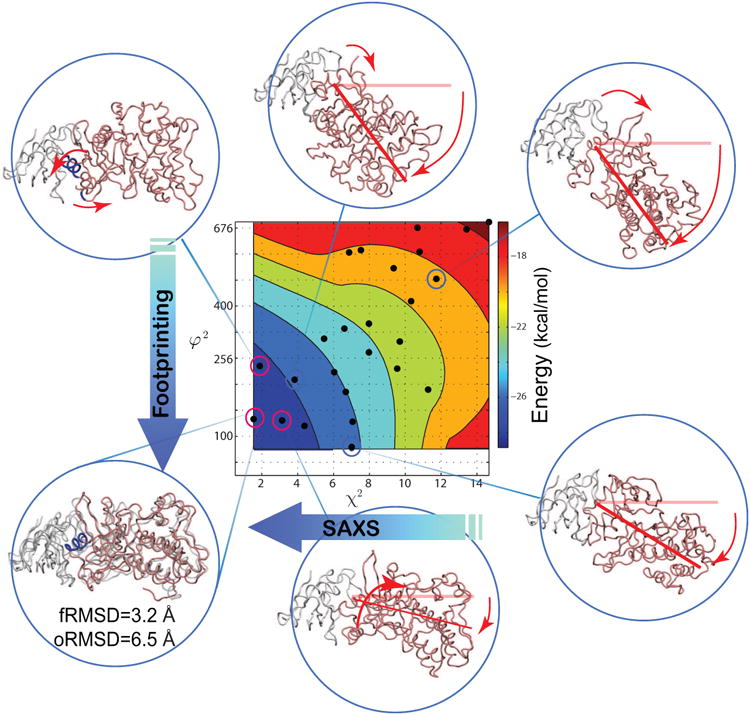
Integrative iSPOT modeling platform accurately predicts the target crystal structure of TGFβ-FKBP12. Distribution of a subset of conformational clusters (marked as black dots) and their interaction energies (SI Eq. 7). The contours are linearly interpolated from red to blue, where blue is the most favorable. The x-axis is the χ2 score describing the scattering similarity to the target (Eq. 1), where a low value means a better fit to the target SAXS data. The y-axis is φ2 (in a unit of Å4), the rms difference between solvent accessibility of a set of Nfp=114 residues, in the structure-ensemble sampled and the known target complex (Eq. 2). Only a set of six representative clusters are shown for illustration, where red lines/arrows indicate deviation from the known TGFβ-FKBP12 crystal structure (shown on the bottom-left side).
Post-simulation analyses have been performed for conformation identification from massive RotPPR simulation data. First, structure clustering via a new oRMSD clustering algorithm has been performed to specifically account for the difference in relative orientation between two individual proteins (see Methods and SI Eq. 4). Note that the oRMSD metric may bear some conceptual similarity to the so-called interface RMSD specially for protein-protein interfaces (Janin, 2010), but oRMSD is interface nonspecific with a key focus on relative domain orientation instead, which is more applicable for complexes with unknown structures. This orientation-specific oRMSD clustering is also compared with a traditional clustering analysis based on the RMSD similarity regarding the total protein-protein complex (referred to as fRMSD; SI Eq. 3), which has been long used to examine the overall structural changes, e.g., in a long simulation trajectory of protein dynamics (Karpen et al., 1993). SI Figure 3 shows the difference between fRMSD and oRMSD clustering analyses, using the same dataset from TGFβ-FKBP12 simulations. Take the cluster similar to its crystal structure for example—the fRMSD clustering yields similar structures with regards to the full complex (SI Fig. 3A), but this very same cluster consists of diverse conformations that may have a nearly 90-degree rotational difference between a pair of structures (SI Fig. 3B). This structural ambiguity can be removed by the use of oRMSD-based clustering since the measure of oRMSD is sensitive, by design, to the relative orientation between two proteins. This improvement is illustrated by overlapping the full complex (SI Fig. 3C) or just part of the complex (SI Fig. 3D), a well-defined conformational cluster is obtained with reduced structurally-diversity observed in the fRMSD clustering.
Second, energetic stability of each conformational cluster is assessed by an effective energy Eeff, which is calculated based on the interaction energy between the two proteins (SI Eq. 7). Figure 3 (center) shows such an energetic mapping of the docking energy landscape of TGFβ-FKBP12. Indeed, it is quite remarkable that the overall energetic stability substantially increases when the cluster gets more similar to its crystal-like conformation. It should be noted that the crystal-like conformations may not be observed as the lowest-energy cluster for every protein-protein complex, which has been observed in the case of a barnase-barstar complex (Ravikumar et al., 2012) and in the case of HNF-4α (as we shall see). Nonetheless, this post-simulation energetic evaluation is instrumental to identify any meta-stable conformations available on the energy-landscape, and to distinguish between distinct conformations that equally well fit the experimental data if necessary.
3.3. Combination of SAXS and footprinting data by iSPOT accurately predicts the target structure of a largeTGFβ-FKBP12 complex
To illustrate how the integration of SAXS (about overall shape) and footprinting (about solvent accessibility of surface residues) works, theoretical SAXS and footprinting profiles were computed for each docked conformation. To this end, the iSPOT is designed to integrate all accessible knowledge from SAXS, footprinting, and RotPPR-driven simulations. For TGFβ-FKBP12, target SAXS profiles were back-calculated from its crystal structure (PDB entry 1B6C) (Huse et al., 1999), and solvent accessibility (SA) values were calculated for a total of Nfp=114 residues that are on the surface of both TGFβ (Huse et al., 2001) and FKBP12 (Burkhard et al., 2000), which closely resemble realistic experimental data. Two specific scoring functions, χ2 and φ2 (Eq. 1 and Eq. 2), were computed and illustrated. Figure 3 shows the iSPOT modeling results summarizing the integration of RotPPR-driven simulations with theoretically simulated SAXS and footprinting data. Each conformer (marked by a black dot) of TGFβ-FKBP12 is colored by its corresponding energy Eeff (e.g., the lower-energy conformers are in blue; see the color bar) in this two-dimensional plot of χ2 and φ2.
There are several key observations from this iSPOT study of TGFβ-FKBP12. First, all conformers outside the low-energy regions (blue) have a larger χ2 and φ2 deviation from the target structure (e.g., see the structure on the top-right corner that has a completely wrong protein-protein arrangement and interface), so these conformers can also be easily filtered out by SAXS and/or footprinting data. For energetically stable conformers (around the blue region), some structures have low SAXS-based χ2 scores but have a modest twist between the two proteins (with a different set residues exposed; see the left-top corner). Other predicted structures have the same set of residues involved at the interface but have a near 90° hinge bending between the two proteins (see the right-bottom corner of Fig. 3).
Second, it should be noted that while SAXS and footprinting are proven techniques for various structural studies, neither SAXS nor footprinting alone is able to identify a proper, unambiguous model structure for TGFβ-FKBP12. For example, some conformations may have a very good fit to SAXS but have a completely out-of-place interface and vice versa (see example in the right-bottom and left-top corner in Fig. 3). Instead, a combination of SAXS and footprinting is capable to best-fit the structure-ensemble that can reveal where the proteins interact and how they are aligned to each other. This is made possible because SAXS defines the shape of the complex, whereas footprinting reveals the regions of contact between the proteins; the combination of both types of structural information narrows down the correct selection of target complex conformations.
Figure 4 shows a three-dimensional landscape from the iSPOT modeling of TGFβ-FKBP12, with a vertical z-direction as the RMSD value of each conformation. Again, it clearly demonstrates that the lower-RSMD conformations have higher energetic stability as a general correlation. More importantly, the iSPOT has identified a best-fit ensemble structure that is very similar to its crystal structure, with a fRMSD value of 3.3 Å (and an oRMSD value of 6.0 Å). Their structural superposition is shown in the bottom-left corner of Fig. 3. This result shows that accurate structures can be derived from structural techniques such as SAXS and footprinting that are not at high-resolution at all.
Figure 4.
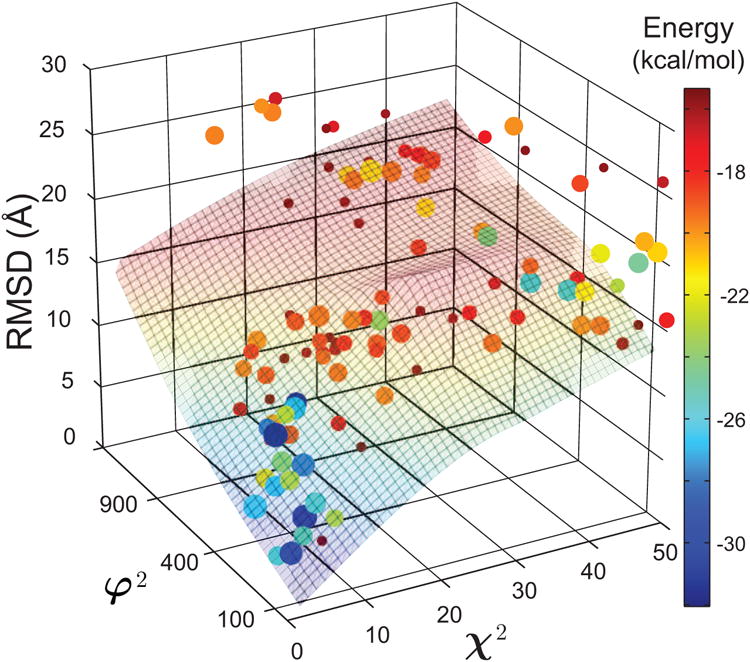
The iSPOT-enabled three-dimensional energy landscape of TGFβ and FKBP12 interactions. The conformations that are favored by iSPOT generally have a lower interacting energy, which may not always be the case (see text). The three values of each dot represent the scores χ2, φ2 and RMSD of the total complex, respectively, for each RotPPR-docked conformation. The size of each dot is proportional to the number of structures within its conformational cluster, and the color of each dot represents the interacting energy between the two proteins. The φ2 values are in a unit of Å4.
Third, the extent to which the “sparseness” of footprinting data affects the iSPOT modeling is examined by varying the number of surface residues used for analysis. Specifically, a total of 154 clusters that are close to the crystal-structure cluster were used for this examination. A fraction (f), out of a total of Nfp=114 surface residues, was used including interfacial (Nin=16) and non-interfacial residues (Nout=98) (highlighted on the crystal structure; SI Fig. 4A). Note that even if only half of data points (f=50%; SI Fig. 4B) were randomly used, a strong correlation is found with a high correlation coefficient of ρ=0.9, compared with f=100% (SI Fig. 4C). Also, the lower-bound limit below which the footprinting data become too sparse for the iSPOT modeling is assessed quantitatively. SI Figure 3D shows the distribution of correlation coefficient ρ, for the case of f=75%, f=50% and f=25%, respectively, indicating that even the faction as low as 25% still gives a reasonable distribution of ρ, mostly within the range of ρ=0.75-0.85. This assessment of sparseness is further analyzed by varying the fraction of both interfacial and non-interfacial residues (SI Fig. 4E), in which a high correlation is still visible. Thus, while a more careful examination should be given on a case-by-case basis, it appears that even spare footprinting data used in the iSPOT can still yield accurate results by providing rather reliable scoring.
3.4. The iSPOT platform accurately predicts the HNF-4α homodimeric structure
The success from the proof-of-principle investigation of TGFβ-FKBP12 allows us to extend the iSPOT modeling to multidomain nuclear receptor complexes. As mentioned previously, a simple rigid-body docking calculation does not seem to be able to predict their target crystal structures (Fig. 1). To examine the iSPOT performance on nuclear receptors, the HNF-4α homodimer was used as a challenging model system. Similar to what was performed for TGFβ-FKBP12, theoretical SAXS and footprinting profiles were back-calculated from its crystal structure (in the middle of Fig. 1) and further used for computing the SAXS-based χ2 and footprinting-based φ2 scores of all RotPPR-docked conformations. Figure 5 shows these iSPOT modeling results of the HNF-4α homodimer.
Figure 5.
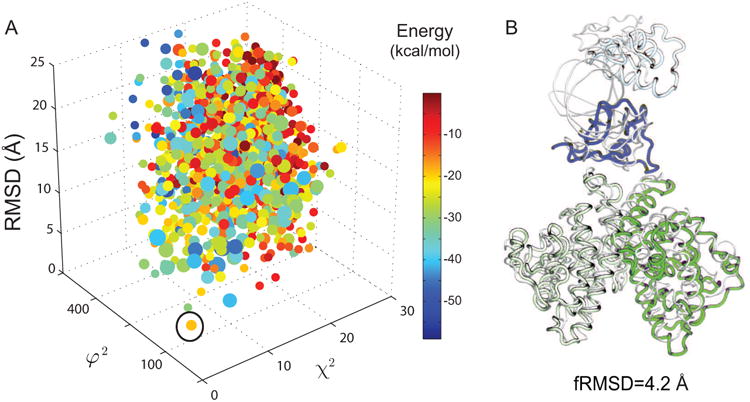
The iSPOT accurately predicts the target crystal structure of the HNF-4α homodimer. (A) The three-dimensional plot of χ2, φ2 (in a unit of Å4), and Ca-RMSD of RotPPR-docked conformations. It should be noted that the best-predicted and lowest-RMSD conformation (marked by an open circle) is not among the low-energy states. The RotPPR simulations consist of 3.125 PPR runs each lasting 5 PPR cycles with a total of 25 ns. Each conformation from oRMSD clustering with a cutoff value of 8 Å is marked in a single dot and colored by its corresponding effective energy. (B) Superposition of the iSPOT-predicted structure (in colors) and its target crystal structure (PDB entry 4IQR), with a Ca-RMSD value of 4.2 Å. Note that the iSPOT-predicted conformation has the second lowest RMSD value, compared to the lowest RMSD conformational cluster (with a RMSD value of 3.9 Å). The fact that the lowest RMSD one is not selected (due to local mis-alignment at the interface with a slightly higher φ2 score), thereby reaffirming the accuracy of iSPOT for modeling such protein-protein complexes.
The results from this iSPOT demonstration are quite impressive in several aspects. First, Figure 5A shows the three-dimensional plot of χ2, φ2, and fRMSD of its RotPPR-simulated conformations. Like TGFβ-FKBP12, a similar conclusion is reached that combining SAXS and footprinting is able to yield a best-fit ensemble structure (marked in an open circle). Second, it is quite remarkable that iSPOT can accurately predict and narrow down the target crystal structure of HNF-4α, where the Ca-RMSD between the best-fit structure and its corresponding crystal structure is only 4.2 Å (see their superposition in Fig. 6B). Third, in spite of this successful prediction with a very low-RMSD value, it is important to note that this iSPOT-predicted conformation is not among the lowest-energy states, as opposed to what was observed in the case of TGFβ-FKBP12 (Fig. 4) where the conformations are funneled through the energy-landscape according to their energetic stability in general. Furthermore, this characteristic may help explain the reason why simple rigid-body docking was not able to correctly predict the HNF-4α structure as shown in Fig. 1 (as we shall see later as well), at least partially due to the use of the energetic stability as a major indicator for such docking prediction. This again suggests the power of integration of multiple biophysical techniques (such as SAXS and footprinting), even if they are not high-resolution on their own. The fact that the iSPOT-predicted structures are very close to their crystal-like conformations, although the energy function itself predicts otherwise, demonstrates that the combined use of SAXS and footprinting, as implemented in iSPOT, is able to narrow down the target structures in a rather remarkable manner.
Figure 6.
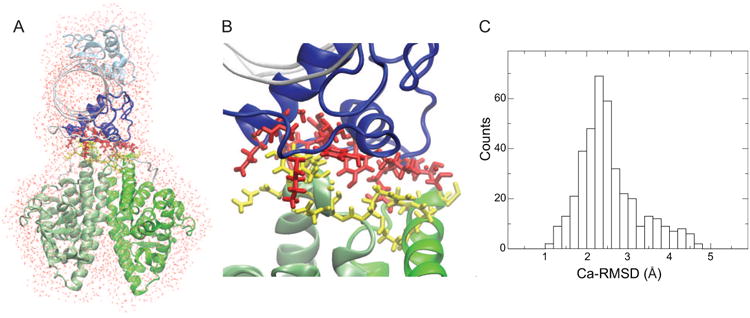
Atomic-level reconstruction of an iSPOT-derived structure by using the crystal structures of individual HNF-4α domains. (A) A representative reconstructed HNF-4α homodimer in a surrounding water box at its atomically-detailed level. The Ca-atom backbone from the best-fit iSPOT-derived model shown in Fig. 4 and atomic structures of individual HNF-4α domains (PDB entry 4IQR) were used for the reconstruction (B) Interfacial details (highlighted in red and yellow) between the DNA-binding (blue) and ligand-binding domain (green) from standard force-field-based molecular dynamics simulations (see Methods). (C) A histogram plot of Ca-RMSD for the full HNF-4α complex from 10 sets of 4ns all-atom, explicit-solvent simulations. The Ca-RMSD difference between the initial and end configurations is 2.96 ± 0.8 Å (based on all 10 sets of MD trajectories).
The success of iSPOT prediction also allows us to reconstruct a full atomistic picture of a full HNF-4α complex. This is achieved by the iSPOT-predicted Ca model of the total complex and the high-resolution structures of individual domain components. In the case of HNF-4α, a simple operation like translation and rotation of atomic-level domain structures was applied on the template of the iSPOT-predicted Ca model. Figure 6A shows an example of a reconstructed water-soaked HNF-4α structure. Subsequently, standard force-field-based molecular dynamics (MD) simulations (see Methods) were performed for the reconstructed atomic-level model. Here, atomic MD simulations are used for the relaxation of the local interactions such as the domain-interacting interface. Figure 6B shows an atomistically-detailed interface between HNF-4α DNA-binding and ligand-binding domains after a short 4ns all-atom simulation. While longer time-scale relaxation may be needed for better characterization of the interface, this local-scale refinement may be sufficient to make testable predictions on certain regions involved in the interface (such as the cluster of amino acids). Note that such a straightforward prediction can be extremely valuable to test the prediction but also to design interface-targeting assays for biological applications. In addition, a set of 10 independent MD runs, each lasting 4ns, were performed, and their RMSD values for Ca atoms were computed (where the reconstructed atomic model in Fig. 6A was used as a reference). Figure 6C shows the Ca-RMSD histogram with a peak around 2.5 Å, suggesting that a local stability is observed for the atomically reconstructed model within the total of 40-ns simulations. We are aware that while they are fairly short for reliable energetic evaluation, these atomic-level simulations may be sufficient for local structural refinement (e.g., removal of any steric clash) for designing experimental validation strategies to test iSPOT predicted structures.
3.5. The use of rigid-body docking in the iSPOT platform
The successful combination of SAXS and footprinting information prompts us to examine the extent to which the use of rigid-body docking for conformer generation in iSPOT. As opposed to RotPPR docking MD simulations for HNF-4α, rigid-body docking computations using ZDOCK were used to generated a set of 10,000 configurations (see Methods) and a total of 1,012 conformations (via oRMSD clustering). Figure 7 shows a three-dimensional plot SAXS-based χ2 and footprinting-based φ2 scores as well as fRMSD values of a subset of docked HNF-4α conformations. Clearly, this alternative method of computational docking used within iSPOT is able to predict that the best-fit conformation (with the lowest χ2 and φ2 scores), although not among the top predictions from docking (ranked 5,356 out of 10,000) has yielded a Ca-RMSD value of 2.8 Å compared to its crystal structure. Given that the domains of HNF-4α is considered as rigid in the docking, one can imagine that this use of rigid-body docking in the iSPOT platform performs well for the prediction, despite the rigid-body assumption. Nonetheless, both the docking-based and RotPPR-based docking calculations are capable of predicting the best-fit HNF-4α conformations via the general framework of iSPOT, i.e., the integration of SAXS, footprinting, and computational docking.
Figure 7.

An alternative use of rigid-body docking, as opposed to RotPPR docking simulations, in iSPOT also accurately predicts the target crystal structure of HNF-4α homodimer. The three-dimensional plot of χ2, φ2 (in a unit of Å4), and Ca-RMSD of the conformations identified from rigid-body docking using ZDock (see Methods). A total of 10,000 docked configurations were generated, which resulted in a set of 1,012 conformations from oRMSD clustering with a cutoff value of 8 Å. The docking-based iSPOT prediction shows that the best-fit conformation (marked by a black circle), although its ranking is quite low (as No 5356 out of 10,000), has a Ca-RMSD value 2.8 Å compared to its crystal structure (excluding domain connecting loops).
3.6. Comparison of iSPOT with other integrative modeling methods
Integrative structure modeling is one of the active research areas in structural biology by combining multiple sources of biophysical data. In fact, several approaches of integrated modeling have been made available in the field. For example, CNS, HADDOCK, and IMP are arguably the three most popular software packages (Brunger et al., 1998; Dominguez et al., 2003; Russel et al., 2012). A key difference among these methods is the primary source of structural information. The CNS gathered information from X-ray crystallography or solution nuclear magnetic resonance (NMR) spectroscopy, but allowing for the use of data from other techniques such as electron microscopy (EM) and solid-state NMR spectroscopy. The HADDOCK was originally developed for the analysis of NMR data (and especially for chemical shift perturbation data), except for cryo-EM and SAXS data, although it has begun to include both SAXS and EM data. The IMP developed in the Sali group was initially focused on modeling EM data, but has the capability to incorporate different types of data (such as cryo-EM, X-ray crystallography, and chemical cross-linking) in a remarkable way for modeling gigantic molecular complexes such as the nuclear pore complex (Alber et al., 2007). In contrast to these three existing methods, a key focus of iSPOT is placed on the complementarity of SAXS and footprinting: one about overall shape and the other about site-specific protection/accessibility.
From the standpoint of practical applications, it fills the gap in modeling a large range of protein-protein complexes that are too big for NMR and too small for EM. Another technical advantage of iSPOT is the capability of handling coarse-grained protein structures due to the use of our Fast-SAXS-pro computing algorithm that was developed specifically for coarse-grained modeling, while other methods would require atomic coordinates to derive a meaningful structural picture of each protein complex when SAXS data were included. Together, these features enable iSPOT to perform accurate structural modeling in its own integrative fashion, especially for the mid-size range of various multiprotein complexes.
4. Concluding remarks
The structural characterization of large protein-protein complexes, such as multidomain nuclear receptors, has been challenging for individual computational/experimental techniques. To address this issue, we have introduced a combined iSPOT platform that integrates small-angle X-ray scattering (SAXS), hydroxyl radical footprinting, and computational docking (powered via either rigid-body docking or an exhaustive RotPPR search engine). Using two exemplary model systems, the iSPOT approach of integrative structure modeling is demonstrated to accurately predict the target crystal structures of TGFβ-FKBP12 (433 residues) and the HNF-4α homodimer (640 residues) with a RMSD value of 3.3 Å and 4.2 Å from their corresponding target structures, respectively. It should be noted that while RotPPR-derived MD simulations are extensively used in iSPOT, it may become more computationally achievable to directly use rigid-body docking (as shown for the case of HNF-4α), especially when no floppy structural units (e.g., flexible loops) are blocking the interface formation. Nonetheless, as more realistic examples will be communicated elsewhere, this proof-of-principle study shows that iSPOT—that takes advantage of the power of integration of SAXS-based shape information and footprinting-based protection/accessibility of protein surfaces as well as docked putative poses from computational docking—is capable of narrowing down the target crystal structures. In passing, we wish to mention that the modular nature of this iSPOT platform also enables us to include other biophysical data besides aforementioned SAXS and footprinting, in a rather expandable way, thereby adding to the toolkit of integrated structure modeling of many multiprotein complexes that have been long challenging in the field.
Supplementary Material
Acknowledgments
We thank Benoit Roux and Matthias Buck for their valued discussion and Blake Crochet for his careful proofreading. The work was supported in part by the National Institutes of Health (grant no R01GM114056) and by the Ohio Supercomputer Center.
Footnotes
Publisher's Disclaimer: This is a PDF file of an unedited manuscript that has been accepted for publication. As a service to our customers we are providing this early version of the manuscript. The manuscript will undergo copyediting, typesetting, and review of the resulting proof before it is published in its final citable form. Please note that during the production process errors may be discovered which could affect the content, and all legal disclaimers that apply to the journal pertain.
References
- Alber F, Dokudovskaya S, Veenhoff LM, Zhang W, Kipper J, Devos D, Suprapto A, Karni-Schmidt O, Williams R, Chait BT, Rout MP, Sali A. Determining the architectures of macromolecular assemblies. Nature. 2007;450:683–694. doi: 10.1038/nature06404. [DOI] [PubMed] [Google Scholar]
- Bernado P, Blackledge M. Structural biology: Proteins in dynamic equilibrium. Nature. 2010;468:1046–1048. doi: 10.1038/4681046a. [DOI] [PubMed] [Google Scholar]
- Boura E, Rozycki B, Herrick DZ, Chung HS, Vecer J, Eaton WA, Cafiso DS, Hummer G, Hurley JH. Solution structure of the ESCRT-I complex by small-angle X-ray scattering, EPR, and FRET spectroscopy. Proc Natl Acad Sci U S A. 2011;108:9437–9442. doi: 10.1073/pnas.1101763108. [DOI] [PMC free article] [PubMed] [Google Scholar]
- Brooks BR, Bruccoleri RE, Olafson BD, States DJ, Swaminathan S, Karplus M. Charmm - a Program for Macromolecular Energy, Minimization, and Dynamics Calculations. J Comput Chem. 1983;4:187–217. [Google Scholar]
- Brunger AT, Adams PD, Clore GM, DeLano WL, Gros P, Grosse-Kunstleve RW, Jiang JS, Kuszewski J, Nilges M, Pannu NS, Read RJ, Rice LM, Simonson T, Warren GL. Crystallography & NMR system: A new software suite for macromolecular structure determination. Acta Crystallogr D Biol Crystallogr. 1998;54:905–921. doi: 10.1107/s0907444998003254. [DOI] [PubMed] [Google Scholar]
- Burkhard P, Taylor P, Walkinshaw MD. X-ray structures of small ligand-FKBP complexes provide an estimate for hydrophobic interaction energies. J Mol Biol. 2000;295:953–962. doi: 10.1006/jmbi.1999.3411. [DOI] [PubMed] [Google Scholar]
- Case DA, Cheatham TE, 3rd, Darden T, Gohlke H, Luo R, Merz KM, Jr, Onufriev A, Simmerling C, Wang B, Woods RJ. The Amber biomolecular simulation programs. J Comput Chem. 2005;26:1668–1688. doi: 10.1002/jcc.20290. [DOI] [PMC free article] [PubMed] [Google Scholar]
- Chambon P. The nuclear receptor superfamily: a personal retrospect on the first two decades. Mol Endocrinol. 2005;19:1418–1428. doi: 10.1210/me.2005-0125. [DOI] [PubMed] [Google Scholar]
- Chandra V, Huang P, Potluri N, Wu D, Kim Y, Rastinejad F. Multidomain integration in the structure of the HNF-4alpha nuclear receptor complex. Nature. 2013;495:394–398. doi: 10.1038/nature11966. [DOI] [PMC free article] [PubMed] [Google Scholar]
- Chandra V, Huang P, Hamuro Y, Raghuram S, Wang Y, Burris TP, Rastinejad F. Structure of the intact PPAR-gamma-RXR- nuclear receptor complex on DNA. Nature. 2008;456:350–356. doi: 10.1038/nature07413. [DOI] [PMC free article] [PubMed] [Google Scholar]
- Dellago C, Bolhuis PG, Csajka FS, Chandler D. Transition path sampling and the calculation of rate constants. Journal of Chemical Physics. 1998;108:1964–1977. [Google Scholar]
- Dominguez C, Boelens R, Bonvin AM. HADDOCK: a protein-protein docking approach based on biochemical or biophysical information. J Am Chem Soc. 2003;125:1731–1737. doi: 10.1021/ja026939x. [DOI] [PubMed] [Google Scholar]
- Elcock AH, Sept D, McCammon JA. Computer simulation of protein-protein interactions. J Phys Chem B. 2001;105:1504–1518. [Google Scholar]
- Feig M, Karanicolas J, Brooks CL., 3rd MMTSB Tool Set: enhanced sampling and multiscale modeling methods for applications in structural biology. J Mol Graph Model. 2004;22:377–395. doi: 10.1016/j.jmgm.2003.12.005. [DOI] [PubMed] [Google Scholar]
- Gan W, Yang S, Roux B. Atomistic view of the conformational activation of Src kinase using the string method with swarms-of-trajectories. Biophys J. 2009;97:L8–L10. doi: 10.1016/j.bpj.2009.06.016. [DOI] [PMC free article] [PubMed] [Google Scholar]
- Grishaev A, Tugarinov V, Kay LE, Trewhella J, Bax A. Refined solution structure of the 82-kDa enzyme malate synthase G from joint NMR and synchrotron SAXS restraints. J Biomol NMR. 2008;40:95–106. doi: 10.1007/s10858-007-9211-5. [DOI] [PubMed] [Google Scholar]
- Hambly DM, Gross ML. Laser flash photolysis of hydrogen peroxide to oxidize protein solvent-accessible residues on the microsecond timescale. J Am Soc Mass Spectrom. 2005;16:2057–2063. doi: 10.1016/j.jasms.2005.09.008. [DOI] [PubMed] [Google Scholar]
- Hamelberg D, Shen T, Andrew McCammon J. Relating kinetic rates and local energetic roughness by accelerated molecular-dynamics simulations. J Chem Phys. 2005;122:241103. doi: 10.1063/1.1942487. [DOI] [PubMed] [Google Scholar]
- Helsen C, Claessens F. Looking at nuclear receptors from a new angle. Mol Cell Endocrinol. 2014;382:97–106. doi: 10.1016/j.mce.2013.09.009. [DOI] [PubMed] [Google Scholar]
- Hornak V, Abel R, Okur A, Strockbine B, Roitberg A, Simmerling C. Comparison of multiple Amber force fields and development of improved protein backbone parameters. Proteins. 2006;65:712–725. doi: 10.1002/prot.21123. [DOI] [PMC free article] [PubMed] [Google Scholar]
- Huang W, Ravikumar KM, Yang SC. A Newfound Cancer-Activating Mutation Reshapes the Energy Landscape of Estrogen-Binding Domain. J Chem Theory Comput. 2014a;10:2897–2900. doi: 10.1021/ct500313e. [DOI] [PubMed] [Google Scholar]
- Huang W, Ravikumar KM, Yang S. A Newfound Cancer-Activating Mutation Reshapes the Energy Landscape of Estrogen-Binding Domain. J Chem Theory Comput. 2014b;10:2897–2900. doi: 10.1021/ct500313e. [DOI] [PubMed] [Google Scholar]
- Huang W, Greene GL, Ravikumar KM, Yang S. Cross-talk between the ligand- and DNA-binding domains of estrogen receptor. Proteins. 2013;81:1900–1909. doi: 10.1002/prot.24331. [DOI] [PubMed] [Google Scholar]
- Huang W, Ravikumar KM, Chance MR, Yang S. Quantitative mapping of protein structure by hydroxyl radical footprinting-mediated structural mass spectrometry: a protection factor analysis. Biophys J. 2015;108:107–115. doi: 10.1016/j.bpj.2014.11.013. [DOI] [PMC free article] [PubMed] [Google Scholar]
- Huse M, Chen YG, Massague J, Kuriyan J. Crystal structure of the cytoplasmic domain of the type I TGF beta receptor in complex with FKBP12. Cell. 1999;96:425–436. doi: 10.1016/s0092-8674(00)80555-3. [DOI] [PubMed] [Google Scholar]
- Huse M, Muir TW, Xu L, Chen YG, Kuriyan J, Massague J. The TGF beta receptor activation process: an inhibitor- to substrate-binding switch. Mol Cell. 2001;8:671–682. doi: 10.1016/s1097-2765(01)00332-x. [DOI] [PubMed] [Google Scholar]
- Janin J. Protein-protein docking tested in blind predictions: the CAPRI experiment. Mol Biosyst. 2010;6:2351–2362. doi: 10.1039/c005060c. [DOI] [PubMed] [Google Scholar]
- Jiang W, Phillips JC, Huang L, Fajer M, Meng YL, Gumbart JC, Luo Y, Schulten K, Roux B. Generalized scalable multiple copy algorithms for molecular dynamics simulations in NAMD. Comput Phys Commun. 2014;185:908–916. doi: 10.1016/j.cpc.2013.12.014. [DOI] [PMC free article] [PubMed] [Google Scholar]
- Kamal JKA, Chance MR. Modeling of protein binary complexes using structural mass spectrometry data. Protein Sci. 2008;17:79–94. doi: 10.1110/ps.073071808. [DOI] [PMC free article] [PubMed] [Google Scholar]
- Karaca E, Melquiond AS, de Vries SJ, Kastritis PL, Bonvin AM. Building macromolecular assemblies by information-driven docking: introducing the HADDOCK multibody docking server. Mol Cell Proteomics. 2010;9:1784–1794. doi: 10.1074/mcp.M000051-MCP201. [DOI] [PMC free article] [PubMed] [Google Scholar]
- Karpen ME, Tobias DJ, Brooks CL., 3rd Statistical clustering techniques for the analysis of long molecular dynamics trajectories: analysis of 2.2-ns trajectories of YPGDV. Biochemistry. 1993;32:412–420. doi: 10.1021/bi00053a005. [DOI] [PubMed] [Google Scholar]
- Kaur P, Kiselar J, Yang S, Chance MR. Quantitative protein topography analysis and high-resolution structure prediction using hydroxyl radical labeling and tandem-ion mass spectrometry. Mol Cell Proteomics. 2015;14:1159–1168. doi: 10.1074/mcp.O114.044362. [DOI] [PMC free article] [PubMed] [Google Scholar]
- Kim YC, Hummer G. Coarse-grained models for simulations of multiprotein complexes: application to ubiquitin binding. J Mol Biol. 2008;375:1416–1433. doi: 10.1016/j.jmb.2007.11.063. [DOI] [PMC free article] [PubMed] [Google Scholar]
- Koch MH, Vachette P, Svergun DI. Small-angle scattering: a view on the properties, structures and structural changes of biological macromolecules in solution. Q Rev Biophys. 2003;36:147–227. doi: 10.1017/s0033583503003871. [DOI] [PubMed] [Google Scholar]
- Kumar S, Rosenberg JM, Bouzida D, Swendsen RH, Kollman PA. Multidimensional Free-Energy Calculations Using the Weighted Histogram Analysis Method. J Comput Chem. 1995;16:1339–1350. [Google Scholar]
- Lou X, Toresson G, Benod C, Suh JH, Philips KJ, Webb P, Gustafsson JA. Structure of the retinoid X receptor alpha-liver X receptor beta (RXRalpha-LXRbeta) heterodimer on DNA. Nat Struct Mol Biol. 2014;21:277–281. doi: 10.1038/nsmb.2778. [DOI] [PubMed] [Google Scholar]
- Maleknia SD, Downard KM. Advances in radical probe mass spectrometry for protein footprinting in chemical biology applications. Chem Soc Rev. 2014;43:3244–3258. doi: 10.1039/c3cs60432b. [DOI] [PubMed] [Google Scholar]
- Miyazawa S, Jernigan RL. Residue-residue potentials with a favorable contact pair term and an unfavorable high packing density term, for simulation and threading. J Mol Biol. 1996;256:623–644. doi: 10.1006/jmbi.1996.0114. [DOI] [PubMed] [Google Scholar]
- Pierce BG, Wiehe K, Hwang H, Kim BH, Vreven T, Weng Z. ZDOCK server: interactive docking prediction of protein-protein complexes and symmetric multimers. Bioinformatics. 2014;30:1771–1773. doi: 10.1093/bioinformatics/btu097. [DOI] [PMC free article] [PubMed] [Google Scholar]
- Putnam CD, Hammel M, Hura GL, Tainer JA. X-ray solution scattering (SAXS) combined with crystallography and computation: defining accurate macromolecular structures, conformations and assemblies in solution. Q Rev Biophys. 2007;40:191–285. doi: 10.1017/S0033583507004635. [DOI] [PubMed] [Google Scholar]
- Rambo RP, Tainer JA. Accurate assessment of mass, models and resolution by small-angle scattering. Nature. 2013;496:477–481. doi: 10.1038/nature12070. [DOI] [PMC free article] [PubMed] [Google Scholar]
- Ravikumar KM, Huang W, Yang S. Coarse-grained simulations of protein-protein association: an energy landscape perspective. Biophys J. 2012;103:837–845. doi: 10.1016/j.bpj.2012.07.013. [DOI] [PMC free article] [PubMed] [Google Scholar]
- Ravikumar KM, Huang W, Yang S. Fast-SAXS-pro: a unified approach to computing SAXS profiles of DNA, RNA, protein, and their complexes. J Chem Phys. 2013;138:024112. doi: 10.1063/1.4774148. [DOI] [PMC free article] [PubMed] [Google Scholar]
- Robinson CV, Sali A, Baumeister W. The molecular sociology of the cell. Nature. 2007;450:973–982. doi: 10.1038/nature06523. [DOI] [PubMed] [Google Scholar]
- Roux B. The Calculation of the Potential of Mean Force Using Computer-Simulations. Comput Phys Commun. 1995;91:275–282. [Google Scholar]
- Russel D, Lasker K, Webb B, Velazquez-Muriel J, Tjioe E, Schneidman-Duhovny D, Peterson B, Sali A. Putting the pieces together: integrative modeling platform software for structure determination of macromolecular assemblies. PLoS Biol. 2012;10:e1001244. doi: 10.1371/journal.pbio.1001244. [DOI] [PMC free article] [PubMed] [Google Scholar]
- Sharp JS, Becker JM, Hettich RL. Analysis of protein solvent accessible surfaces by photochemical oxidation and mass spectrometry. Anal Chem. 2004;76:672–683. doi: 10.1021/ac0302004. [DOI] [PubMed] [Google Scholar]
- Solernou A, Fernandez-Recio J. Protein docking by Rotation-Based Uniform Sampling (RotBUS) with fast computing of intermolecular contact distance and residue desolvation. BMC Bioinformatics. 2010;11:352. doi: 10.1186/1471-2105-11-352. [DOI] [PMC free article] [PubMed] [Google Scholar]
- Sugita Y, Okamoto Y. Replica-exchange molecular dynamics method for protein folding. Chem Phys Lett. 1999;314:141–151. [Google Scholar]
- Tong D, Yang S, Lu L. Accurate optimization of amino acid form factors for computing small-angle X-ray scattering intensity of atomistic protein structures. Journal of Applied Crystallography. 2016;49 doi: 10.1107/S1600576716007962. [DOI] [PMC free article] [PubMed] [Google Scholar]
- Tullius TD, Dombroski BA. Hydroxyl radical “footprinting”: high-resolution information about DNA-protein contacts and application to lambda repressor and Cro protein. Proc Natl Acad Sci U S A. 1986;83:5469–5473. doi: 10.1073/pnas.83.15.5469. [DOI] [PMC free article] [PubMed] [Google Scholar]
- Whitford PC, Ahmed A, Yu Y, Hennelly SP, Tama F, Spahn CM, Onuchic JN, Sanbonmatsu KY. Excited states of ribosome translocation revealed through integrative molecular modeling. Proc Natl Acad Sci U S A. 2011;108:18943–18948. doi: 10.1073/pnas.1108363108. [DOI] [PMC free article] [PubMed] [Google Scholar]
- Xu G, Chance MR. Hydroxyl radical-mediated modification of proteins as probes for structural proteomics. Chem Rev. 2007;107:3514–3543. doi: 10.1021/cr0682047. [DOI] [PubMed] [Google Scholar]
- Yang S, Onuchic JN, Levine H. Effective stochastic dynamics on a protein folding energy landscape. J Chem Phys. 2006;125:054910. doi: 10.1063/1.2229206. [DOI] [PubMed] [Google Scholar]
- Yang S, Onuchic JN, Garcia AE, Levine H. Folding time predictions from all-atom replica exchange simulations. J Mol Biol. 2007;372:756–763. doi: 10.1016/j.jmb.2007.07.010. [DOI] [PubMed] [Google Scholar]
- Yang S, Park S, Makowski L, Roux B. A rapid coarse residue-based computational method for x-ray solution scattering characterization of protein folds and multiple conformational states of large protein complexes. Biophys J. 2009;96:4449–4463. doi: 10.1016/j.bpj.2009.03.036. [DOI] [PMC free article] [PubMed] [Google Scholar]
- Yang S, Parisien M, Major F, Roux B. RNA structure determination using SAXS data. J Phys Chem B. 2010a;114:10039–10048. doi: 10.1021/jp1057308. [DOI] [PMC free article] [PubMed] [Google Scholar]
- Yang S, Blachowicz L, Makowski L, Roux B. Multidomain assembled states of Hck tyrosine kinase in solution. Proc Natl Acad Sci U S A. 2010b;107:15757–15762. doi: 10.1073/pnas.1004569107. [DOI] [PMC free article] [PubMed] [Google Scholar]
- Yang SC. Methods for SAXS-Based Structure Determination of Biomolecular Complexes. Adv Mater. 2014;26:7902–7910. doi: 10.1002/adma.201304475. [DOI] [PMC free article] [PubMed] [Google Scholar]
- Zacharias M. Protein-protein docking with a reduced protein model accounting for side-chain flexibility. Protein Sci. 2003;12:1271–1282. doi: 10.1110/ps.0239303. [DOI] [PMC free article] [PubMed] [Google Scholar]
Associated Data
This section collects any data citations, data availability statements, or supplementary materials included in this article.