

Abstract
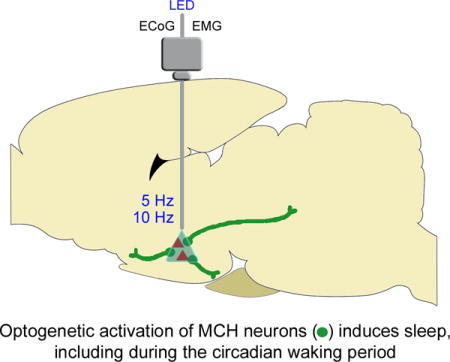
Neurons containing melanin-concentrating hormone (MCH) are located in the hypothalamus. In mice optogenetic activation of the MCH neurons induces both NREM and REM sleep at night, the normal wake-active period for nocturnal rodents (Konadhode et al., 2013). Here we selectively activate these neurons in rats to test the validity of the sleep network hypothesis in another species. Channelrhodopsin-2 (ChR2) driven by the MCH promoter was selectively expressed by MCH neurons after injection of rAAV-MCHp-ChR2-EYFP into the hypothalamus of Long-Evans rats. An in vitro study confirmed that the optogenetic activation of MCH neurons faithfully triggered action potentials. In the second study, in Long-Evans rats, rAAV-MCH-ChR2, or the control vector, rAAV-MCH-EYFP, were delivered into the hypothalamus. Three weeks later baseline sleep was recorded for 48h without optogenetic stimulation (0 Hz). Subsequently, at the start of the lights-off cycle, the MCH neurons were stimulated at 5, 10, or 30Hz (1 mW at tip; 1 min on – 4 min off) for 24 h. Sleep was recorded during the 24h stimulation period. Optogenetic activation of MCH neurons increased both REM and NREM sleep at night, whereas during the day cycle only REM sleep was increased. Delta power, an indicator of sleep intensity, was also increased. In control rats without ChR2, optogenetic stimulation did not increase sleep or delta power. These results lend further support to the view that sleep-active MCH neurons contribute to drive sleep in mammals.
Keywords: Channelrhodopsin-2, REM sleep, rat, melanin concentrating hormone, recombinant adenoassociated virus
Graphical abstract
Neurons containing melanin concentrating hormone (MCH) or orexin are localized in the posterior hypothalamus. Activation of orexin neurons produces arousal, but the function of the MCH neurons is less clear. In mice, we determined that optogenetic activation of MCH neurons increases sleep at night. We now find that in wildtype rats activating these neurons also increases sleep and delta power. Such consistent results in two mammals underscore the role of the MCH neurons as drivers of sleep.
Introduction
In the last hundred years successive groups of researchers have used new tools to identify neurons responsible for wake, non-rapid-eye movement (NREM) sleep and REM sleep [reviewed by (Konadhode et al., 2014)]. Initially, transections and electrolytic lesions helped locate the brain regions responsible for the different sleep-wake states (Jouvet, 1962). Subsequently, electrophysiology studies in freely-behaving animals identified neurons that were active only during a specific sleep-wake state (McCarley & Hobson, 1971; Chu & Bloom, 1973; McGinty & Harper, 1976; Siegel & McGinty, 1977; Aston-Jones & Bloom, 1981; Szymusiak & McGinty, 1986; Mileykovskiy et al., 2005; Hassani et al., 2009) indicating that activity of specific neurons regulated the sleep-wake states. The introduction of c-FOS as a functional neuroanatomical tool led to identifying the phenotype of neurons that were activated during sleep-wake states and also determined the connectivity between these neurons (Sherin et al., 1996; Basheer et al., 1997). The collective data from those studies has resulted in a neural network map that illustrates the various phenotypes of neurons regulating waking, NREM and REM sleep (Saper et al., 2010; Shiromani, 2011; Pelluru et al., 2013).
Currently, optogenetics and pharmacogenetics are being used to directly test specific cell elements of this circuit. For instance, optogenetic activation of the arousal orexin neurons increased transitions to waking (Adamantidis et al., 2007) whereas inhibition resulted in sleep (Tsunematsu et al., 2011). Similar results were observed using the pharmacogenetic approach (Sasaki et al., 2011). Optogenetic activation of the noradrenergic locus coeruleus (LC) neurons also increased waking while photoinhibition decreased the length of the wake bouts (Carter et al., 2010). Pharmacogenetic activation of LC neurons ameliorated the excessive sleepiness in a mouse model of narcolepsy (Hasegawa et al., 2014). Optogenetics has also been used to drive neurons implicated in generating sleep. One phenotype of sleep-active neurons contains melanin concentrating hormone (MCH) (Hassani et al., 2009). MCH neurons are intermingled with the orexin neurons and project to many of the same targets as orexin neurons (Bittencourt et al., 1992; Steininger et al., 2004; Yoon & Lee, 2013). In wildtype mice we found that optogenetic activation of the MCH neurons increased sleep at a time when the mice would be normally awake. Subsequently, another group used MCH-cre mice and determined that acute stimulation during NREM sleep increased entries into REM sleep (Jego et al., 2013). Another group (Tsunematsu et al., 2014) genetically ablated the MCH neurons and found decreased amounts of NREM sleep without changing REM sleep. These studies in mice demonstrate that selective activation of MCH neurons increases sleep, and loss of these neurons decreases NREM sleep.
Optogenetic studies need to be performed in other mammalian species that have both NREM and REM sleep, thereby validating the status of specific neurons within neural network models of sleep-wake regulation. To facilitate such studies, we linked the gene encoding channelrhodopsin-2 (ChR2) to the MCH promoter. In the present study, this virus was inserted into wildtype rats to test the hypothesis that activation of MCH neurons induces sleep not only in mice but also in another mammal.
Materials and Methods
Ethical statement
All manipulations done to the animals adhered to the NIH Guide for the Care and Use of Laboratory Animals and were pre-approved by the Medical University of South Carolina (protocol 3355), Ralph H. Johnson VA (protocol 525, 584), and Yale University (protocol 2014-10117) Institutional Animal Care and Use Committee.
Viral vectors
The parent plasmid containing channelrhodopsin-2 gene (ChR2; H134R) was kindly donated by Dr. Karl Deisseroth (Stanford University/HHMI). The genes for ChR2 and enhanced yellow fluorescent protein (EYFP) were originally driven into neurons by the human synapsin promoter (hSyn-485 bp). We modified it by replacing the hSyn-485 with the MCH promoter sequence (462 bp). The MCH specific plasmid was then packaged by the Vector Core at the University of North Carolina (Chapel Hill, NC). The plasmid was packaged into recombinant adeno-associated viral vectors (rAAV; serotype 5) to a titer of 1×10¹⁰ particles per μL. The control vector containing no ChR2 gene (rAAV-MCH-EYFP) was constructed as previously described (Liu et al., 2011). After packaging, the MCH specific viral vectors were always stored at −85°C and thawed just before delivery into the brain.
In vitro studies
Optogenetic stimulation of the MCH neurons
rAAV-MCH-ChR2-EYFP was injected into the lateral hypothalamus of five adult rats. Four to five weeks later, rats with selective ChR2 expression in lateral hypothalamic MCH neurons were deeply anesthetized with isoflurane and decapitated. Brains were immediately removed and immersed in ice-cold high-sucrose solution containing (in mM): 220 sucrose, 2.5 KCl, 6 MgCl2, 1 CaCl2, 1.23 NaH2PO4, 26 NaHCO3, and 10 glucose (gassed with 95% O2/5% CO2; 300–305 mOsm). Coronal brain slices (300 μm thick; vibratome) were transferred to an incubation chamber filled with artificial CSF (aCSF) solution containing (in mM) 124 NaCl, 2.5 KCl, 2 MgCl2, 2 CaCl2, 1.23 NaH2PO4, 26 NaHCO3, and 10 glucose (gassed with 95% O2/5% CO2; 300–305 mOsm) at room temperature (22 °C). Following a recovery period of 1–2 h, slices were transferred to a recording chamber mounted on a BX51WI upright microscope (Olympus, Tokyo, Japan). The slices were perfused with a continuous flow of gassed ACSF. The temperature of the recording solution was maintained at 33 ± 1 °C by a dual-channel heat controller (Warner Instruments, Hamden, CT). For comparison, we also recorded mouse MCH neurons from transgenic mice with GFP expressed in the MCH neurons, as described elsewhere (van den Pol et al., 2004; Zhang & van den Pol, 2012).
MCH neurons with ChR2-EYFP expression were visualized using an infrared-differential interference contrast optical system combined with a monochrome CCD camera and monitor. Pipettes were pulled from thin-walled borosilicate glass capillary tubes (length 75 mm, O.D=1.5 mm, I.D.= 1.1 mm, World Precision Instruments, Sarasota, FL) using a P-97 micropipette puller (Sutter Instruments, Novato, CA). A pipette solution containing (in mM) 145 K-gluconate, 1 MgCl2, 10 HEPES, 1.1 EGTA, 2 Mg-ATP, 0.5 Na2-GTP, and 5 Na2-phosphocreatine (pH 7.3 with KOH; 290–295 mOsm) was used for the recording. Recording pipettes showed resistances ranging from 3 to 6 MΩ. An EPC-10 patch-clamp amplifier (HEKA Instruments, Bellmore, NY) and PatchMaster 2.20 software (HEKA Elektronik, Lambrecht/Pfalz, Germany) were used to acquire and analyze data. Neurons with series resistance greater than 20 MΩ and change of greater than 15% were excluded from the statistical analysis. Traces were processed using Igor Pro 6.36 (Wavemetrics, Lake Oswego, OR). The membrane potential for voltage-clamp recording was held at −60 mV. A blue light laser (470 nm, Laserglow Technologies, West Toronto, CA) set at 5–10 mWatts/mm2 was used to activate ChR2 in the MCH neurons. The blue light was delivered by a fiber optic (tip I.D.=100 μm, NA 0.22, Doric lenses, CA) to the recorded neuron. To test the photostimulation-evoked response, stimuli of 10 msec duration with fixed frequencies of 1, 5, 10, 20 and 30 Hz were used. Evoked response of transfected MCH neurons was recorded in voltage and current clamp conditions.
In vivo studies
Animals and groups
Fourteen Long Evans adult rats (545.3 ± 41.3g; male) were used. Ten rats received rAAV-MCH-ChR2-EYFP while the other four rats received the control vector lacking ChR2 (rAAV-MCH-EYFP). All rats were housed singly in an isolated room, with controlled temperature (22 ± 2°C) and lighting (photoperiod =12:12 h; lights-off at 6 PM). Food and water were available ad-libitum.
Gene transfection
Under deep isofluorane anesthesia (1.5–2%) and aseptic conditions viral vectors were microinjected bilaterally into two adjacent rat brain sites targeting the entire population of MCH neurons (lateral zona incerta and perifornical area: AP= −2.8 mm, lateral= ±1.6 mm, vertical= −7.8 mm; medial zona incerta and dorsomedial hypothalamic area: AP= −3.1 mm, lateral= ± 0.8 mm, vertical= −7.8 mm). The coordinates are relative to bregma, lateral to the sagittal suture and vertical to the dura mater. For the lateral site the volume of injection was 2 μl and for the medial site it was 1 μl. Therefore, in both hemispheres a total of 6 μl was microinjected (virus load of 6×10¹⁰ particles per rat). The virus was delivered slowly over 20 min using a 10 μL Hamilton syringe. Following the microinjection, the injection needle (30 Ga) was left in place for an additional 5 min and then withdrawn slowly.
Fiber optic and electrodes implant
Two weeks after delivery of the viral vectors, the fiber optic probes and sleep recording electrodes were surgically implanted (under 2% isoflurane anesthesia). Two fiber optic probes (0.4 mm diameter), one in each hemisphere, were implanted at antero-posterior −2.9 mm, lateral −1.4 mm and vertical −7.0 mm. To record the electrocorticogram (ECoG) four miniature screws (Plastic One Inc.) were inserted to sit atop the frontal and occipital cerebral cortices. To record the skeletal muscle activity (EMG), two flexible wire electrodes (Plastic One Inc.) were bilaterally embedded into the nuchal muscles. The wires were inserted into a plastic socket, and along with the optic probes, affixed to the skull with dental cement.
Optogenetic stimulation of MCH neurons
Five weeks after the rAAV vector delivery rats were tethered to a light-weight cable connected to rotary swivels. The swivels allowed the rats to engage in complete freedom of behavior. Rats were adapted to tethering for four days and baseline sleep was recorded for 48 h. During this first sleep recording session there was no optogenetic stimulation and this initial session represents 0 Hz.
Following the baseline recording, the rats were given optogenetic stimulation (blue LED, 473 nm wavelength; 1 mW intensity at tip; Doric Lenses, Québec, Canada). A programmable stimulator (Master-9, AMPI, Jerusalem, Israel) generated TTL pulses of 10 msec of duration for driving the photo stimuli. TTLs pulses were also recorded along with the ECoG and EMG activity. MCH neurons were activated by light at three frequencies: 5, 10, or 30 Hz (ON for 1 min and OFF for 4 min). The rats were stimulated for 24 h starting at lights-off (Zeitgeber hour 12). There was a 72 h interval between stimulation days and stimulation protocols were followed in a counterbalanced fashion. In 24 h MCH neurons were given 8.64 × 10⁴ pulses at 5 Hz, 1.73 × 10⁵ at 10 Hz and 5.18 × 10⁵ at 30 Hz. MCH neurons were activated 1.0 % of total time in 24 h at 5 Hz, 2.0% at 10 Hz and 6.0% at 30 Hz.
Sleep recording, scoring and spectral analysis
The ECoG activity was recorded from the contralateral frontal-occipital electrodes. Using an analog polygraph (Grass Model 12), the ECoG activity was amplified 5000 times and band pass filtered between 0.3–100 Hz. To record the EMG activity, the muscle electrical activity was amplified between 5000–20,000 times and band pass filtered between 100–1 KHz. ECoG and EMG analog signals were then digitized and stored (at 128 Hz sampling rate) onto a computer hard drive by a data acquisition software (Vital Recorder, Kissei Comtec Co., Nagano, Japan). The acquisition software also stored and synchronized video streams of the rat’s behavior. Video was recorded with infrared CCD cameras that allowed recording of the animal’s behavior in the dark.
The sleep records were scored in 12 sec epochs based on the Fast Fourier Transformation (FFT) algorithm of the ECoG activity for the delta bandwidth (0.5–4 Hz) along with the EMG integrated activity (SleepSign®, Kissei Comtec Co. Nagano, Japan). Each epoch was then manually scored as wake, non-REM sleep (NREM) or REM sleep (REMS). Video recordings assisted the identification of the sleep-wake states.
SleepSign was also used to produce a FFT analysis of the ECoG during NREMS and REMS. Both delta (0.5–4 Hz) and theta (4–8 Hz) power were automatically determined by the software. ECoG FFT data was calculated in 3 h bins. ECoG FFT values for the 0 Hz day were normalized as percent of the 24 h average. Then power values during photostimulation days were expressed as percent of the 0 Hz power.
Post mortem analysis of transfected rat brains
At the end of the in-vivo experiments, rats were euthanized (5% isofluorane) and the brains perfused with 50 ml 0.9% saline and 150 ml 10% formalin-buffered solution. The brains were removed, left overnight in 10 % formalin PBS at 4 °C, and then transferred to a sucrose 30% PBS solution until equilibration. The brains were cut on a cryostat and 40 μm thick coronal sections obtained.
The first and third sections, in a 1 in 5 series, were processed for immunolabeling of the MCH peptide. The brain sections were first washed to remove the cryoprotectant (PBS 0.01 M), then placed in normal donkey serum (2% in PBS+0.3% Triton-x). Sections were then incubated overnight at room temperature (RT) with the primary antibody (rabbit anti-MCH; 1:1000 dilution; Phoenix Pharmaceuticals, Cat # H070-47). Next day, after washing in PBS, the sections were incubated at RT for 1 h with donkey anti-rabbit IgG secondary antibody (Alexa Fluor® 568 conjugate; 1:500 dilutions, Life Technologies; Cat # A10042). Sections were then mounted onto gelatin coated glass slides, cover slipped, and stored at −20 °C. Hypothalamic tissue from one well in the animal depicted in figure 3 was incubated in goat anti-orexin antibody (1:500 dilution, Phoenix Pharmaceuticals, Cat #H003-30) to visualize orexin-immunoreactive neurons in conjunction with EYFP. To further test for specificity of the transgene construct a separate rat (off-site control) was given the rAAV-MCH-ChR2-EYFP into the caudate putamen (one side; 750 nl) where no MCH neurons are located. In this off-site control rat, a single injection (one side; 750nl) was also made in the zona incerta to confirm the efficacy of the vector. The rat was sacrificed 18 days after injection, and brain tissue was processed for visualization of the EYFP+ neurons.
Figure 3.
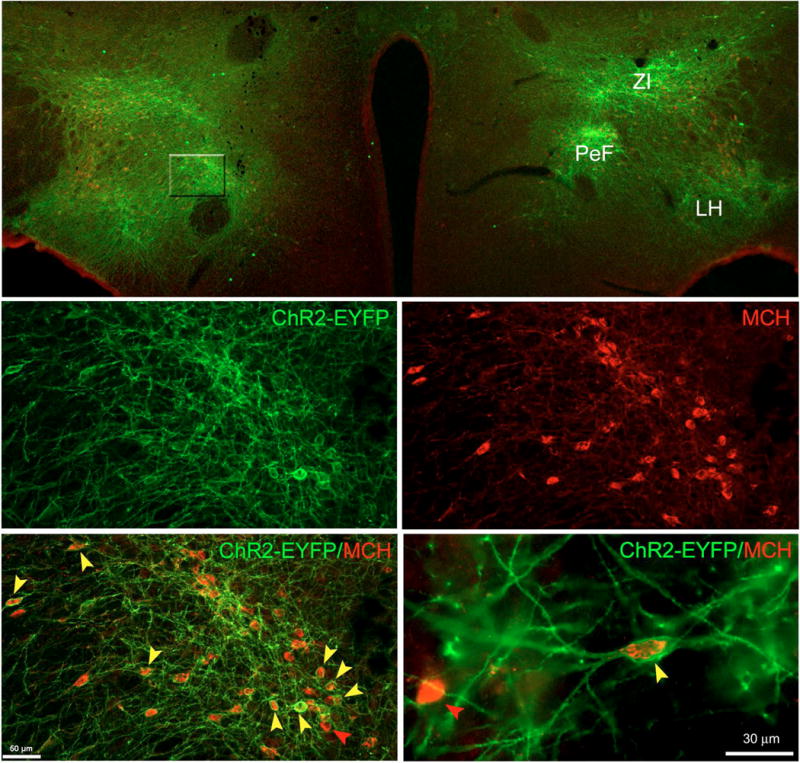
rAAV-MCH-ChR2-EYFP vector successfully transfected MCH neurons. Top panel shows a panoramic view (4×) of the extent of transfection following a bilateral injection of rAAV-MCH-ChR2-EYFP. Confocal laser scanning microscopy indicated a robust expression of the reporter gene EYFP (green) across the lateral hypothalamus (LH), perifornical area (PeF) and the zona incerta (ZI). Middle magnification (20×) views of the PeF area (middle and bottom left panels). ChR2-EYFP signal is abundantly present in many somata but mostly its neuropil (middle left panel). Middle right panel shows that PeF contains many MCH-ir+ neurons. Bottom left panel illustrates the abundance of EYFP and MCH co-labeling. Bottom right panel was taken at 60× and it shows in great detail ChR2-EYFP expression associated to the plasma membrane of the neuron whereas MCH signal is located within the neuron’s cytoplasm. Cell counts were done at 60×. There was a selective expression of EYFP in MCH neurons (97.3± 0.97%), but 52.5 (± 2.0)% of MCH neurons were also EYFP+. Red arrows indicate examples of non-transfected MCH neurons whereas yellow arrows point toward multiple examples of positively transfected MCH neurons.
A confocal microscope (Nikon A1 + confocal microscope; Nikon Corporation, Tokyo, Japan) was used to visualize the MCH and EYFP positive neurons. The distribution of EYFP+ somata was plotted along with the location of the fiber optic tips. Each coronal section was scanned at low magnification (4×), dual channel (Channel 1:EYFP Laser line at 488 nm; Channel 2=Texas Red Laser line at 560 nm) and the acquired images exported as TIFF image files. The TIFF images were overlaid (Adobe Systems Inc.) and resized onto matching rat brain atlas digital plates. Areas showing strong EYFP positive signal in somata and proximal processes were traced and colored. Fiber optic tips indicated on the images by scar tissue were also traced.
Brain sections from rats with extensive transfection and correct fiber optic placements were used to obtain a tally of the MCH neurons expressing EFYP. These sections were examined at high magnification (60×) by a person blinded to the type of treatment given to the rats. Single (MCH+ or EYFP+) and double (MCH+EYFP) labeled neurons were counted in five coronal brain sections separated at least 120 μm apart. Ten bilateral sampling areas per rat (147 × 196 μm) showing high density of EYFP positive somata were tallied. Cells were counted in images while scanning across the vertical plane (Z-axis in 1 μm increments). To assess colocalization between EYFP and MCH, Z-stacks were visualized both in orthogonal view in 2D and as XYZ-planes in 3D rendering. Only cells showing MCH labeling inside the cytoplasm were counted as specifically transfected. The tissue processed for visualization of orexin-immunoreactive neurons was similarly examined.
Statistical analysis
Sigma Stat software (Systat Software Inc., San Jose, CA) was used to statistically compare group means. Two way and one-way repeated measures ANOVA (General Linear Model) compared group means, followed by post-hoc analysis (Holm-Sidak). Independent and paired t-tests were also used as a-priori tests of hypotheses. Probability values equal or less than 0.05 were set for rejection of the null hypothesis.
Results
In vitro optogenetic activation of rat MCH neurons
An in-vitro electrophysiological analysis with whole cell recording showed that rat MCH neurons that were ChR2-EYFP positive were also responsive to light. Similar to the majority of MCH neurons found within the mouse hypothalamus (van den Pol et al., 2004; Zhang & van den Pol, 2012), rat MCH neurons were generally silent with few if any spontaneous action potentials (Fig. 1A). The resting membrane potential of rat MCH neurons was almost identical to that of the mouse MCH neurons (rat=60.6±1.5 mV vs. mouse=59.4 ±1.1 mV n.s.; Fig. 1B). Blue light pulses (1–10 Hz; 10ms duration) evoked substantive inward currents with similar amplitudes and high fidelity responses. However, light pulses at frequencies faster than 20 Hz evoked relatively lower current amplitudes compared to the first pulse of the stimulation (Fig. 1C). In current-clamp configuration, light stimuli between 1–10 Hz generated action potentials with high fidelity. However, light pulses with a frequency faster than 20 Hz only evoked a single action potential following the initial pulse, and only small amplitude depolarizations evoked by the succeeding pulses (Fig. 1D). As we have demonstrated previously in this region of the hypothalamus, this spike frequency adaptation is a unique feature of MCH neurons, not shared by nearby hypocretin cells (van den Pol et al., 2004).
Figure 1.
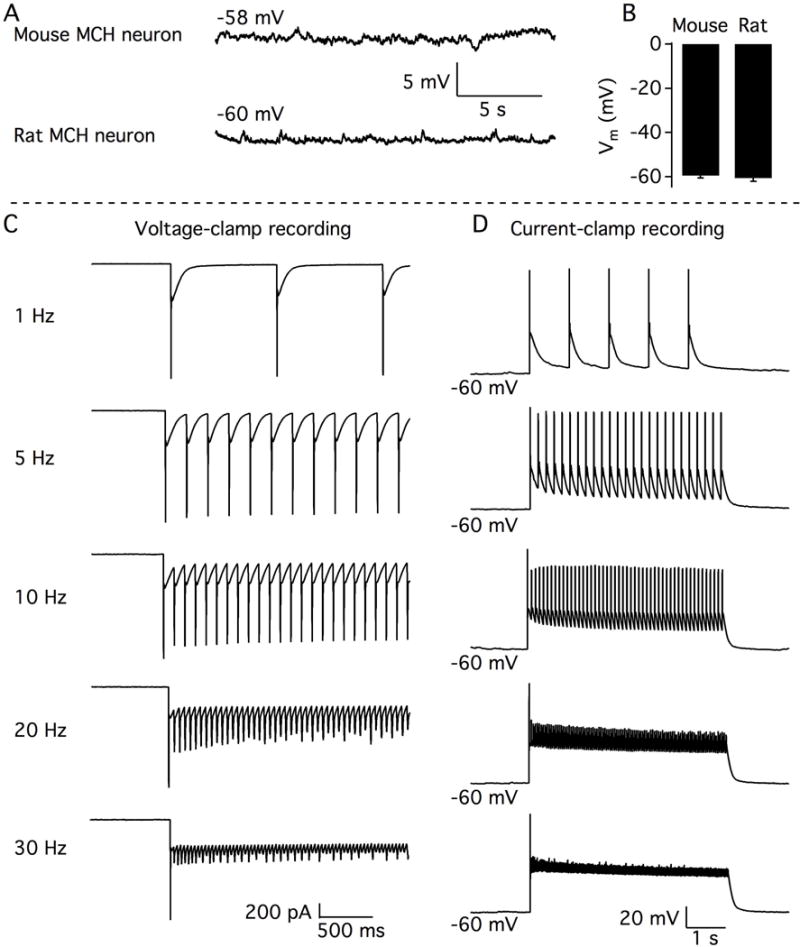
In vitro optogenetic activation of MCH neurons. A.- Representative traces showing membrane potentials recorded from a typical mouse MCH neuron (above) and a typical rat MCH neuron (bottom). Note how MCH neurons in both species are silent. B.- Bar graph showing similar resting membrane potential of MCH neurons from mice and rats. C.- Representative traces from rat MCH neurons showing the inward currents evoked by photostimulation of different frequencies under whole-cell voltage-clamp recording with cells held at −60 mV. D.- Representative traces showing the membrane depolarization and action potentials evoked by photostimulation of different frequencies under whole-cell current-clamp recording.
In vivo studies
Anatomical distribution of ChR2-EYFP+ somata
In rats given rAAV-MCH-ChR2-EYFP the presence of the reporter gene, EYFP, served as proxy for the transfection of the ChR2 gene into MCH neurons. Of the ten rats given rAAV-MCH-ChR2-EYFP, six rats had extensive expression of EYFP. In the other four rats, few if any EYFP neurons were seen, perhaps because the cannula delivering the virus was clogged; these rats were therefore not included for further study. The gross anatomical distribution of the EYFP expression from the six rats with good ChR2 expression is summarized in figure 2. There were numerous EFYP+ somata within the zona incerta, the lateral hypothalamus and the perifornical area (Figure 3). The four WT rats given control vector (rAAV-MCH-EYFP) also had numerous EYFP+ somata. Tally of the MCH+EYFP+ neurons determined that 52.5 (± 2.0)% of MCH neurons were also EYFP+. The MCH promoter expressed the genes in MCH neurons, as shown by the strong and selective expression in which 97.3(± 0.97)% of EYFP+ were also MCH+ (Figure 3 and 4; left panels). In the tissue sections processed for visualization of orexin-ir neurons, none of the orexin+ neurons were also EYFP+ (Figure 4; right panel), which is consistent with our previously published report in mice (Konadhode et al., 2013). The supplementary figure shows the lack of EYFP+ neurons in the off-site (caudate-putamen) control rat. By contrast in the same rat, injection of the rAAV-MCH-ChR2-EYFP into the zona incerta robustly transduced EYFP into many neurons. This further supports the view that the viral gene vector employing the MCH gene promoter shows selective expression in MCH cells.
Figure 2.
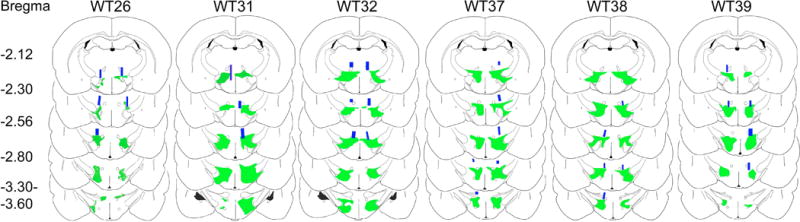
Anatomical distribution maps of ChR2-EYFP+ expression in rats. ChR2-EYFP expression was evident across the dorsolateral tuberal hypothalamic area particularly within the zona incerta, perifornical, and lateral hypothalamus. ChR2-EYFP emission signal was less prominent in the medial aspect of hypothalamus. Overall EYFP emission signal spread roughly 1.4 mm along the anteroposterior axis and it was present in both hemispheres. Just above the EYFP emission signal, the blue rectangles indicate the locations of the optic fiber tips. Optic fiber locations were drawn based on the presence of its tracks. The alphanumeric codes on top represent the identification number of the rat whereas the numbers on the far left represent the anterior-posterior distance from bregma.
Figure 4.
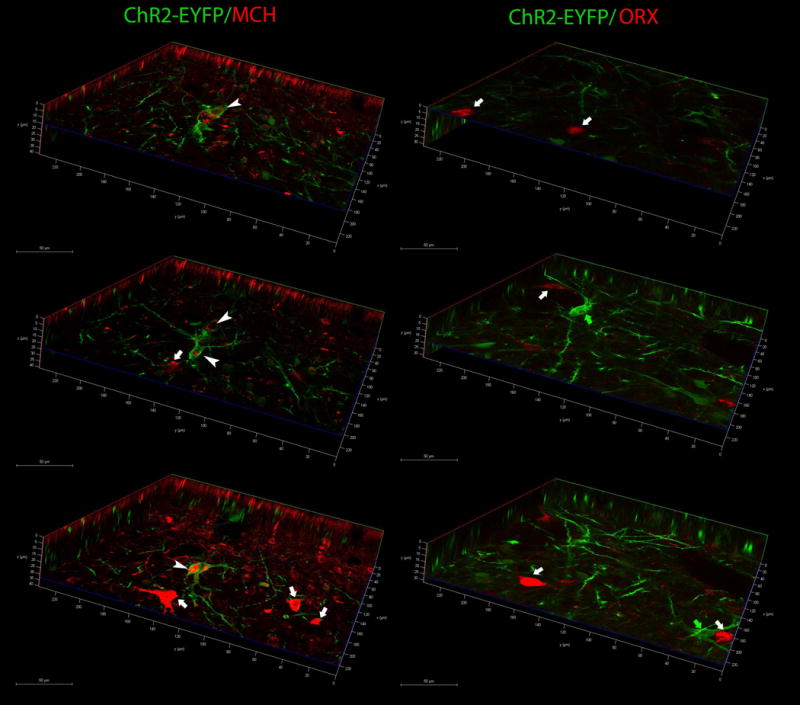
EYFP colocalizes with MCH neurons but not with orexin (ORX) neurons. Confocal microscopy photomicrographs depict renderings of Z-stacks in XYZ planes. Left panel depicts colocalization of ChR2-EYFP in MCH-immunoreactive neurons, and right panel shows colocalization in orexin-ir neurons. Images were taken from sections from the same rat shown in figure 3 (WT38). Representative neurons are identified with arrowheads or arrows. White arrowheads identify double labeled somata (EYFP+MCH), white arrows identify either single MCH-ir (left panels) or ORX-ir (right panels) neurons, and green arrows identify single-labeled EYFP+ neurons. X axis=green line, Y axis=red line, Z=axis=blue line. Scale bars indicate the distance in microns.
Optogenetic activation of rat MCH neurons and sleep states
Figure 5 summarizes the sleep data during the 12h night and day periods. During the night there was a significant difference between the experimental (ChR2) and control rats (no ChR2) in percent waking (F=8.7; df=1,29; p=0.018), NREM (F=6.47; df=1,29; p=0.035) and REM sleep (F=11.03; df=1,29; p=0.011). Within group post-hoc comparisons determined no effect of optogenetic stimulation in the control rats. Moreover, there was no difference between the groups at 0 Hz indicating comparable levels of wake, NREM and REM sleep at night (Holm-Sidak post-hoc test). However, in the rats given ChR2 10 Hz optogenetic stimulation during the 12h night cycle significantly decreased waking (p=0.001), and increased both NREM (p=0.001) and REM sleep (p=0.001) compared to 0 and 5Hz (Fig. 5). 5 Hz only increased REMS whereas 30 Hz did not have an effect (Fig. 5). These results indicate that in rats activation of MCH neurons at night induces both types of sleep, and that 10Hz is more effective compared to 5Hz.
Figure 5.
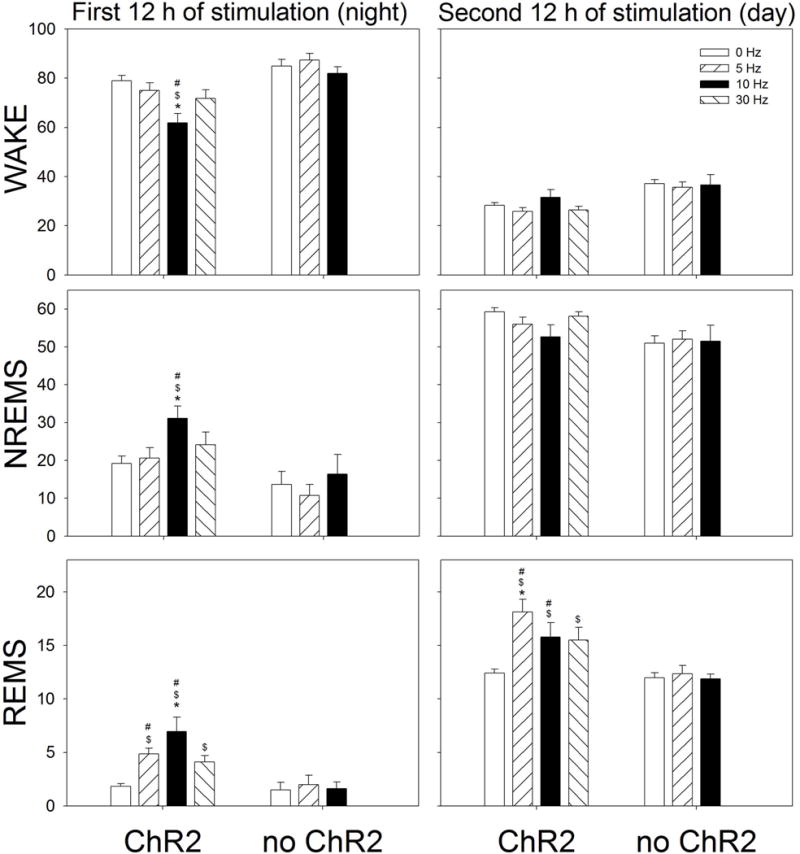
Effect of optogenetic stimulation of MCH neurons on percent (±SEM) of Wake, NREM sleep and REM sleep. The data summarizes the average percent of wake, NREM sleep and REM sleep during the 12 h period (night or day). Optogenetic stimulation started at lights-off and continued for 24 h (1 min on, 4 min off). *= significance versus 5, 10 or 30Hz within the ChR2 group (p=0.01). $= significance versus 0Hz ChR2 (p<0.02). #= significance versus no ChR2 (p=0.05) (Holm-Sidak post-hoc test after 2-RMANOVA).
During the day cycle, there was no significant effect of stimulation on wake or NREM sleep. However, in rats with ChR2, activation of the sleep-active MCH neurons significantly increased REM sleep in all three frequencies compared to 0Hz (p=0.05) (Figure 5). In rats given the control virus (no ChR2) there were no changes in sleep in response to stimulation in waking, NREM or REM sleep (Figure 5). Thus, in rats stimulating MCH neurons during the day increased REM sleep, a finding consistent with data in MCH-Cre mice (Jego et al., 2013; Tsunematsu et al., 2014).
To better understand the time course of the changes in sleep produced by optogenetic stimulation of MCH neurons, the data for 5 and 10Hz stimulation rates were arranged in 3h blocks (Figure 6). A one-way RMANOVA compared means separately for the night and day cycles. At night, 10Hz stimulation immediately increased total sleep time by increasing both NREM (p<0.05) and REM sleep (p<0.05). 5Hz stimulation did not increase NREM but increased REM sleep during the second half of the night cycle (p<0.05). Thus, 10Hz stimulation made the rats sleep more when they should normally be awake. During the day cycle 5Hz stimulation significantly increased REM sleep during all time points compared to 0Hz (p=0.01), while 10Hz increased it during the first 6h of the lights-on cycle compared to 0Hz (p=0.01).
Figure 6.
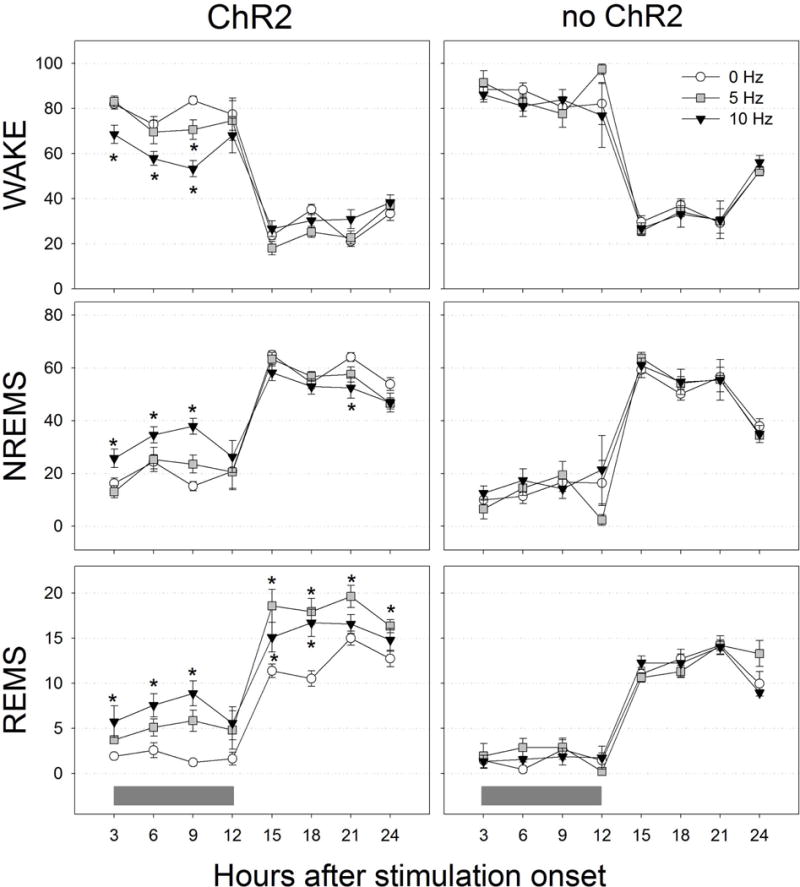
Time course of changes in wake, NREM sleep and REM sleep during 24 h of optogenetic stimulation. Stimulation started at night (lights-off). Grey horizontal bars at the bottom indicate the lights-off period. Data are 3 h percent (±SEM). *=significance versus 0 Hz (p=0.05; Holm-Sidak post-hoc test).
Next we examined the effect of MCH neuronal activation on sleep architecture (Figure 7). Only the effects of 10Hz stimulation in ChR2 rats was analyzed as this was most effective during both the night and day cycles. Data from the control rats was not analyzed as there were no changes in sleep in response to stimulation. Activation of rat MCH neurons significantly decreased the number of long wake bouts (>32 min) during both the night and day cycles and increased the number of short NREM and REMS bouts compared to 0Hz (p=0.05). Thus, 10Hz stimulation decreased the length of waking bouts and increased entry into both NREM and REM sleep.
Figure 7.
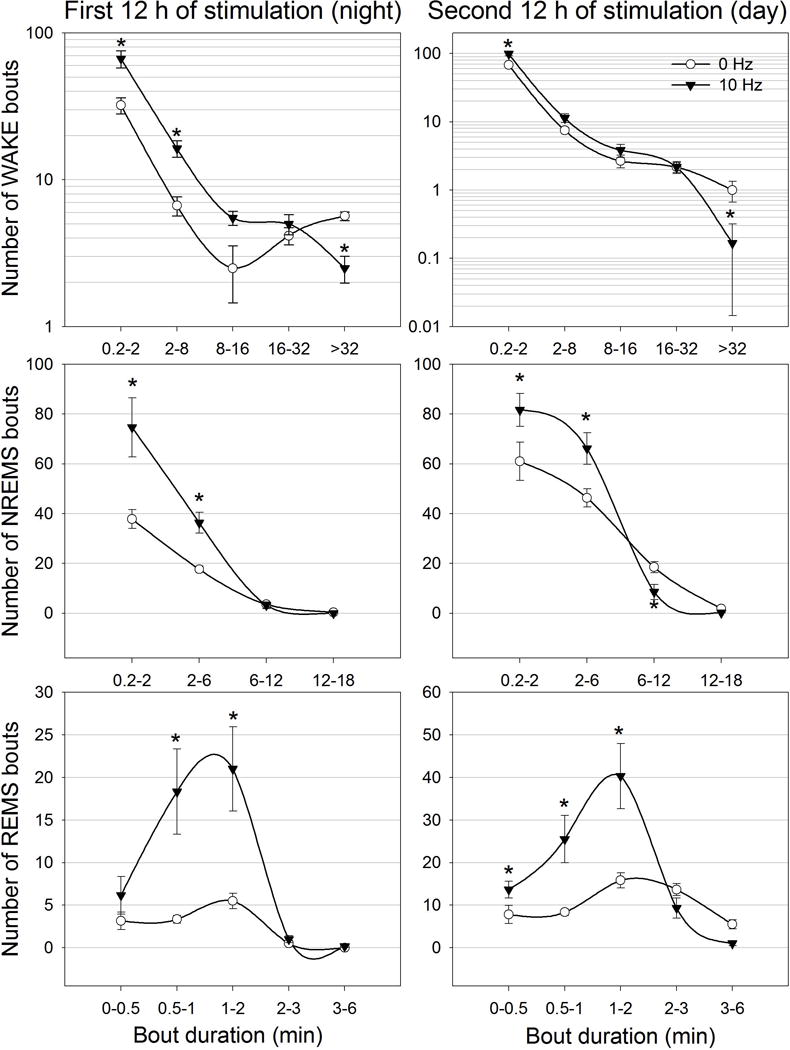
Effects of 24 h of optogenetic activation of MCH neurons on sleep architecture. The first 12 h of stimulation occurred during the lights-off period whereas the second 12 h occurred during the lights-on period. To better visualize differences between treatments the number of waking bouts are expressed as log10 scale. NREMS and REMS bouts numbers are represented as linear scale. *=significance versus 0 Hz at p=0.01.
We also examined the effects of optogenetic activation of MCH neurons on the spectral ECoG power during sleep states. Figure 8 summarizes the changes observed in NREM sleep delta (0.5–4 Hz; top graph) and REM sleep theta power (4–8 Hz; bottom graph) in the rats given ChR2. With respect to delta power, only 10Hz stimulation data were analyzed since only this frequency significantly increased NREM sleep. At 0 Hz NREMS delta power waxed and waned across the 24 h cycle, a profile that is consistent with data in rats (Shiromani et al., 2000). 10Hz stimulation of the MCH neurons increased delta power, and during the daytime, NREMS delta power continued to progressively increase rather than wane. Activation of rat MCH neurons also increased theta power during REM sleep. Stimulation at 5 Hz resulted in higher theta power during the first 12 h of stimulation. At 10 Hz, REM sleep theta power nearly doubled for 18 h. The increase in theta power is also consistent with the increase in REM sleep time. Thus, activation of MCH neurons in rats not only increased both NREM and REMS, but also increased delta and theta power.
Figure 8.
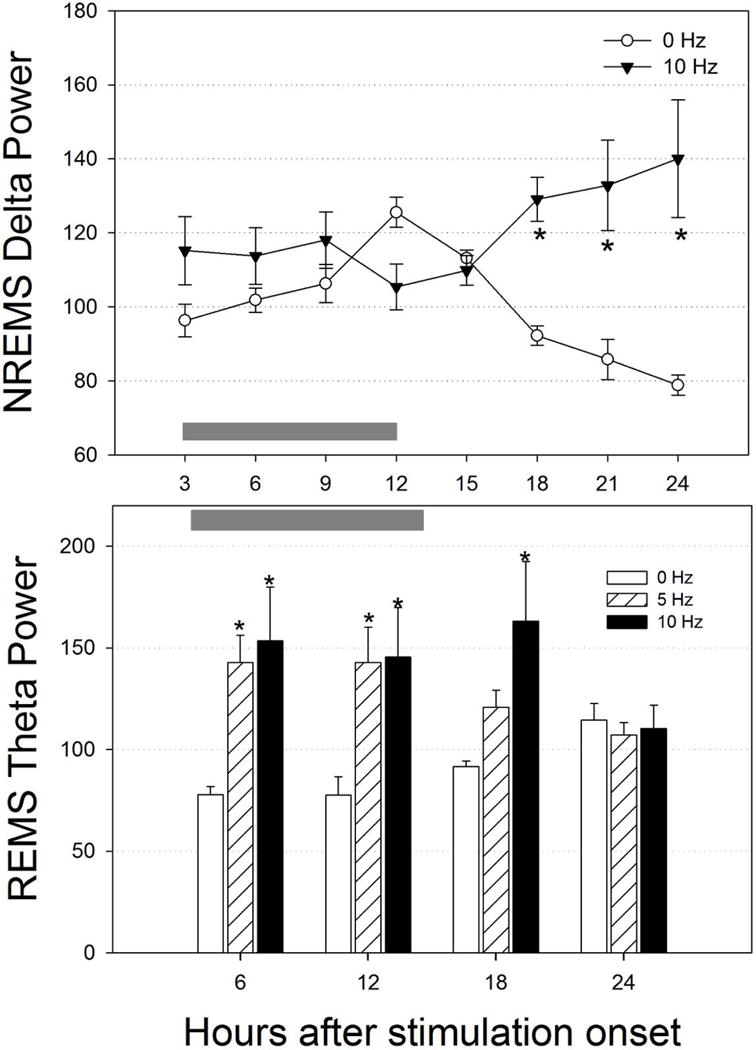
Effect of optogenetic activation of rat MCH neurons on NREMS delta power and REMS theta power. ECoG power was determined only during NREM sleep (delta) or REM sleep (theta). To improve visualization hourly data was pooled in 3 h blocks for delta power and in 6 h for theta power. Gray horizontal bars denote the 12h lights-off, night period. *=significance versus 0 Hz (p=0.01).
Discussion
In mammals a distributed network of neurons is implicated in generating wake, NREM and REM sleep. Because these neurons are intermingled with neurons serving other behaviors, optogenetics is used to selectively activate phenotype specific neurons. Previously (Konadhode et al., 2013), we determined that activation of the sleep-active neurons containing melanin concentrating hormone (MCH) in mice robustly induced sleep. We now demonstrate that in wildtype Long-Evans rats, similar to what is found in mice, optogenetic activation of MCH neurons induces both NREM and REM sleep at night when nocturnal rodents are primarily awake. Our two studies utilized the same viral vector, rAAV-MCH-ChR2(H134R)-EYFP, to insert the light-sensitive ChR2 gene into MCH neurons. In-vitro experiments determined that the MCH neurons in mice and rats were similarly activated by light. Both studies utilized the same experimental paradigm (one minute stimulation followed by 4 minutes of no stimulation, every 5 minutes) to stimulate the MCH neurons over 24h. In both studies, to better gauge the influence of the MCH neurons in inducing sleep, the optogenetic stimulation began at the start of the light-off period, which is when nocturnal rodents awaken in response to circadian signals. In our studies, activation of MCH neurons at night induced sleep by decreasing the length of wake bouts. Delta power, a measure of sleep intensity, was also increased in both rats and mice. Such consistent effects in two species that have both NREM and REM sleep validates the status of MCH neurons inducing sleep and suggests that MCH neurons may serve a common function in driving sleep in mammals.
In the current study in rats, as in our previous study in mice (Konadhode et al., 2013), ChR2-EYFP was selectively colocalized in MCH neurons in the zona incerta, perifornical area and the lateral hypothalamus. In the present study, 97% of EYFP (proxy for ChR2) positive neurons were also MCH immunoreactive, indicating the selective nature of the gene expression. Specificity of the vector for MCH neurons was also confirmed by lack of colocalization between EYFP+ and orexin+, which is consistent with our previous report in mice (Konadhode et al., 2013). We used orexin neurons because these neurons are intermingled with MCH neurons. Further confirmation was established by an experiment showing the absence of transfection among neurons of the caudate putamen which lacks MCH neurons, and by the similarity of the unique electrophysiological characteristics of rat and mouse MCH neurons determined with whole cell recording. Similar rates of transfection of MCH neurons were observed in both species (52.5% in rats versus 53.4% in mice). Thus, in both our studies about half of the MCH neurons contained the light-sensitive ChR2. However, even if all of the MCH neurons contained ChR2, it is possible that light will not reach all of the light-sensitive MCH neurons, a potential limitation of the optogenetic approach. Nevertheless, there was a robust increase in both NREM and REM sleep at night with optogenetic activation of half of the MCH neurons. This indicates that only a subset of MCH neurons needs to be activated to increase sleep, underscoring the impact of MCH neurons in driving sleep. It is not known whether the subset of MCH neurons containing the light-sensitive opsin and activated by light recruits and activates the other MCH neurons.
In the present study in rats, the sleep response was stronger than in our previous study in mice (Konadhode et al., 2013). For instance, in the present study both 5 and 10Hz were effective, whereas in our previous study only 10Hz was effective. This might be because the diameter of the fiber-optic probes in this study was twice as large as those used in our previous study (400μm versus 200μm). We selected the larger probes to reach the MCH neurons that are diffusely scattered along the hypothalamus. Thus, in the present study more MCH neurons were potentially activated by the broader beam of light, producing a stronger effect on sleep.
Our two studies have also found that delta power, a marker of sleep intensity, is increased in response to activation of MCH neurons. An increase in delta power was also observed by another group who also activated the MCH neurons (Tsunematsu et al., 2014). In the present study, delta power and NREM sleep time increased upon stimulation at night. During the day 10Hz stimulation increased delta power but not NREM sleep time. We suggest that during the day NREM sleep time is at ceiling levels and cannot be increased further. However, delta power wanes across the day cycle and activating the MCH neurons prevented the decline.
Two other groups have also examined the effect of optogenetic stimulation of MCH neurons on sleep (Jego et al., 2013; Tsunematsu et al., 2014). They used mice that were transgenic pMCH-cre (Jego et al., 2013) or the ChR2 was activated in MCH neurons via a tetracycline-controlled system (Tsunematsu et al., 2014). We used wildtype mice (Konadhode et al., 2013) or rats (the present study). They found an increase in REM sleep, while we determined that both NREM and REM sleep were increased in response to optogenetic activation of MCH neurons. One possibility for this difference is related to light-induced activation of specific clusters of MCH neurons. The MCH neurons are located in the zona incerta, lateral hypothalamus and perifornical area, with a smaller cluster located ventrally along the dorsal border of the ventral medial hypothalamus (Konadhode et al., 2014). The cluster of MCH neurons in the lateral and perifornical area innervate the pons (Hanriot et al., 2007; Torterolo et al., 2009; 2013) where REM sleep is generated. In the two studies where REM sleep was increased (Jego et al., 2013; Tsunematsu et al., 2014), the MCH neurons in the lateral and perifornical cluster may have shown a higher probability of activation, whereas in our studies we specifically targeted the probes to activate the MCH neurons in the zona incerta. In the present study, it is possible that because of the bigger probe light reached the lateral and perifornical clusters, which then induced REM sleep during the day. Thus, activating specific subsets of MCH neurons may exert a differential effect on NREM versus REM sleep, a perspective meriting further study.
Although activation of MCH neurons promotes sleep, optogenetic inhibition has no effect (Jego et al., 2013; Tsunematsu et al., 2014). Interestingly, selective ablation of approximately 97% of MCH neurons via a cell-specific expression of diphtheria toxin decreases NREM sleep without affecting REM sleep (Tsunematsu et al., 2014). With 30% ablation of MCH neurons there is a decrease in NREM sleep intensity under basal conditions and in response to 4h total sleep deprivation (Varin et al., 2016). Together, the optogenetic and MCH neuron ablation studies underline the potential importance of MCH neurons in both NREM and REM sleep.
Pharmacological studies also indicate that the MCH peptide, promotes both types of sleep. MCHR1 antagonists significantly decrease both NREM sleep and REM sleep (Ahnaou et al., 2008). Activation of the MCHR1 is the likely mechanism for the NREM sleep enhancing effect because MCHR1 null mice show significantly less NREM sleep(Ahnaou et al., 2011). Similar reduction of NREM sleep has been measured in the MCH null mice (Willie et al., 2008). In contrast, when MCH was infused ICV to rats, both types of sleep significantly increased (Verret et al., 2003). Local infusion of MCH into the locus coeruleus only increases REM sleep (Monti et al., 2014) suggesting that MCH neurons regulate NREM versus REM sleep depending on the projection site. In humans, MCH release was highest after sleep onset which corresponds to the light stages of NREM sleep (Blouin et al., 2013). In rats, we also measured higher MCH levels in the cerebrospinal fluid during the sleep phase (Pelluru et al., 2013).
The MCH neurons are not active in waking, but increase their activity in NREM sleep (1–3Hz; average=0.5Hz), with peak activity in REM sleep (1–22Hz; average=1.1Hz) (Hassani et al., 2009). Thus, activating MCH neurons should promote sleep, which it does in both mice and rats. We and others have stimulated the MCH neurons at 5, 10, 20 and 30 Hz, rates that are higher compared to what may be found in natural NREM and REM sleep. However, as seen in figure 1, MCH neurons can be driven at 1–10Hz, but at 20 and 30Hz there is a decrement in amplitude and triggering of the action potential. We found that 10Hz induced both NREM and REM sleep, whereas 5, 10 and 30Hz induced only REM sleep. These stimulation frequencies are higher than normally recorded in MCH cells, but were necessary to offset the fact that only half the MCH are being stimulated, based on our histochemical corroboration. It seems unlikely that stimulating at 1Hz, the rate that is consistent with NREM and REM sleep, will induce more sleep, especially during the wake-active period because the faster stimulation rates may force the MCH neurons to release more of their contents quickly, thereby hastening the transition to sleep. The released transmitters are also likely to accumulate producing a cumulative effect in driving sleep. Indeed, in the present study, delta power, a very sensitive marker of accumulating endogenous somnogens, increased in response to the chronic stimulation.
Optogenetics has been transformative in identifying the impact of specific neurons in behavior. Should the rate of optogenetic stimulation mimic the natural pattern of activity of the neurons? Although optogenetic mimicking of normal neuronal behavior may be ideal, for some behaviors, such as sleep, it may not be necessary to mirror the fine pattern of activity to induce the desired behavior. The cadence of the MCH neurons may be off in wake and on in sleep (loosely defined as binary). It may be sufficient to induce sleep to maintain this on-off cadence. In other words, turn-on the MCH neurons periodically to get a waking brain to fall asleep. Stimulation at 5Hz induced sleep, albeit weakly compared to 10Hz. It is possible that in rats stimulation at rates that may be closer to what occurs naturally may also induce sleep.
How might MCH neurons induce sleep? During waking the activity of the MCH neurons is inhibited by the adjacent arousal orexin neurons (Apergis-Schoute et al., 2015). The MCH neurons are able to inhibit the combined activity of the arousal neurons and generate NREMS and REMS because MCH peptide inhibits the orexin neurons (Rao et al., 2008). However, GABA may also be colocalized in MCH neurons and similar to MCH, it may inhibit the arousal neurons (Elias et al., 2001; Del Cid-Pellitero & Jones, 2012); some MCH cells may also contain other fast transmitters (Chee et al, 2015). Another mechanism by which MCH stimulation may increase specifically NREM sleep is through indirect disinhibition of the reticular thalamic nucleus (RT). Recently it was found that optogenetic inhibition of hypothalamic GABA neurons projecting to the RT increase NREM sleep and EEG delta power ( Gutierrez-Herrera et al., 2016). If MCH neurons contact these hypothalamic GABA cells, the optogenetic activation of MCH could indirectly disinhibit the RT resulting in higher NREM sleep and EEG delta power. MCH neurons project throughout the brain, innervating neuronal populations implicated in waking and REMS (Cvetkovic et al., 2003; Cvetkovic et al., 2004; Hanriot et al., 2007; Sita et al., 2007; Croizier et al., 2010; Hong et al., 2011; Lima et al., 2013; Torterolo et al., 2013; Yoon & Lee, 2013). It is not known whether a single MCH neuron projects to multiple ascending and descending targets, but the MCH neurons located in the lateral cluster project primarily to the pons, where REMS generator neurons are located (Cvetkovic et al., 2004). Optogenetic mediated activation of MCH neurons may inhibit the local orexin neurons through release of inhibitory MCH, weakening the orexin drive onto downstream arousal neurons and attenuating the waking bout.
It remains to be determined which projection(s) of the stimulated MCH neurons is responsible for the somnogenic effect. MCH neurons project to multiples sites, many of those include regions where the arousal neurons are located. Stimulation of specific projection(s) will be required to address this question. Nevertheless, the converging evidence from optogenetic, selective ablation of MCH neurons, and pharmacology studies underscores the inclusion of the MCH neurons in network models of sleep-wake regulation. That sleep was induced during the normal waking cycle suggests a potential role of MCH neurons in sleep disorders, such as insomnia, and also support the perspective that drugs targeting the MCH system may enhance sleep in certain sleep disorders.
Supplementary Material
Supplementary Figure. Confocal scanning microscopy imaging of rat brain sections 18 days after microinjection of rAAV-ChR2-EYFP into the caudate-putamen (CPu; left panels) or into the zona incerta (ZI; right panels). At the CPu where there are no MCH neurons, there is no EYFP emission signal among neurons (top left panel). Non-neuronal auto fluorescence was observed under both 488nm and 552nm wavelength light but only in the area of cells damaged by the injection cannula. These autofluorescent cells may be traumatized or dying from direct injury or being scavenger cells infiltrating the damaged tissue. Activated macrophages are known to show strong autofluorescence. In contrast to the CPu, in the ZI numerous green fluorescent neurons along with its fibers are evident upon injection of the rAAV-ChR2-EYFP vector. These neurons were visible only when excited at 488nm wavelength light (top right panel) but not when excited at 552nm (middle right panel). Because EYFP emits light when excited at 488 nm wavelength, it confirms the specificity of the rAAV-ChR2-EYFP vector to transduce MCH neurons. In the ZI non-neuronal green and red autofluorescent cells with no processes are also evident only along the injection cannula track (top, middle and bottom right panels).
Acknowledgments
We thank Wengxue Wang for assistance with the study and Dr. Amanda LaRue for use of the confocal microscope. This study was supported by Medical Research Service of the Department of Veterans Affairs (101 BX000798) and NIH grants 1K01AG041520 (to ML), NS052287, NS084477, NS079940
Abbreviations
- AP
Anteroposterior
- CPu
Caudate-Putamen
- ChR2
Channelrhodopsin2
- ECoG
Electrocorticography
- EMG
Electromyography
- EYFP
Enhanced Yellow Fluorescent Protein
- FFT
Fast Fourier Transformation
- LC
Locus Coeruleus
- MCH
Melanin-Concentrating Hormone
- NREM
no Rapid Eye Movement
- rAAV
recombinant Adeno-Associated Virus
- REM
Rapid Eye Movement
- ZI
Zona incerta
Footnotes
Conflict of Interests: No conflicts of interest, financial or otherwise are declared by the author(s).
References
- Adamantidis AR, Zhang F, Aravanis AM, Deisseroth K, de Lecea L. Neural substrates of awakening probed with optogenetic control of hypocretin neurons. Nature. 2007;450:420–424. doi: 10.1038/nature06310. [DOI] [PMC free article] [PubMed] [Google Scholar]
- Ahnaou A, Dautzenberg FM, Huysmans H, Steckler T, Drinkenburg WH. Contribution of melanin-concentrating hormone (MCH1) receptor to thermoregulation and sleep stabilization: evidence from MCH1 (−/−) mice. Behavioural brain research. 2011;218:42–50. doi: 10.1016/j.bbr.2010.11.019. [DOI] [PubMed] [Google Scholar]
- Ahnaou A, Drinkenburg WH, Bouwknecht JA, Alcazar J, Steckler T, Dautzenberg FM. Blocking melanin-concentrating hormone MCH1 receptor affects rat sleep-wake architecture. European journal of pharmacology. 2008;579:177–188. doi: 10.1016/j.ejphar.2007.10.017. [DOI] [PubMed] [Google Scholar]
- Apergis-Schoute J, Iordanidou P, Faure C, Jego S, Schone C, Aitta-Aho T, Adamantidis A, Burdakov D. Optogenetic evidence for inhibitory signaling from orexin to MCH neurons via local microcircuits. The Journal of neuroscience: the official journal of the Society for Neuroscience. 2015;35:5435–5441. doi: 10.1523/JNEUROSCI.5269-14.2015. [DOI] [PMC free article] [PubMed] [Google Scholar]
- Aston-Jones G, Bloom FE. Nonrepinephrine-containing locus coeruleus neurons in behaving rats exhibit pronounced responses to non-noxious environmental stimuli. J Neurosci. 1981;1:887–900. doi: 10.1523/JNEUROSCI.01-08-00887.1981. [DOI] [PMC free article] [PubMed] [Google Scholar]
- Basheer R, Sherin JE, Saper CB, Morgan JI, McCarley RW, Shiromani PJ. Effects of sleep on wake-induced c-fos expression. The Journal of neuroscience: the official journal of the Society for Neuroscience. 1997;17:9746–9750. doi: 10.1523/JNEUROSCI.17-24-09746.1997. [DOI] [PMC free article] [PubMed] [Google Scholar]
- Bittencourt JC, Presse F, Arias C, Peto C, Vaughan J, Nahon JL, Vale W, Sawchenko PE. The melanin-concentrating hormone system of the rat brain: an immuno- and hybridization histochemical characterization. J Comp Neurol. 1992;319:218–245. doi: 10.1002/cne.903190204. [DOI] [PubMed] [Google Scholar]
- Blouin AM, Fried I, Wilson CL, Staba RJ, Behnke EJ, Lam HA, Maidment NT, Karlsson KAE, Lapierre JL, Siegel JM. Human hypocretin and melanin-concentrating hormone levels are linked to emotion and social interaction. Nature communications. 2013;4:1547. doi: 10.1038/ncomms2461. [DOI] [PMC free article] [PubMed] [Google Scholar]
- Carter ME, Yizhar O, Chikahisa S, Nguyen H, Adamantidis A, Nishino S, Deisseroth K, de Lecea L. Tuning arousal with optogenetic modulation of locus coeruleus neurons. Nature neuroscience. 2010;13:1526–1533. doi: 10.1038/nn.2682. [DOI] [PMC free article] [PubMed] [Google Scholar]
- Chee MJ, Arrigoni E, Maratos-Flier E. Melanin-concentrating hormone neurons release glutamate for feedforward inhibition of the lateral septum. J Neurosci. 2015;35:3644–5. doi: 10.1523/JNEUROSCI.4187-14.2015. [DOI] [PMC free article] [PubMed] [Google Scholar]
- Chu N, Bloom FE. Norepinephrine-containing neurons: changes in spontaneous discharge patterns during sleeping and waking. Science. 1973;179:908–910. doi: 10.1126/science.179.4076.908. [DOI] [PubMed] [Google Scholar]
- Croizier S, Franchi-Bernard G, Colard C, Poncet F, La Roche A, Risold PY. A comparative analysis shows morphofunctional differences between the rat and mouse melanin-concentrating hormone systems. PloS one. 2010;5:e15471. doi: 10.1371/journal.pone.0015471. [DOI] [PMC free article] [PubMed] [Google Scholar]
- Cvetkovic V, Brischoux F, Griffond B, Bernard G, Jacquemard C, Fellmann D, Risold PY. Evidence of melanin-concentrating hormone-containing neurons supplying both cortical and neuroendocrine projections. Neuroscience. 2003;116:31–35. doi: 10.1016/s0306-4522(02)00557-2. [DOI] [PubMed] [Google Scholar]
- Cvetkovic V, Brischoux F, Jacquemard C, Fellmann D, Griffond B, Risold PY. Characterization of subpopulations of neurons producing melanin-concentrating hormone in the rat ventral diencephalon. Journal of neurochemistry. 2004;91:911–919. doi: 10.1111/j.1471-4159.2004.02776.x. [DOI] [PubMed] [Google Scholar]
- Del Cid-Pellitero E, Jones BE. Immunohistochemical evidence for synaptic release of GABA from melanin-concentrating hormone containing varicosities in the locus coeruleus. Neuroscience. 2012;223:269–276. doi: 10.1016/j.neuroscience.2012.07.072. [DOI] [PubMed] [Google Scholar]
- Elias CF, Lee CE, Kelly JF, Ahima RS, Kuhar M, Saper CB, Elmquist JK. Characterization of CART neurons in the rat and human hypothalamus. The Journal of comparative neurology. 2001;432:1–19. doi: 10.1002/cne.1085. [DOI] [PubMed] [Google Scholar]
- Gutierrez-Herrera C, Carus-Cadavieco M, Jego S, Ponomarenko A, Korotkova T, Adamantidis A. Hypothalamic feedforward inhibition of thalamocortical network controls arousal and consciousness. Nat neurosc. 19:290–301. doi: 10.1038/nn.4209. [DOI] [PMC free article] [PubMed] [Google Scholar]
- Hanriot L, Camargo N, Courau AC, Leger L, Luppi PH, Peyron C. Characterization of the melanin-concentrating hormone neurons activated during paradoxical sleep hypersomnia in rats. The Journal of comparative neurology. 2007;505:147–157. doi: 10.1002/cne.21482. [DOI] [PubMed] [Google Scholar]
- Hasegawa E, Yanagisawa M, Sakurai T, Mieda M. Orexin neurons suppress narcolepsy via 2 distinct efferent pathways. The Journal of clinical investigation. 2014;124:604–616. doi: 10.1172/JCI71017. [DOI] [PMC free article] [PubMed] [Google Scholar]
- Hassani OK, Lee MG, Jones BE. Melanin-concentrating hormone neurons discharge in a reciprocal manner to orexin neurons across the sleep-wake cycle. Proceedings of the National Academy of Sciences of the United States of America. 2009;106:2418–2422. doi: 10.1073/pnas.0811400106. [DOI] [PMC free article] [PubMed] [Google Scholar]
- Hong EY, Yoon YS, Lee HS. Differential distribution of melanin-concentrating hormone (MCH)- and hypocretin (Hcrt)-immunoreactive neurons projecting to the mesopontine cholinergic complex in the rat. Brain research. 2011;1424:20–31. doi: 10.1016/j.brainres.2011.09.051. [DOI] [PubMed] [Google Scholar]
- Jego S, Glasgow SD, Herrera CG, Ekstrand M, Reed SJ, Boyce R, Friedman J, Burdakov D, Adamantidis AR. Optogenetic identification of a rapid eye movement sleep modulatory circuit in the hypothalamus. Nature neuroscience. 2013 doi: 10.1038/nn.3522. [DOI] [PMC free article] [PubMed] [Google Scholar]
- Jouvet M. Research on the neural structures and responsible mechanisms in different phases of physiological sleep. Archives italiennes de biologie. 1962;100:125–206. [PubMed] [Google Scholar]
- Konadhode RR, Pelluru D, Blanco-Centurion C, Zayachkivsky A, Liu M, Uhde T, Glen WB, Jr, van den Pol AN, Mulholland PJ, Shiromani PJ. Optogenetic stimulation of MCH neurons increases sleep. The Journal of neuroscience: the official journal of the Society for Neuroscience. 2013;33:10257–10263. doi: 10.1523/JNEUROSCI.1225-13.2013. [DOI] [PMC free article] [PubMed] [Google Scholar]
- Konadhode RR, Pelluru D, Shiromani PJ. Neurons containing orexin or melanin concentrating hormone reciprocally regulate wake and sleep. Front Syst Neurosci. 2014;8:244. doi: 10.3389/fnsys.2014.00244. [DOI] [PMC free article] [PubMed] [Google Scholar]
- Lima FF, Sita LV, Oliveira AR, Costa HC, da Silva JM, Mortara RA, Haemmerle CA, Xavier GF, Canteras NS, Bittencourt JC. Hypothalamic melanin-concentrating hormone projections to the septo-hippocampal complex in the rat. Journal of chemical neuroanatomy. 2013;47:1–14. doi: 10.1016/j.jchemneu.2012.10.003. [DOI] [PubMed] [Google Scholar]
- Liu M, Blanco-Centurion C, Konadhode R, Begum S, Pelluru D, Gerashchenko D, Sakurai T, Yanagisawa M, van den Pol AN, Shiromani PJ. Orexin gene transfer into zona incerta neurons suppresses muscle paralysis in narcoleptic mice. The Journal of neuroscience: the official journal of the Society for Neuroscience. 2011;31:6028–6040. doi: 10.1523/JNEUROSCI.6069-10.2011. [DOI] [PMC free article] [PubMed] [Google Scholar]
- McCarley RW, Hobson JA. Single neuron activity in cat gigantocellular tegmental field: selectivity of discharge in desynchronized sleep. Science. 1971;174:1250–1252. doi: 10.1126/science.174.4015.1250. [DOI] [PubMed] [Google Scholar]
- McGinty DJ, Harper RM. Dorsal raphe neurons: depression of firing during sleep in cats. Brain Res. 1976;101:569–575. doi: 10.1016/0006-8993(76)90480-7. [DOI] [PubMed] [Google Scholar]
- Mileykovskiy BY, Kiyashchenko LI, Siegel JM. Behavioral correlates of activity in identified hypocretin/orexin neurons. Neuron. 2005;46:787–798. doi: 10.1016/j.neuron.2005.04.035. [DOI] [PMC free article] [PubMed] [Google Scholar]
- Monti JM, Lagos P, Jantos H, Torterolo P. Increased REM sleep after intra-locus coeruleus nucleus microinjection of melanin-concentrating hormone (MCH) in the rat. Progress in neuro-psychopharmacology & biological psychiatry. 2014;56C:185–188. doi: 10.1016/j.pnpbp.2014.09.003. [DOI] [PubMed] [Google Scholar]
- Pelluru D, Konadhode R, Shiromani PJ. MCH neurons are the primary sleep-promoting group. Sleep. 2013;36:1779–1781. doi: 10.5665/sleep.3196. [DOI] [PMC free article] [PubMed] [Google Scholar]
- Rao Y, Lu M, Ge F, Marsh DJ, Qian S, Wang AH, Picciotto MR, Gao XB. Regulation of synaptic efficacy in hypocretin/orexin-containing neurons by melanin concentrating hormone in the lateral hypothalamus. The Journal of neuroscience: the official journal of the Society for Neuroscience. 2008;28:9101–9110. doi: 10.1523/JNEUROSCI.1766-08.2008. [DOI] [PMC free article] [PubMed] [Google Scholar]
- Saper CB, Fuller PM, Pedersen NP, Lu J, Scammell TE. Sleep state switching. Neuron. 2010;68:1023–1042. doi: 10.1016/j.neuron.2010.11.032. [DOI] [PMC free article] [PubMed] [Google Scholar]
- Sasaki K, Suzuki M, Mieda M, Tsujino N, Roth B, Sakurai T. Pharmacogenetic modulation of orexin neurons alters sleep/wakefulness states in mice. PloS one. 2011;6:e20360. doi: 10.1371/journal.pone.0020360. [DOI] [PMC free article] [PubMed] [Google Scholar]
- Sherin JE, Shiromani PJ, McCarley RW, Saper CB. Activation of ventrolateral preoptic neurons during sleep. Science. 1996;271:216–219. doi: 10.1126/science.271.5246.216. [DOI] [PubMed] [Google Scholar]
- Shiromani P, Blanco-Centurion C. Pontine Areas Inhibiting REM sleep. In: Mallick BN, Pandi-Perumal RS, McCarley RW, Morrison AR, editors. REM sleep: Regulation and function. Cambridge University Press; United Kingdom: 2011. pp. 280–284. [Google Scholar]
- Shiromani PJ, Lu J, Wagner D, Thakkar J, Greco MA, Basheer R, Thakkar M. Compensatory sleep response to 12 h wakefulness in young and old rats. American journal of physiology. Regulatory, integrative and comparative physiology. 2000;278:R125–133. doi: 10.1152/ajpregu.2000.278.1.R125. [DOI] [PubMed] [Google Scholar]
- Siegel JM, McGinty DJ. Pontine reticular formation neurons: relationship of discharge to motor activity. Science. 1977;196:678–680. doi: 10.1126/science.193185. [DOI] [PMC free article] [PubMed] [Google Scholar]
- Sita LV, Elias CF, Bittencourt JC. Connectivity pattern suggests that incertohypothalamic area belongs to the medial hypothalamic system. Neuroscience. 2007;148:949–969. doi: 10.1016/j.neuroscience.2007.07.010. [DOI] [PubMed] [Google Scholar]
- Steininger TL, Kilduff TS, Behan M, Benca RM, Landry CF. Comparison of hypocretin/orexin and melanin-concentrating hormone neurons and axonal projections in the embryonic and postnatal rat brain. Journal of chemical neuroanatomy. 2004;27:165–181. doi: 10.1016/j.jchemneu.2004.02.007. [DOI] [PubMed] [Google Scholar]
- Szymusiak R, McGinty D. Sleep-related neuronal discharge in the basal forebrain of cats. Brain Res. 1986;370:82–92. doi: 10.1016/0006-8993(86)91107-8. [DOI] [PubMed] [Google Scholar]
- Torterolo P, Sampogna S, Chase MH. MCHergic projections to the nucleus pontis oralis participate in the control of active (REM) sleep. Brain research. 2009;1268:76–87. doi: 10.1016/j.brainres.2009.02.055. [DOI] [PubMed] [Google Scholar]
- Torterolo P, Sampogna S, Chase MH. Hypocretinergic and non-hypocretinergic projections from the hypothalamus to the REM sleep executive area of the pons. Brain research. 2013;1491:68–77. doi: 10.1016/j.brainres.2012.10.050. [DOI] [PMC free article] [PubMed] [Google Scholar]
- Tsunematsu T, Kilduff TS, Boyden ES, Takahashi S, Tominaga M, Yamanaka A. Acute optogenetic silencing of orexin/hypocretin neurons induces slow-wave sleep in mice. The Journal of neuroscience: the official journal of the Society for Neuroscience. 2011;31:10529–10539. doi: 10.1523/JNEUROSCI.0784-11.2011. [DOI] [PMC free article] [PubMed] [Google Scholar]
- Tsunematsu T, Ueno T, Tabuchi S, Inutsuka A, Tanaka KF, Hasuwa H, Kilduff TS, Terao A, Yamanaka A. Optogenetic Manipulation of Activity and Temporally Controlled Cell-Specific Ablation Reveal a Role for MCH Neurons in Sleep/Wake Regulation. The Journal of neuroscience: the official journal of the Society for Neuroscience. 2014;34:6896–6909. doi: 10.1523/JNEUROSCI.5344-13.2014. [DOI] [PMC free article] [PubMed] [Google Scholar]
- van den Pol AN, Acuna-Goycolea C, Clark KR, Ghosh PK. Physiological properties of hypothalamic MCH neurons identified with selective expression of reporter gene after recombinant virus infection. Neuron. 2004;42:635–652. doi: 10.1016/s0896-6273(04)00251-x. [DOI] [PubMed] [Google Scholar]
- Varin C, Arthaud S, Salvert D, Gay N, Libourel PA, Luppi PH, Leger L, Fort P. Sleep architecture and homeostasis in mice with partial ablation of melanin-concentrating hormone neurons. Behavioural brain research. 2016;298:100–110. doi: 10.1016/j.bbr.2015.10.051. [DOI] [PubMed] [Google Scholar]
- Verret L, Goutagny R, Fort P, Cagnon L, Salvert D, Leger L, Boissard R, Salin P, Peyron C, Luppi PH. A role of melanin-concentrating hormone producing neurons in the central regulation of paradoxical sleep. BMC neuroscience. 2003;4:19. doi: 10.1186/1471-2202-4-19. [DOI] [PMC free article] [PubMed] [Google Scholar]
- Willie JT, Sinton CM, Maratos-Flier E, Yanagisawa M. Abnormal response of melanin-concentrating hormone deficient mice to fasting: hyperactivity and rapid eye movement sleep suppression. Neuroscience. 2008;156:819–829. doi: 10.1016/j.neuroscience.2008.08.048. [DOI] [PMC free article] [PubMed] [Google Scholar]
- Yoon YS, Lee HS. Projections from melanin-concentrating hormone (MCH) neurons to the dorsal raphe or the nuclear core of the locus coeruleus in the rat. Brain research. 2013;1490:72–82. doi: 10.1016/j.brainres.2012.08.022. [DOI] [PubMed] [Google Scholar]
- Zhang X, van den Pol AN. Thyrotropin-releasing hormone (TRH) inhibits melanin-concentrating hormone neurons: implications for TRH-mediated anorexic and arousal actions. The Journal of neuroscience: the official journal of the Society for Neuroscience. 2012;32:3032–3043. doi: 10.1523/JNEUROSCI.5966-11.2012. [DOI] [PMC free article] [PubMed] [Google Scholar]
Associated Data
This section collects any data citations, data availability statements, or supplementary materials included in this article.
Supplementary Materials
Supplementary Figure. Confocal scanning microscopy imaging of rat brain sections 18 days after microinjection of rAAV-ChR2-EYFP into the caudate-putamen (CPu; left panels) or into the zona incerta (ZI; right panels). At the CPu where there are no MCH neurons, there is no EYFP emission signal among neurons (top left panel). Non-neuronal auto fluorescence was observed under both 488nm and 552nm wavelength light but only in the area of cells damaged by the injection cannula. These autofluorescent cells may be traumatized or dying from direct injury or being scavenger cells infiltrating the damaged tissue. Activated macrophages are known to show strong autofluorescence. In contrast to the CPu, in the ZI numerous green fluorescent neurons along with its fibers are evident upon injection of the rAAV-ChR2-EYFP vector. These neurons were visible only when excited at 488nm wavelength light (top right panel) but not when excited at 552nm (middle right panel). Because EYFP emits light when excited at 488 nm wavelength, it confirms the specificity of the rAAV-ChR2-EYFP vector to transduce MCH neurons. In the ZI non-neuronal green and red autofluorescent cells with no processes are also evident only along the injection cannula track (top, middle and bottom right panels).