Abstract
In CKD, tubular cells may be involved in the induction of interstitial fibrosis, which in turn, leads to loss of renal function. However, the molecular mechanisms that link tubular cells to the interstitial compartment are not clear. Activation of the Stat3 transcription factor has been reported in tubular cells after renal damage, and Stat3 has been implicated in CKD progression. Here, we combined an experimental model of nephron reduction in mice from different genetic backgrounds and genetically modified animals with in silico and in vitro experiments to determine whether the selective activation of Stat3 in tubular cells is involved in the development of interstitial fibrosis. Nephron reduction caused Stat3 phosphorylation in tubular cells of lesion-prone mice but not in resistant mice. Furthermore, specific deletion of Stat3 in tubular cells significantly reduced the extent of interstitial fibrosis, which correlated with reduced fibroblast proliferation and matrix synthesis, after nephron reduction. Mechanistically, in vitro tubular Stat3 activation triggered the expression of a specific subset of paracrine profibrotic factors, including Lcn2, Pdgfb, and Timp1. Together, our results provide a molecular link between tubular and interstitial cells during CKD progression and identify Stat3 as a central regulator of this link and a promising therapeutic target.
Keywords: chronic kidney disease, Cell Signaling, Pathophysiology of Renal Disease and Progression, renal tubular epithelial cells, renal fibrosis, transcriptional profiling
Chronic reduction of renal function, the common denominator of CKD, represents a worldwide health concern. Grossly, 10% of the adult population is estimated to suffer from CKD.1 These patients display an increased risk of death and cardiovascular morbidity that is proportional to the decline of renal function.2,3 Moreover, because of its progressive nature, CKD may lead to ESRD, which requires RRT, substantially altering life quality and expectancy.
Clinical studies have shown that the decline of renal function correlates more closely with the severity of interstitial fibrosis than with glomerular damage.4–6 Recent finding indicate that the activation of renal fibroblasts by paracrine factors plays a critical role in the development of renal fibrosis.7 It is known that the overwork imposed by adaptation leads to mechanical and metabolic stresses of tubular cells, which in turn, start to synthesize soluble mediators of CKD progression. Similarly, leakage of albumin from the damaged glomerular barrier also leads to the damage of tubular cells with the subsequent production of profibrotic mediators. Thus, it is tempting to speculate that, by delivering fibrogenic paracrine cues to interstitial fibroblasts, tubular cell activation is a crucial step of CKD progression.
Signal transducers and activators of transcription (Stats) are versatile transcription factors that mediate the intracellular signaling of various molecular pathways.8 Stat activation begins by their recruitment to membrane receptors, where they are phosphorylated. This phosphorylation allows both dimerization and nuclear accumulation of the activated Stat, which binds to cognate elements on promoters of responsive genes.9 Among the seven known Stat genes, Stat3 displays unique features. It has the largest spectrum of potential activators, including various cytokines, hormones, and growth factors.10 Contrary to the other members, Stat3 is the only one with inactivation that leads to embryonic lethality in mice.11 Another peculiar characteristic of Stat3 is its ability to regulate gene networks that are highly variable from one cell type to another one.12–16 In addition, Stat3 has been described to have nontranscriptional roles in regulating cell migration17 and mitochondrial electron transport chain.18,19
Recent studies have implicated Stat3 in the progression of CKD. Indeed, in several human and experimental nephropathies, Stat3 activation has been shown in different compartments of the damaged kidney, including tubular cells.20–27 Interestingly, both Stat3 haploinsufficiency and Stat3 pharmacologic inhibition have been shown to decrease lesion progression in HIV-associated nephropathy,25 diabetes,23 or ureteral obstruction.28 Although these studies were conducted in specific experimental models, they point to Stat3 as an important mediator of CKD progression. However, the molecular mechanisms involved in the deleterious effect of Stat3 remain to be elucidated. Remarkably, a few studies have shown that Stat3 is mechanistically involved in the communication between epithelial cells and fibroblasts.29–31 Taking all of these data together, we hypothesized that Stat3 orchestrates the communication between tubular and interstitial cells, leading to the development of interstitial fibrosis.
Results
Tubular Stat3 Activation Precedes Renal Lesion Development after Nephron Reduction
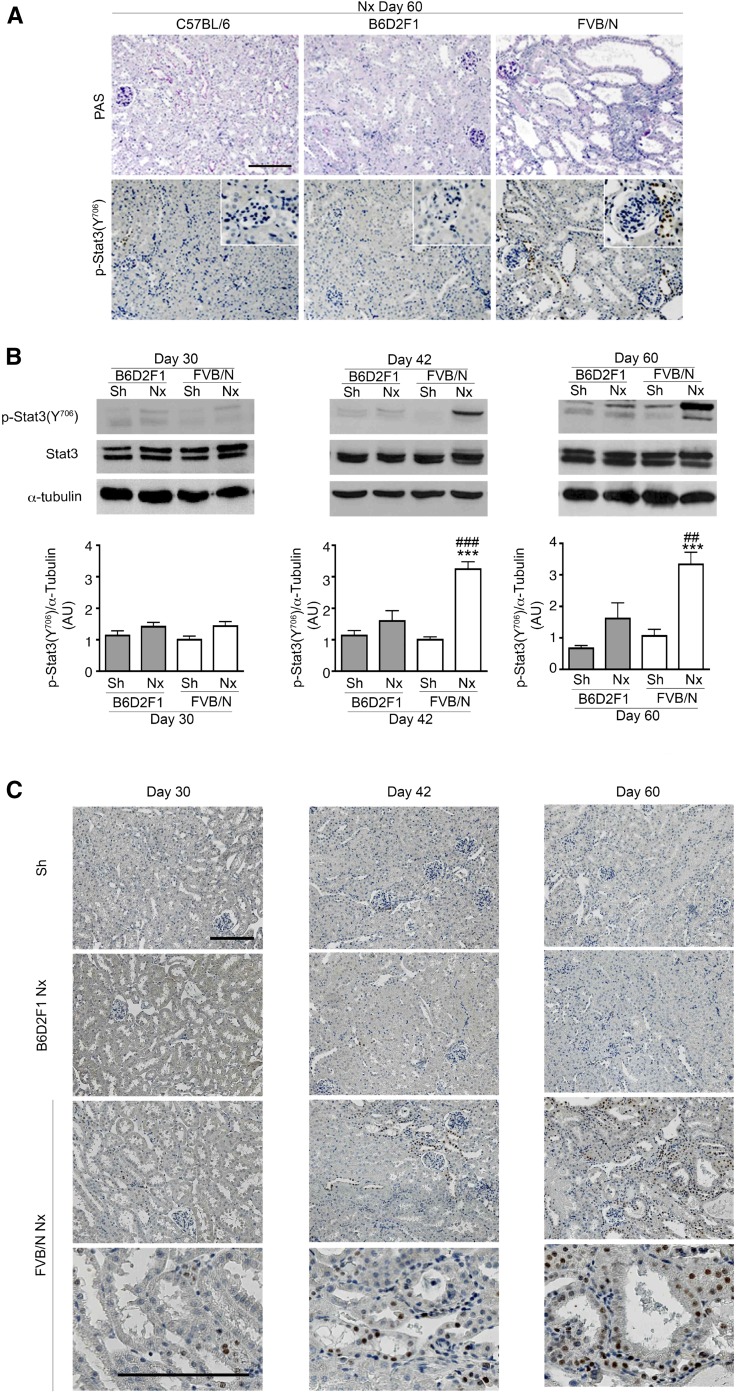
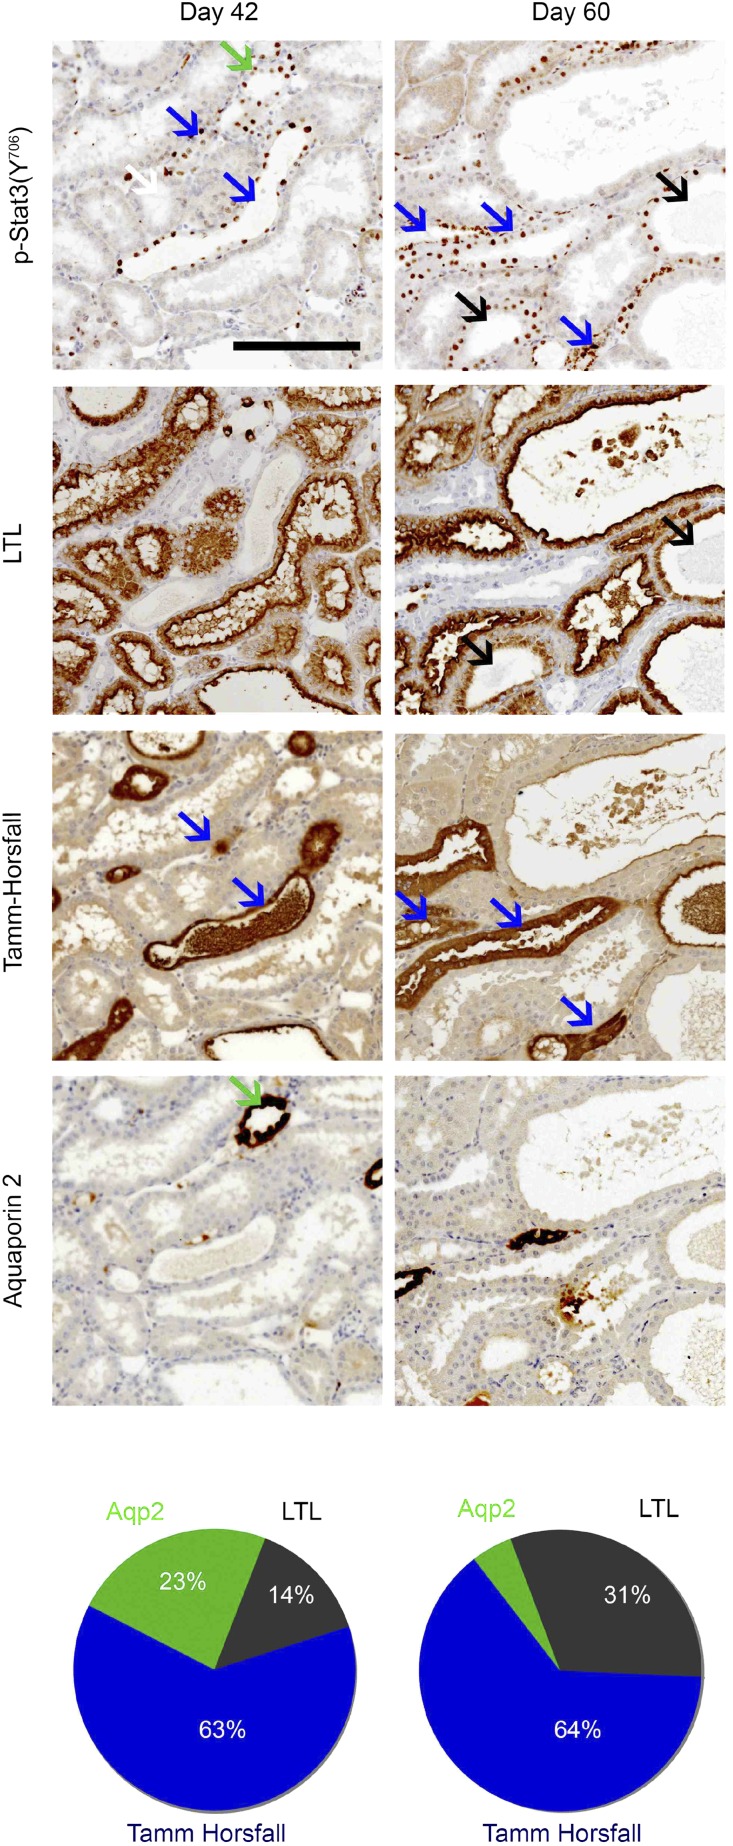
To investigate whether the activation of Stat3 is a common feature of CKD progression, we analyzed Stat3 (Y706) phosphorylation after subtotal nephrectomy (Nx) in three mouse strains that differently react to Nx.32,33 We chose this model, because nephron reduction characterizes the evolution of most human CKD. Consequently, this model recapitulates many features of human CKD, including hypertension, proteinuria, and glomerular and tubulointerstitial lesions. Immunohistochemistry revealed phosphosignal transducer and activator of transcription 3 (p-Stat3; Y706) –positive cells in the tubules and interstitium of the damaged kidneys of lesion–prone FVB/N mice but not in the remnant kidneys of the resistant C57BL/6 and B6D2F1 mice (Figure 1A). A time course analysis showed that the activation of Stat3 in tubular cells preceded the development of renal lesions 42 days after Nx (Figure 1, B and C). Sixty days after Nx, when frank renal lesions developed in FVB/N mice, Stat3 phosphorylation was still observed in renal tubules as well as in interstitial cells. In contrast, glomerular staining was rarely observed (data not shown). Analysis of serial sections stained for p-Stat3 (Y706) and specific tubular markers revealed that Stat3 activation localized principally to the ascending loop of Henle and collecting duct at day 42 (Figure 2). Notably, 60 days after Nx, Stat3 phosphorylation was also observed in damaged proximal tubules (Figure 2).
Figure 1.
Stat3 activation after nephron reduction in kidneys from lesion-resistant and lesion-prone mice. (A) Periodic acid–Schiff (PAS) staining of remnant kidneys from C57BL/6, B6D2F1, and FVB/N mice 60 days after 75% Nx (upper panel). Representative p-Stat3 (Y706) immunostaining in the same animals (lower panel). Scale bar, 100 μm (n=6 per group). (B) Western blot of Stat3 (Y706) phosphorylation of whole-kidney lysates of Sh and 75% Nx B6D2F1 and FVB/N mice 30 (n=6 in each group), 42 (n=5 in each group), and 60 days (n=6 in each group) after surgery. Data are means±SEMs. ANOVA was followed by the Tukey–Kramer test. Sh versus Nx mice: ***P<0.001. B6D2F1 versus FVB/N mice: ##P<0.01; ###P<0.001. (C) Representative p-Stat3 (Y706) immunostaining of kidneys from the same animals. Because kidneys from Sh B6D2F1 and Sh FVB/N mice were indistinguishable, only a single Sh control is shown. These are representative images of at least five mice in each group. Scale bar, 100 μm.
Figure 2.
Localization of Stat3 activation during renal lesion development. Representative coimmunostaining experiments and quantification of p-Stat3 (Y706) and specific tubular markers, Tamm–Horsfall (ascending loop of Henle and the distal convoluted tubule; blue arrows), Lotus Tetragonolobus Lectin (LTL; proximal tubules; black arrows), and aquaporin 2 (collecting tubule; green arrows) in FVB/N remnant kidneys 42 and 60 days after 75% subtotal Nx (n=3 in each group; upper panel). Scale bar, 100 μm. Quantification of the percentage of p-Stat3–positive tubules marked with each of the markers (lower panel).
Tubular–Specific Stat3 Deletion Reduces Tubulointerstitial Lesions after Nephron Reduction
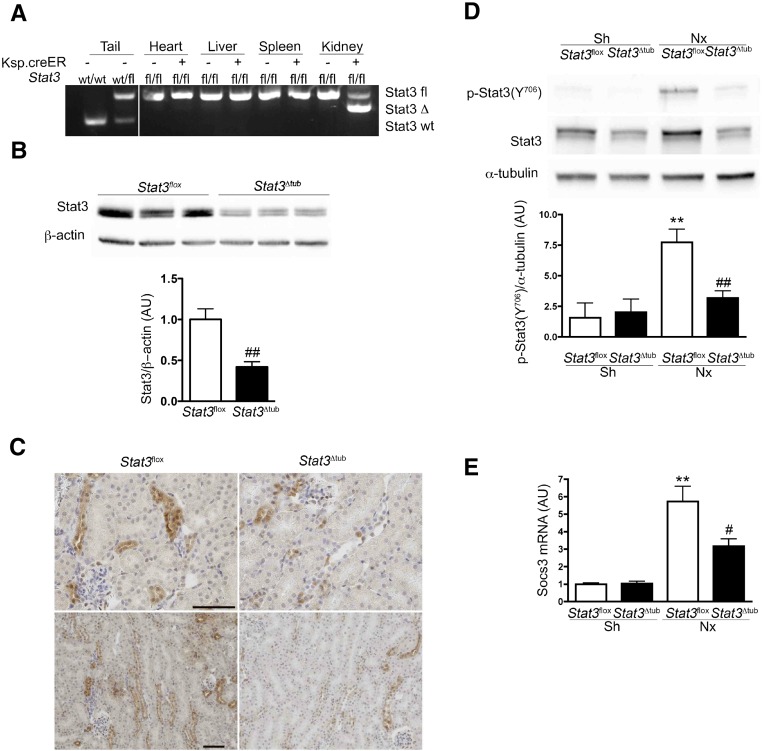
We then assessed the functional consequence of tubular Stat3 activation. Toward this aim, we first introduced the Stat3flox and Ksp.creERT2 alleles34,35 in the lesion–prone (FVB/N) genetic background. Then, we deleted Stat3 specifically in tubular cells by treating Stat3flox/floxKsp.creERT2 mice (Stat3Δtub mice) with tamoxifen. Tamoxifen–treated Stat3flox/flox mice without the Cre allele (hereafter referred as Stat3flox mice) served as controls. By crossing Ksp.creERT2 mice with a reporter Rosa26.lacZ strain, we confirmed that LacZ activity was exclusively located to renal tubules (Supplemental Figure 1). PCR experiments on different organs confirmed the kidney–specific Stat3flox allele recombination (Stat3Δtub mice) (Figure 3A). Two weeks after tamoxifen treatment, the amount of Stat3 protein was reduced by >50% in kidneys of Stat3Δtub mice compared with in those Stat3flox littermates (Figure 3B). Stat3 immunostaining confirmed the marked decrease of Stat3 expression in renal tubular cells (Figure 3C).
Figure 3.
Conditional inducible deletion of Stat3 in renal tubules of adult mice. (A) Detection of Stat3 wild–type (wt), floxed (fl), and deleted (Δ) alleles on genomic DNA from the indicated tissue of wt, Stat3fl/+, Stat3fl/fl (Stat3fl), and Stat3fl/fl Ksp.creERT2 (Stat3Δtub) mice 2 weeks after tamoxifen treatment. (B and C) Analysis of renal Stat3 expression by (B) Western blot and (C) immunohistochemistry in Stat3fl (n=3) and Stat3Δtub (n=4) mice 2 weeks after tamoxifen treatment. (D and E) Western blot analysis and quantification of (D) Stat3 (Y706) phosphorylation and (E) Socs3 mRNA expression in Sh Stat3fl (n=3), Sh Stat3Δtub (n=4), 75% Nx Stat3fl (n=9), and Nx Stat3Δtub (n=10) mice 90 days after surgery. Data are means±SEMs; (B) t test or (D and E) ANOVA was followed by the Tukey–Kramer test. Scale bar, 50 μm. Sh versus Nx mice: **P<0.01. Stat3fl versus Stat3Δtub mice: #P<0.05; ##P<0.01.
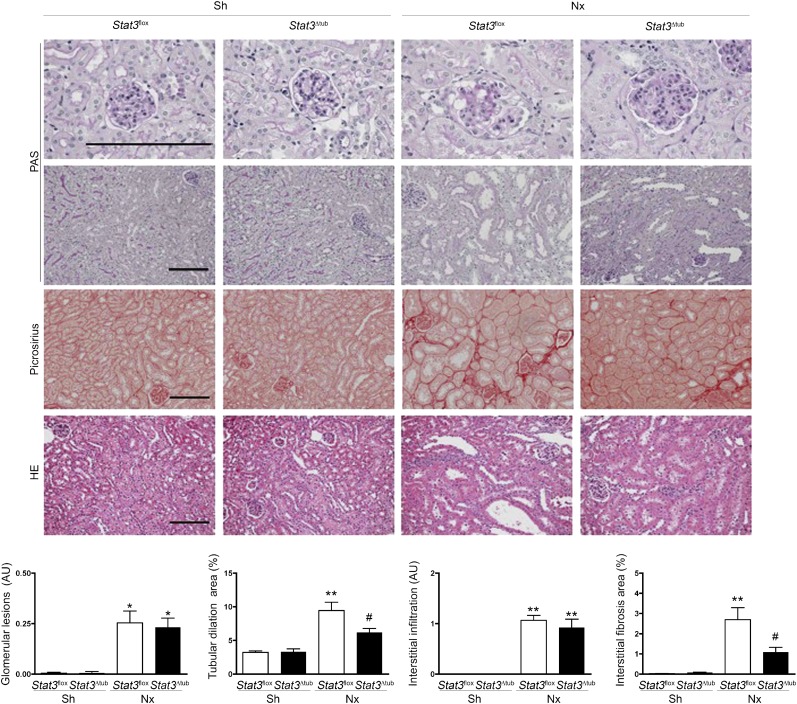
We next applied our experimental model of Nx to both Stat3flox and Stat3Δtub mice 2 weeks after tamoxifen treatment. Notably, the selective inactivation of Stat3 in tubular cells was sufficient to prevent Stat3 (Y706) phosphorylation in the whole kidney 60 days after Nx, indicating that the bulk of Stat3 activation occurs in tubular cells (Figure 3D). Consistently, the expression of Socs3 mRNA, a well characterized target of Stat3, was significantly decreased in Stat3Δtub mice compared with Stat3flox littermates (Figure 3E). As expected, tubular Stat3 invalidation had a significant effect on the development of tubular lesions after Nx. In fact, tubular dilations were reduced by 35% in Stat3Δtub mice compared with Stat3flox littermates (Figure 4). More strikingly, preventing Stat3 activation in tubular cells markedly affected the development of interstitial fibrosis, which was threefold less severe in Stat3Δtub mice compared with Stat3flox littermates (Figure 4). In contrast, glomerular lesions were mild and did not differ between the two genotypes. Together, these results indicate that Stat3 activation in tubular cells promotes interstitial fibrosis after Nx.
Figure 4.
Tubular Stat3 inactivation reduces tubulointerstitial lesions after nephron reduction. Morphology and lesion scores of kidneys from Sh Stat3flox (n=3) and Stat3Δtub (n=4) mice and 75% Nx Stat3flox (n=9) and Stat3Δtub (n=13) mice 90 days after surgery. Data are means±SEMs. ANOVA followed by Tukey–Kramer test. HE, Hematoxylin Eosin; PAS, Periodic acid–Schiff. Scale bar, 100 μm. Sh versus Nx mice: *P<0.05; **P<0.01. Stat3flox versus Stat3Δtub mice: #P<0.05.
Tubular Stat3 Does Not Affect Tubular Cell Turnover or Functional Differentiation
Tubular dilation is frequently the consequence of increased cell proliferation or impaired apoptosis.36,37 To get additional insights into the mechanisms by which Stat3 promotes tubular dilations, we assessed tubular proliferation and apoptosis in mutant and control mice 90 days after Nx by using proliferating cell nuclear antigen staining and terminal deoxynucleotidyl transferase–mediated digoxigenin-deoxyuridine nick end labeling assay. Surprisingly, Stat3 tubular invalidation prevented tubular dilation without affecting tubular cell proliferation or apoptosis (Supplemental Figure 2), indicating that other events as a defect of oriented cell divison38 might be involved. It is worth noting that Stat3 has been shown to control planar cell polarity signaling.39
In parallel, to determine if Stat3 invalidation might affect tubular functions, we measured the relative expressions of the important transcript for proximal tubule (Megalin, Pepck, Slc34a1, and Slc34a3), thick ascending limb (Slc12a1 and Umod), distal tubule (Slc12a3 and Calb1), and collecting duct (Scnn1, Aquaporin 2, and Slc4a1) functions. Among these genes, only the expressions of Megalin, Scnn1 (which codes the α-subunit of the epithelial sodium channel), and Slc4a1 (which codes anion exchanger 1) were reduced after Nx. However, tubular Stat3 deletion did not affect the expression of any of these genes (Supplemental Figure 3).
Tubular Stat3 Activation Promotes Interstitial Matrix and Fibroblast Accumulation
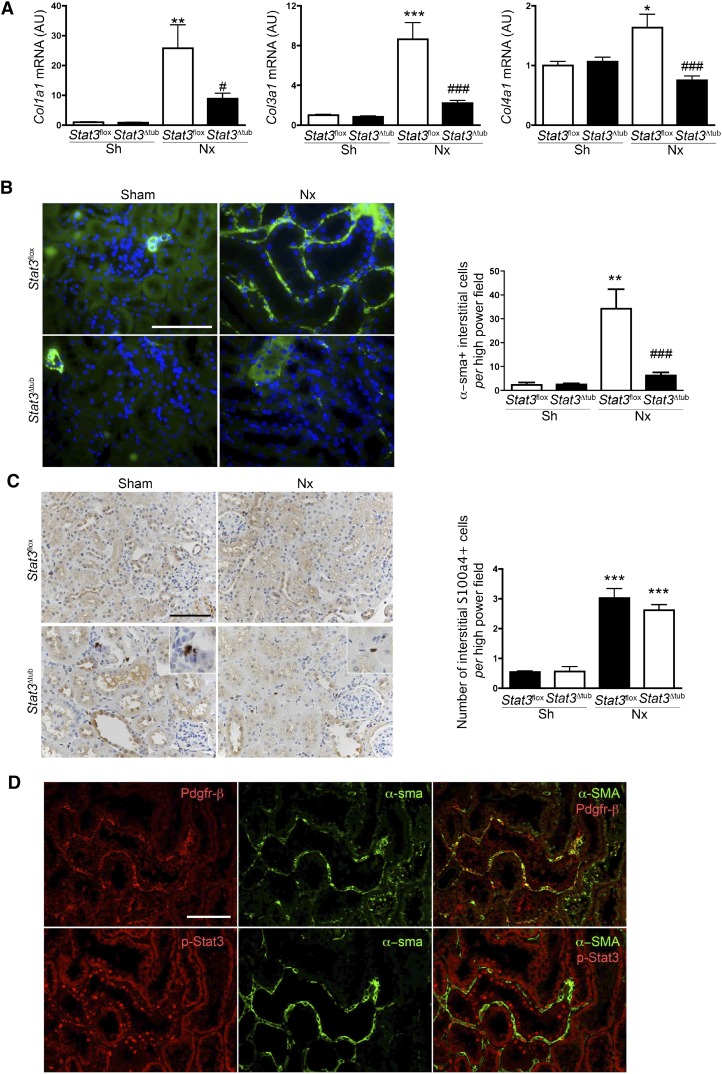
We then sought to elucidate the mechanisms by which the activation of Stat3 in tubular cells influences the accumulation of matrix in the interstitium. In this aim, we first quantified the expression of the main collagen proteins known to accumulate during the fibrogenetic process and found that collagen 1 (Col1a1), Col3a1, and Col4a1 α–chain mRNA expression was markedly reduced in Stat3Δtub mice compared with in Stat3flox mice after Nx (Figure 5A). α–Smooth muscle actin–positive (α-sma+) interstitial fibroblasts are considered the main producers of collagen in damaged kidneys.40 Interestingly, we observed that the number of α-sma+ cells was also dramatically decreased in remnant kidneys of Stat3Δtub mice compared with Stat3flox littermates (Figure 5B). In contrast, Stat3 deletion did not prevent the increase of another fibrogenic interstitial cell population, the S100a4+ cells41 (Figure 5C). Recent fate tracing experiments performed in other experimental CKD models indicate that the epithelial to mesenchymal transition does not significantly contribute to the expansion of the interstitial myofibroblastic population, which instead, derives from renal pericytes and/or resident fibroblasts.42–44 In line with these observations, we observed that α-sma+ cells frequently costained with the pericyte marker platelet–derived growth factor receptor β (Pdgfr-β) (Figure 5D). Of note, renal tubular cells remained constantly negative for α-sma staining after Nx. More importantly, localization analysis of α-sma, Pdgfr-β, and p-Stat3 (Y706) on serial sections revealed clusters of α-sma+/Pdgfr-β+ cells organized along tubules with p-Stat3+ nuclei (Figure 5D). As previously shown, α-sma+/Pdgfr-β+ cells were also positive for p-Stat3 (Y706).21 Collectively, these results suggest that, during CKD, tubular Stat3 stimulates the activation of interstitial fibroblasts, likely via paracrine signaling.
Figure 5.
Tubular Stat3 inactivation reduces interstitial collagen content and α-sma+ fibroblasts density after nephron reduction. (A) Quantitative RT-PCR of renal collagen mRNA content in kidneys from Sh Stat3flox (n=3) and Stat3Δtub (n=4) mice and 75% Nx Stat3flox (n=9) and Stat3Δtub (n=13) mice 90 days after surgery. (B) Representative α-sma immunostaining and quantification of α−sma+ cell density in Sh Stat3flox (n=3) and Stat3Δtub (n=4) mice and 75% Nx Stat3flox (n=9) and Stat3Δtub (n=13) mice 90 days after surgery. (C) Representative S100a4 immunostaining and quantification of S100a4+ cell density of the same animals. (D) Representative colocalization between Pdgfr-β and α-sma (upper panel) and p-Stat3 (Y706) and α-sma (lower panel) on serial sections of remnant kidneys of FVB/N mice 60 days after Nx. Data are means±SEMs. ANOVA was followed by the Tukey–Kramer test. Scale bar, 50 μm. Sh versus Nx mice: *P<0.05; **P<0.01; ***P<0.001. Stat3flox versus Stat3Δtub mice: #P<0.05; ###P<0.001.
Identification of the Potential Stat3 Target Genes Involved in the Tubulointerstitial Paracrine Signal
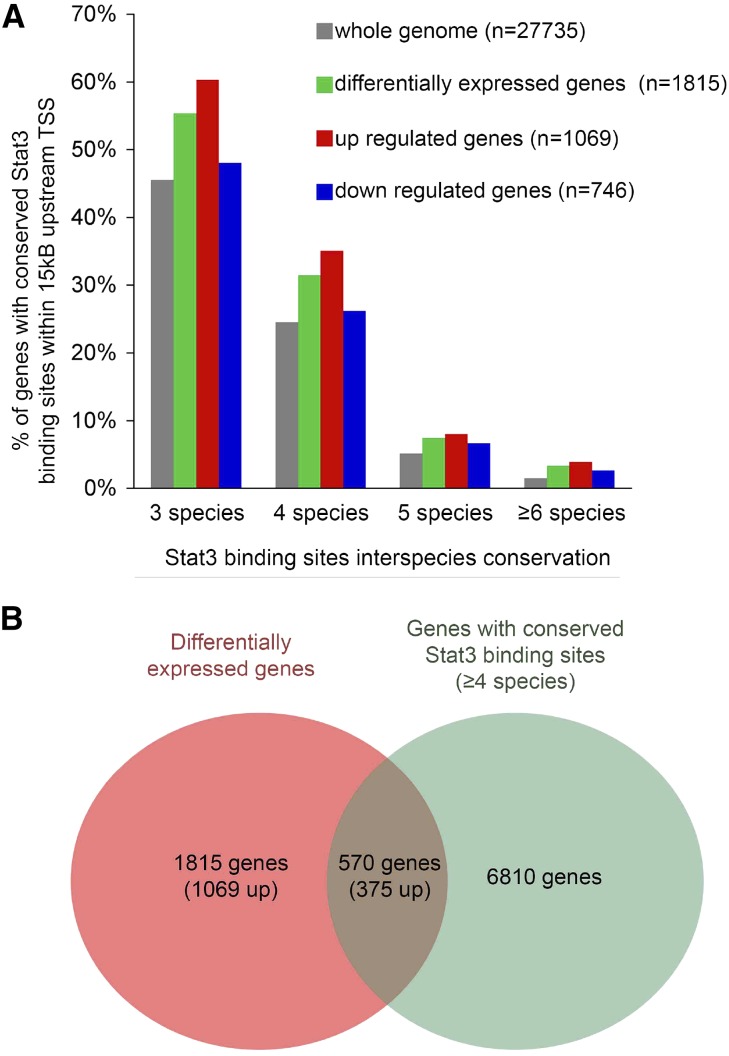
To identify the potential direct target genes of Stat3 that may mediate fibroblast activation, we took advantage of a method that we recently developed to predict Stat3 functional binding sites through comparative genomics.15 Using this approach, we reanalyzed the results of a transcriptome profiling that we previously carried out in remnant kidneys from the lesion–prone FVB/N and lesion–resistant C57BL/6 mice. We identified 1815 transcripts with expression that significantly differed between FVB/N and C57BL/6 mice 60 days after Nx. Among them, 1069 were upregulated in FVB/N remnant kidneys, whereas 746 were downregulated. Interestingly, we observed an enrichment of Stat3 conserved binding sites (CBSs) in the genes differentially expressed between the lesion-prone and the lesion-resistant mice (Figure 6A). Consistent with the fact that Stat3 behaves mainly as a transcriptional activator,13 Stat3 CBS enrichment preferentially concerned the upregulated genes. We next decided to focus our analysis on the 570 genes with an Stat3 CBS conserved in at least four species (Figure 6B, Supplemental Table 1). To refine our analysis, we systematically retrieved Entrez Gene Database, UniprotKB database, and MGI Phenotypes and Mutants community resources for the 570 genes and assessed their potential role in fibroblasts activation. Among them, we identified 16 genes encoding for paracrine molecules that could account for the tubulointerstitial communication (Table 1).
Figure 6.
Potential Stat3 target genes during renal lesion development. (A) Comparison of the frequency of predicted Stat3 binding sites in whole-mouse genome (gray) and the genes differentially expressed by C57BL/6 (n=4) and FVB/N (n=4) remnant kidneys 60 days after 75% Nx. The green bars show all of the differentially expressed genes (either up- or downregulated in FVB/N mice compared with C57BL/6 animals), whereas the red and blue bars concern only the genes up- and downregulated, respectively, in FVB/N compared with C57BL/6 mice. (B) Schematic representation of the intersection between the genes with Stat3 binding sites conserved at least in four species and the genes differentially expressed between C57BL/6 and FVB/N remnant kidneys 60 days after Nx.
Table 1.
Potential Stat3 paracrine targets involved in tubulointerstitial communication
| Gene Symbol | Name | Fold Variation FVB/N Versus C57Bl/6 | Stat3 Binding Sites Conservation |
|---|---|---|---|
| Lcn2 | Lipocalin 2 | 6.52 | Four species |
| Edn1 | Endothelin-1 | 4.07 | Four species |
| Cyr61 | Cysteine–rich angiogenic inducer 61 | 3.94 | Four species |
| Fst | Follistatin | 3.70 | Six species |
| Timp1 | Tissue inhibitor of metalloproteinase 1 | 3.27 | Four species |
| Tgm1 | Transglutaminase 1 | 2.80 | Four species |
| Tgfb2 | TGF-β2 | 2.43 | Four species |
| Ctgf | Connective tissue growth factor | 2.21 | Four species |
| Adm | Adrenomedullin | 2.11 | Four species |
| Plau | Plasminogen activator urokinase | 2.04 | Four species |
| Tagln2 | Transgelin 2 | 1.71 | Four species |
| Agt | Angiotensinogen (serpin peptidase inhibitor, clade A, member 8) | 1.63 | Five species |
| Pdgfb | Pdgr-β polypeptide | 1.53 | Four species |
| Angpt1 | Angiopoietin 1 | 0.64 | Five species |
| Enpp2 | Ectonucleotide pyrophosphatase/phosphodiesterase 2 (autotaxin) | 0.51 | Four species |
| Sfrp1 | Secreted frizzled–related protein 1 | 0.30 | Four species |
Tubular–Specific Stat3 Inactivation Reduces the Expression of Distinct Genes Promoting Extracellular Matrix Accumulation after Nephron Reduction
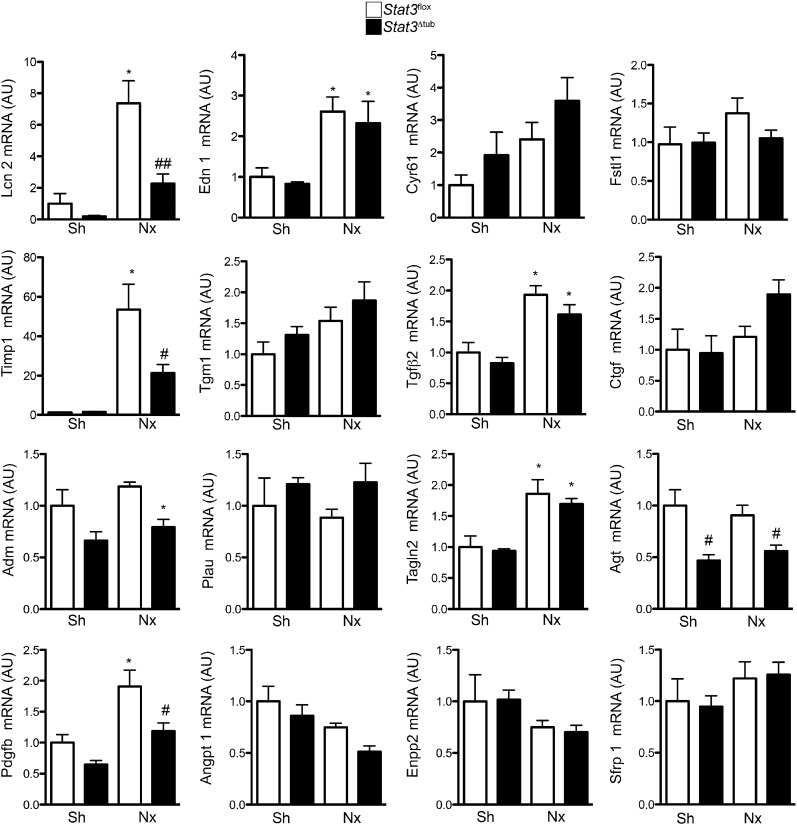
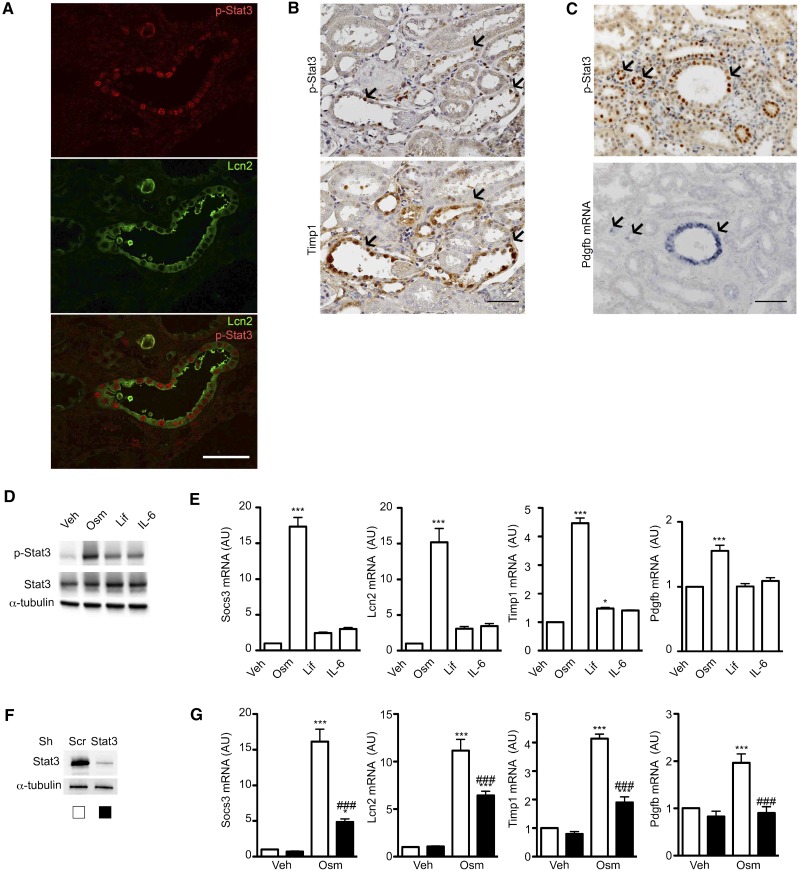
Quantitative RT-PCR confirmed that six of the potential candidates were significantly altered in remnant kidneys of FVB/N mice 60 days after Nx (Figure 7). Among these genes, only three showed Stat3-dependent upregulation after Nx: Lcn2, Pdgfb, and Timp1 (Figure 7). Colocalization studies revealed that Lcn2 and Timp1 proteins as well as Pdgfb mRNA localized to p-Stat3 (Y706) –positive tubular cells 60 days after Nx (Figure 8, A–C), supporting the hypothesis of a cell-autonomous regulation by Stat3. The colocalization was, however, not found in all of the tubular cells, indicating Stat3-independent expression of these genes and/or tubular reabsorption of secreted proteins. We then switched to an in vitro approach to test whether Lcn2, Timp1, and Pdgfb are direct targets of Stat3 in renal tubular cells. In this aim, we treated mouse inner medulla collecting duct (mIMCD-3) cells with three Stat3 activators of the IL-6 family: Oncostatin M (Osm), Leukemia-inhibiting factor, and IL-6. We used these three well characterized activators of Stat3, because we found that their expression was significantly increased in remnant kidneys of FVB/N mice after Nx compare with Sh mice (Supplemental Figure 4). Of these three cytokines, Osm induced the strongest phosphorylation of Stat3 in vitro (Figure 8D), which correlated with the strongest induction of Socs3 mRNA expression (Figure 8E). Notably, Osm treatment resulted in a significant increase of Lcn2, Timp1, and Pdgfb mRNA (Figure 8E). To unequivocally determine if this activation was dependent by Stat3, we used lentiviral transduction of short hairpin RNA to knock down Stat3 expression (Figure 8F). In line with our hypothesis, Stat3 knockdown blunted the upregulation of Lcn2, Timp1, and Pdgfb transcript in response to Osm (Figure 8G).
Figure 7.
Tubular Stat3 inactivation affects the expression of specific paracrine fibrogenic factors after nephron reduction. Quantitative RT-PCR of the 16 potential paracrine profibrotic Stat3 targets in Sh Stat3flox (n=3) and Stat3Δtub (n=4) mice and 75% Nx Stat3flox (n=9) and Stat3Δtub (n=13) mice 90 days after surgery. All relative expressions are normalized to Rpl13. Data are means±SEMs. ANOVA was followed by Tukey–Kramer test. Sh versus Nx mice: *P<0.05. Stat3flox versus Stat3Δtub mice: #P<0.05.
Figure 8.
Stat3 regulates the expression of Lcn2, Timp1, and Pdgfb in renal tubular cells. (A) Colocalization between p-Stat3 (Y706) and Lcn2 in the remnant kidney of FVB/N mice 60 days after 75% Nx. Scale bar, 50 μm. (B) Immunostaining of p-Stat3 (Y706; upper panel) and Timp1 (lower panel) on serial kidney sections from FVB/N mice 60 days after Nx. Scale bar, 100 μm. (C) Immunostaining of p-Stat3 (Y706; upper panel) and in situ hybridization of Pdgfb mRNA (lower panel) on kidney serial sections from FVB/N mice 60 days after Nx. Scale bar, 100 μm. (D and E) Western blot of (D) Stat3 (Y706) phosphorylation and (E) quantitative RT-PCR of Socs3, Lcn2, Timp1, and Pdgfb mRNA from mIMCD3 cells treated with Osm, Leukemia-inhibiting factor (Lif), IL-6, or vehicle (Veh). (F) Western blot of Stat3 from mIMCD-3 transduced with a short hairpin RNA targeting Stat3 or a scramble control (Scr). (G) Quantitative RT-PCR of Socs3, Lcn2, Timp1, and Pdgfb mRNA expression in mIMCD-3 cells transducted with a short hairpin RNA targeting Stat3 or an Scr and treated with Osm or Veh. All relative expression are normalized to Rpl13. Data are means±SEMs. ANOVA was followed by the Tukey–Kramer test. Veh versus Osm-, Lif-, or IL-6–treated cells: *P<0.05; ***P<0.001. Cells transduced with an Stat3 Sh RNA versus an Scr Sh RNA: ###P<0.001.
Lcn2 Promotes Collagen Expression in Tubular Cells
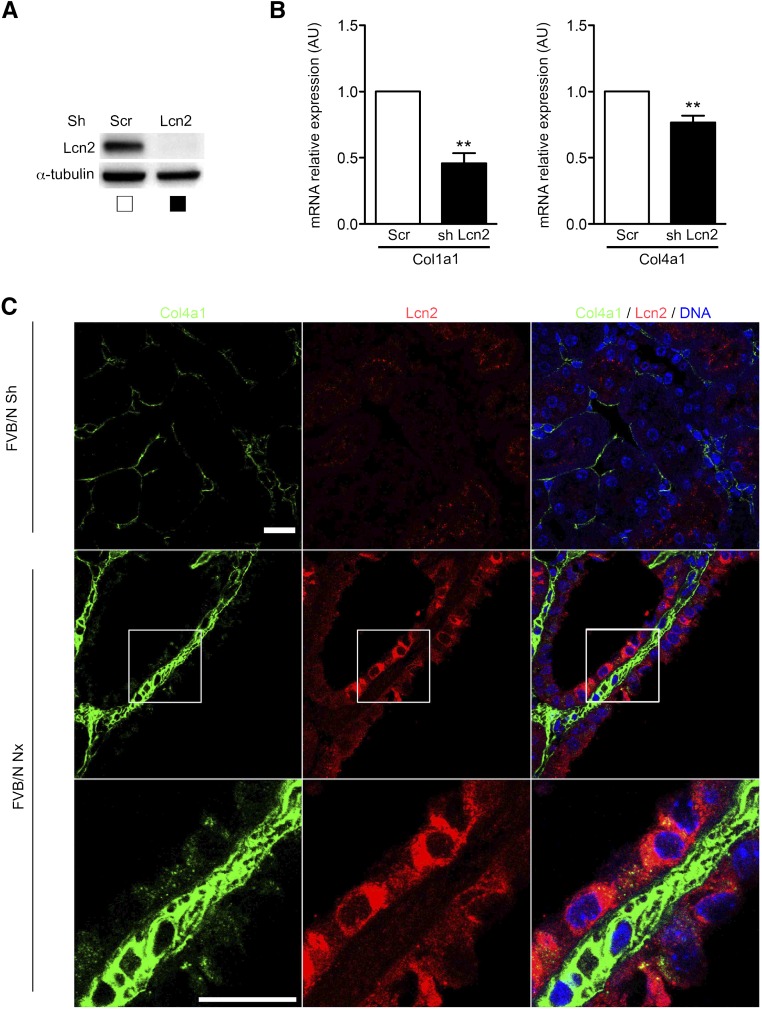
Both Pdgfb and Timp1 have been shown to induce fibroblasts proliferation.45–47 In contrast, evidence regarding the fibrogenic potential of Lcn2 is scarce. Recently, Lcn2 was shown to enhance Col1a1 mRNA expression in fibroblasts.48 To assess if Lcn2 could modulate collagen production in renal tubular cells (mIMCD-3), we used lentiviral transduction of short hairpin RNA to knock down Lcn2 expression (Figure 9A). mIMCD-3 cells expressed both Col1a1 and Col4a1 but not Col3a1 (data not shown). Tubular Lcn2 knockdown was associated with a reduction of both Col1a1 and Col4a1 mRNA expressions (Figure 9B). Interestingly, these finding were relevant in vivo. In fact, we observed, in damaged kidneys of Nx mice, an increase of Col4a1 deposition in the vicinity of tubules expressing Lcn2 (Figure 9C). In addition, Col4a1 signal was preferentially detected in the cytoplasm of Lcn2-positive cells. Together these results suggest that Lcn2 acts as a fibrogenic factor by promoting collagen synthesis by tubular cells.
Figure 9.
Lcn2 promotes collagen expression in renal tubular cells. (A) Western blot analysis of Lcn2 expression in mIMCD-3 cells transduced with either a short hairpin RNA targeting Lcn2 or a scramble control (Scr). (B) Quantitative RT-PCR of Col1a1 and Col4a1 mRNA expression in mIMCD-3 cells transduced with either a short hairpin RNA targeting Lcn2 or an Scr. Data are means±SEMs. Paired t test. **P<0.01. (C) Representative confocal images of kidney sections from Sh (n=4) or 75% Nx (n=6) FVB/N mice 60 days after surgery stained with Lcn2 and Col4a1 chain–specific antibodies. Scale bar, 20 μm.
Discussion
The accumulation of extracellular matrix in the renal interstitium plays a central role in CKD progression. Recent fate tracing experiments have identified activated α-sma+ interstitial fibroblast as the principal cell type responsible for matrix deposition into the interstitium.40,44 However, tubular cells are the primary target of critical factors implicated in CKD progression, such as proteinuria, toxic injuries, or mechanical stresses. The mechanisms translating tubular cell injuries to interstitial fibroblast activation remain unclear. By applying an experimental model of nephron reduction to mice carrying a specific deletion of Stat3 in tubular cells, we have disclosed a novel paracrine network that is crucially involved in the communication between the damaged tubular cells and the surrounding fibroblasts during CKD progression. Mechanistically, tubular Stat3 activation triggered the activation of interstitial fibroblasts/pericytes, which ultimately led to the development of interstitial fibrosis. Furthermore, we have discovered that Stat3 acts through the induction of a peculiar subset of profibrotic genes (i.e., Lcn2, Pdgfb, and Timp1). Collectively, this work provides the first experimental evidence for a role of tubular cells in the development of renal fibrosis and identifies in Stat3 a critical regulator.
Although several studies have shown an activation of Stat3 in tubular cells in both human and experimental nephropathies,21–27 the functional consequences of such activation are still unknown. Our study points to tubular Stat3 activation as the first of a cascade of events leading to the proliferation of the neighboring fibroblasts and the subsequent development of interstitial fibrosis. After almost two decades of controversy, fate tracing experiments have established that the majority of α-sma+ cells does not derive from tubular cells through the epithelial-mesenchymal transition but rather, resident interstitial cells corresponding to renal fibroblasts and/or pericytes.42–44 At the same time, several studies have clearly shown that activation of tubular cells parallels the development of interstitial fibrosis,49–51 suggesting that the interaction between these two compartments might be crucially involved in CKD progression. By showing that the selective tubular inactivation of Stat3 prevented the development of interstitial fibrosis, our study provides direct evidence in favor of this idea. More importantly, we have deciphered a novel paracrine network between tubular and interstitial cells governed by tubular Stat3 activation. In this context, we have identified three potential soluble profibrotic targets: Lcn2, Pdgfb, and Timp1. Several pieces of evidence support the idea that these molecules may be critical effectors of the fibrogenetic process. First, interstitial fibroblasts/pericytes constitutively express the Pdgf-β receptor, and exogenous Pdgfb administration results in fibroblast activation and renal fibrosis.52 In addition, pharmacologic inhibition of Pdgfb signaling reduces renal fibrosis in experimental CKD.53 Second, we previously showed that the expression of Lcn2 is upregulated in both human and rodent CKD54 and that Lcn2 inactivation reduces the interstitial fibrosis development after Nx.54 Our results showing that Lcn2 increases collagen production in tubular cells provide additional evidence for a direct link between Lcn2 and renal fibrosis. Third, although genetic manipulations of Timp1 have led to contradictory results in experimental CKD,55,56 it is likely that the marked reduction of Timp1 might partially contribute to the beneficial effect of Stat3 deletion in Nx mice. In fact, it is acknowledged that the balance between matrix metalloproteases and matrix metalloprotease inhibitors synthesis determines the extent of matrix accumulation.57 Beyond its direct effect on matrix degradation, Timp1 has been shown to promote fibroblast proliferation, providing another potential pathophysiologic function for this molecule.46,47 Whether this genetic network plays a role in other experimental models of CKD is an interesting question that deserves to be studied.
An important corollary finding of this study is that tubular Stat3 induced the accumulation of interstitial matrix through the induction of a specific and original subset of profibrotic genes. Strikingly, Stat3 deletion affected neither the expression of TGF-β2 nor that of CTGF, a well characterized profibrotic transcriptional target of canonical TGF-β signaling, suggesting that Stat3 signals orthogonally to TGF-β in this context.58 Of note, the expression of other profibrotic genes (i.e., endothelin-1 or fibronectin) was also unaffected by Stat3 deletion. Hence, it seems that the progression of renal fibrosis is fueled by the intricacy of distinct transcriptional programs that can be independently targeted to reduce the extent of renal damage. Therapeutic strategies aiming at inhibiting TGF-β signaling have evolved to phase 2 clinical studies.59 However, in other pathologic contexts, TGF-β inhibition has recently been shown to be insufficiently effective and associated with significant side effects.60 Our finding points at Stat3 inhibition as an alternative and/or a synergic therapeutic approach to TGF-β inhibition in CKD.
In conclusion, this work established the critical role played by tubular cells in the development of interstitial fibrosis after nephron reduction and identified Stat3 as a master gene of the paracrine network linking tubular and interstitial compartments during CKD progression. Other studies have previously shown the deleterious effect of Stat3 activation in glomeruli.23,25,61,62 Therefore, Stat3 seems to be a promising therapeutic target for the maintenance of both the glomerular and tubulointerstitial compartments during CKD.
Concise Methods
Animals
Mice used for these studies were female FVB/N, C57BL/6, and C57BL/6xDBA2/F1 (B6D2F1; Charles River Laboratories, Wilmington, MA) Ksp.creERT2 mice,34 Stat3flox mice,35 and Rosa26LacZ mice (The Jackson Laboratory, Bar Harbor, ME). FVB/N Stat3flox and Ksp.creERT2 mice were obtained by backcrossing heterozygous C57BL/6 Stat3flox/+ and Ksp.creERT2 mice on an FVB/N background for at least five generations before the first intercross. Animals were fed ad libitum and housed at constant ambient temperature with a 12-hour light cycle. Animal procedures were approved by the Departmental Director of Services Vétérinaires de la Préfecture de Police de Paris and the ethical committee of the Paris Descartes University.
Protocol
All experiments were performed on 9-week-old female mice. Protocols involving transgenic mice were performed on littermate mice. Mice were subjected to 75% Nx or sham operation (Sh) as previously described.32 After surgery, mice were fed a defined diet containing 30% casein and 0.5% sodium. Several groups of mice were investigated in complementary studies. For Stat3 activation time course experiments, six mice were studied for each group (Sh B6D2F1, Nx B6D2F1, Sh FVB/N, and Nx FVB/N) and each time point (30, 42, and 60 days after Nx). For microarray experiments, FVB/N and C57BL/6 mice were subjected to either Sh or Nx (n=4 for each group and genetic background) and euthanized 60 days after surgery. For Stat3 deletion experiments, we generated double–transgenic FVB/N Stat3flox/floxKsp.creERT2 mice (Stat3Δtub mice) that we compared with FVB/N Stat3flox/flox mice (Stat3flox mice). All mice were treated with tamoxifen at the dose of 7 mg/40 g body wt per day in ethanol:oil (10:1). Tamoxifen was delivered through intraperitoneal injection for 5 consecutive days. Two weeks after tamoxifen treatment, mice underwent either Sh (n=3 and n=4 for Stat3flox and Stat3Δtub mice, respectively) or Nx (n=9 and n=13 for Stat3flox and Stat3Δtub mice, respectively). Mice were euthanized 90 days after surgery, and the kidneys were harvested for analysis. This later time point was used, because we noticed that tamoxifen treatment slowly delays renal lesion progression after Nx. For Rosa26 experiments, Rosa26 mice expressing (n=4) or not expressing (n=2) the Ksp.creERT2 transgene were induced by tamoxifen and euthanized 2 weeks after tamoxifen treatment.
Renal Morphology
Kidneys were fixed in 4% paraformaldehyde and paraffin embedded, and 4-μm sections were stained with periodic acid–Schiff, Masson trichrome, Hematoxylin Eosin, and picrosirius red. The degree of glomerular lesions and interstitial cellular infiltration was evaluated using a semiquantitative score methodology as previously described with minor modifications.63 Briefly, ten randomly selected cortical microscopic fields were scored. Glomerular lesions were evaluated on periodic acid–Schiff–stained sections and graded from zero to three according to the extent of sclerosis of zero to four corresponding to glomerulosclerosis affecting <10%, 10%–24%, 25%–50%, or >50%, respectively. The degree of interstitial mononuclear cell infiltration was determined on Hematoxylin Eosin–stained sections using a zero to three injury score: zero to three correspond to 0%, 1%–10%, 10%–30%, and >30% involvement of the microscopic field, respectively. The degree of tubular dilation and interstitial fibrosis was automatically quantified using a Nikon Digital Camera Dx/m/1200 (Nikon, Tokyo, Japan) and NIS software (Laboratory Imaging Ltd). Ten randomly selected microscopic fields (×200) were scored. Surgical scars were excluded from analysis.
Expression Microarray
Total RNA was extracted and purified from remnant kidneys of FVB/N and C57BL/6 mice using the Qiagen RNeasy Mini Kit (Qiagen, Germantown, MD) as suggested by the manufacturer. RNA was then quantified and inspected with a Bioanalyzer (Agilent Technologies, Santa Clara, CA). cDNAs were generated and hybridized on mouse 430.2 Affymetrix Chips (45,101 probes; Affymetrix, Santa Clara, CA) according to the Affymetrix protocol.
Genome–Wide In Silico Analyses of Potential Stat3 Binding Sites
The methods used for the construction of Stat3 positional weight matrix and the identification of Stat3 binding sites have been previously described.15 The comparative genomic analysis was conducted as previously described with slight modifications: eight genomes were used for comparative analysis (Mus musculus, Rattus norvegicus, Homo sapiens, Gallus gallus, Canis familiar, Danio rerio, Xenopus tropicalis, and Tetraodon nigroviridis), and only the binding sites located up to 15 kb upstream of the transcription start site were considered for additional analysis.
Quantitative RT-PCR
mRNA was detected in mouse kidneys by quantitative RT-PCR using the ABI PRISM 7700 Sequence Detection System (Applied Biosystems, Foster City, CA). Rpl13 was used as the normalization control. Primers (Eurogentec) are listed in Supplemental Table 2.
Western Blot
Western blots were performed as previously described.32 Primary antibodies used were rabbit polyclonal anti–Stat3 (Cell Signaling Technology, Danvers, MA), rabbit monoclonal anti–p-Stat3 (Y706; Cell Signaling Technology), mouse monoclonal anti–α–tubulin antibody (Sigma-Aldrich, St. Louis, MO), goat anti–Lcn2 antibodies (R&D Systems, Minneapolis, MN) at 1:2000, and mouse monoclonal anti–β–tubulin antibody (Sigma-Aldrich).
Immunohistochemistry, Immunofluorescence, and β-Galacosidase Staining
For immunohistochemistry, 4-μm sections of paraffin-embedded kidneys were submitted to the appropriate antigen retrieval. Then, sections were incubated with rabbit monoclonal anti–p-Stat3 (Y706) antibodies (Cell Signaling Technology) at 1:100, anti–Stat3 rabbit polyclonal antibodies (Cell Signaling Technology), mouse anti–α–sma antibodies (Dako) at 1:10,000, rabbit anti–S100a4 antibodies (Abcam, Inc., Cambridge, MA) at 1:200, goat anti–Tamm–Horsfall antibodies (Biogenesis) at 1:200, rabbit anti–Aquaporin 2 antibodies (Sigma-Aldrich) at 1:400, goat anti–Lcn2 antibodies (R&D Systems) at 1:300, mouse anti–Timp1 antibodies (Pierce, Rockford, IL) at 1:100, and rabbit anti-Col4a1 (Novusbio) at 1:100 followed by the appropriate secondary antibody. For colocalization experiments with tubular markers, 4-μm serial sections of paraffin-embedded kidneys were used. Proximal tubules were stained using biotinylated Lotus Tetragonolobus Lectin (Vector Laboratories, Burlingame, CA) at 1:50 followed by HRP-labeled streptavidin at 1:1000. β-Galacosidase staining was performed as previously described.65 All immunofluorescence colocalization studies were analyzed using an Axio-Observer Z1 Microscope with an ApoTome2 Module (Carl Zeiss GmbH, Jena, Germany), with the exception of Col4a1 and lcn2 costaining, which was analyzed using an LSM 700 Confocal Microscope (Carl Zeiss GmbH).
Pdgfb In Situ Hybridization
Murine Pdgfb chain cDNA cloned into pBluescript.SK (a gift from Cecilia Bondjers, Gottenberg University, Gottenberg, Sweden) was linearized with XbaI (antisense probe) or HindIII (sense probe), and labeled RNA probes were synthesized with T7 RNA polymerase (antisense probe) or T3 RNA polymerase (sense probe) using dNTP mix containing digoxigenin–labeled uridine triphosphate as substrate (Roche, Basel, Switzerland). In situ hybridization was carried out on 8-μm paraffin-embedded sections. Sections were permeabilized in 0.2 N hydrochloric acid, digested with 10 μg/ml proteinase K (Roche), acetylated in 0.5% acetic anhydride, and then, hybridized overnight at 65°C with 1 μg/ml RNA probe. After washings, the slides were blocked in 10% goat serum, and digoxin was revealed with antidigoxigenin antibodies (Roche) at 1:1500 followed with nitroblue tetrazolium/bromochloroindolylphosphate AP substrate solution (Roche).
Cell Culture
mIMCD-3 cells were grown in DMEM/HamF12 (Gibco, Carlsbad, CA) medium containing 10% FBS (Sigma-Aldrich). To obtain optimal cellular differentiation and polarization, cells were plated at confluence on transwell 0.4-μm polycarbonate filters (Corning, Corning, NY) and cultured for a minimum of 5 days. Before experiments, cells were starved in a serum–free medium overnight. Then, cells were exposed for 24 hours to Osm (20 ng/ml; R&D Systems), Leukemia-inhibiting factor (100 ng/ml; Life Technologies, Carlsbad, CA), or IL-6 (100 ng/ml; Life Technologies).
For stable cell lines, mIMCD-3 cells expressing shRNA against Stat3 or Lcn2 were generated as follows. Lentiviral shRNA plasmids for Stat3 were obtained from Sigma-Aldrich. We used a target set of five clones with pLKO.1-puro as a backbone (TRCN0000071453, TRCN0000071454, TRCN0000071456, TRCN0000301878, and TRCN0000301880 for Stat3 and TRCN0000425227, TRCN0000432763, TRCN0000425363, TRCN0000431679, and TRCN0000055328 for Lcn2). The lentiviral particles were produced by cotransfection of HEK293T cells with three plasmids (pMD2G, psPAX2, and the shRNA vector) using Lipofectamine 2000 (Life Technologies). Cells were infected in the presence of 8 μg/ml polybrene overnight and selected 2 days after viral transduction in puromycin (2 μg/ml). Lentiviral constructs were selected for the subsequent experiments according to Stat3 or Lcn2 protein reduction as evaluated by Western blot analysis.
Data Analyses and Statistical Analyses
Data were expressed as means±SEMs. Differences between the experimental groups were evaluated using ANOVA followed, when significant (P<0.05), by the Tukey–Kramer test. When only two groups were compared, t test or Mann–Whitney test was used as appropriate. For microarray experiments, results are expressed as a log2 of the ratio of Cy5 to Cy3. Genes with a false discovery rate <0.05 (using the Benjamini–Hochberg procedure) and a fold change >1.5 were considered significant. The statistical analysis was performed using Graphpad Prism Software (GraphPad Software, La Jolla, CA).
Disclosures
None.
Supplementary Material
Acknowledgments
We thank Pauline Barre, Sophie Berissi, Noemi Gadessaud, Christine Bole, and the Laboratoire Expérimentation Transgenese Animal Histology and Genomics Platforms for technical assistance. We also thank Denise Laouari for discussion. We are grateful to Cecilia Bondjers (Gottenberg University, Gottenberg, Sweden) and Noel Lammande (College de France, Paris, France) for the antiplatelet–derived growth factor receptor–β probe.
This work was supported by Institut National de la Santé et de la Recherche Médicale, Université Paris Descartes, Assistance Publique - Hôpitaux de Paris, Agence Nationale Recherche, Fondation de la Recherche Médicale, pharma Research and Early Development Roche Laboratories (Basel, Switzerland), Whoami Laboratoire d'Excellence, and Institut Roche de Recherche et Médecine Translationnelle (Paris, France).
Footnotes
Published online ahead of print. Publication date available at www.jasn.org.
See related editorial, “Beyond EMT: Epithelial STAT3 as a Central Regulator of Fibrogenesis,” on pages 3502–3504.
This article contains supplemental material online at http://jasn.asnjournals.org/lookup/suppl/doi:10.1681/ASN.2015091014/-/DCSupplemental.
References
- 1.Zhang QL, Rothenbacher D: Prevalence of chronic kidney disease in population-based studies: Systematic review. BMC Public Health 8: 117, 2008 [DOI] [PMC free article] [PubMed] [Google Scholar]
- 2.Go AS, Chertow GM, Fan D, McCulloch CE, Hsu CY: Chronic kidney disease and the risks of death, cardiovascular events, and hospitalization. N Engl J Med 351: 1296–1305, 2004 [DOI] [PubMed] [Google Scholar]
- 3.Wen CP, Cheng TY, Tsai MK, Chang YC, Chan HT, Tsai SP, Chiang PH, Hsu CC, Sung PK, Hsu YH, Wen SF: All-cause mortality attributable to chronic kidney disease: A prospective cohort study based on 462 293 adults in Taiwan. Lancet 371: 2173–2182, 2008 [DOI] [PubMed] [Google Scholar]
- 4.Risdon RA, Sloper JC, De Wardener HE: Relationship between renal function and histological changes found in renal-biopsy specimens from patients with persistent glomerular nephritis. Lancet 2: 363–366, 1968 [DOI] [PubMed] [Google Scholar]
- 5.Coppo R, D’Amico G: Factors predicting progression of IgA nephropathies. J Nephrol 18: 503–512, 2005 [PubMed] [Google Scholar]
- 6.Serón D, Moreso F: Protocol biopsies in renal transplantation: Prognostic value of structural monitoring. Kidney Int 72: 690–697, 2007 [DOI] [PubMed] [Google Scholar]
- 7.Kramann R, Dirocco DP, Maarouf OH, Humphreys BD: Matrix producing cells in chronic kidney disease: Origin, regulation, and activation. Curr Pathobiol Rep 1: 1, 2013 [DOI] [PMC free article] [PubMed] [Google Scholar]
- 8.Santos CI, Costa-Pereira AP: Signal transducers and activators of transcription-from cytokine signalling to cancer biology. Biochim Biophys Acta 1816: 38–49, 2011 [DOI] [PubMed] [Google Scholar]
- 9.Reich NC, Liu L: Tracking STAT nuclear traffic. Nat Rev Immunol 6: 602–612, 2006 [DOI] [PubMed] [Google Scholar]
- 10.Frank DA: STAT3 as a central mediator of neoplastic cellular transformation. Cancer Lett 251: 199–210, 2007 [DOI] [PubMed] [Google Scholar]
- 11.Takeda K, Noguchi K, Shi W, Tanaka T, Matsumoto M, Yoshida N, Kishimoto T, Akira S: Targeted disruption of the mouse Stat3 gene leads to early embryonic lethality. Proc Natl Acad Sci U S A 94: 3801–3804, 1997 [DOI] [PMC free article] [PubMed] [Google Scholar]
- 12.Kidder BL, Yang J, Palmer S: Stat3 and c-Myc genome-wide promoter occupancy in embryonic stem cells. PLoS One 3: e3932, 2008 [DOI] [PMC free article] [PubMed] [Google Scholar]
- 13.Langlais D, Couture C, Balsalobre A, Drouin J: Regulatory network analyses reveal genome-wide potentiation of LIF signaling by glucocorticoids and define an innate cell defense response. PLoS Genet 4: e1000224, 2008 [DOI] [PMC free article] [PubMed] [Google Scholar]
- 14.Ouyang Z, Zhou Q, Wong WH: ChIP-Seq of transcription factors predicts absolute and differential gene expression in embryonic stem cells. Proc Natl Acad Sci U S A 106: 21521–21526, 2009 [DOI] [PMC free article] [PubMed] [Google Scholar]
- 15.Vallania F, Schiavone D, Dewilde S, Pupo E, Garbay S, Calogero R, Pontoglio M, Provero P, Poli V: Genome-wide discovery of functional transcription factor binding sites by comparative genomics: The case of Stat3. Proc Natl Acad Sci U S A 106: 5117–5122, 2009 [DOI] [PMC free article] [PubMed] [Google Scholar]
- 16.Choy MK, Movassagh M, Siggens L, Vujic A, Goddard M, Sánchez A, Perkins N, Figg N, Bennett M, Carroll J, Foo R: High-throughput sequencing identifies STAT3 as the DNA-associated factor for p53-NF-kappaB-complex-dependent gene expression in human heart failure. Genome Med 2: 37, 2010 [DOI] [PMC free article] [PubMed] [Google Scholar]
- 17.Gao SP, Bromberg JF: Touched and moved by STAT3. Sci STKE 2006: pe30, 2006 [DOI] [PubMed] [Google Scholar]
- 18.Gough DJ, Corlett A, Schlessinger K, Wegrzyn J, Larner AC, Levy DE: Mitochondrial STAT3 supports Ras-dependent oncogenic transformation. Science 324: 1713–1716, 2009 [DOI] [PMC free article] [PubMed] [Google Scholar]
- 19.Wegrzyn J, Potla R, Chwae YJ, Sepuri NB, Zhang Q, Koeck T, Derecka M, Szczepanek K, Szelag M, Gornicka A, Moh A, Moghaddas S, Chen Q, Bobbili S, Cichy J, Dulak J, Baker DP, Wolfman A, Stuehr D, Hassan MO, Fu XY, Avadhani N, Drake JI, Fawcett P, Lesnefsky EJ, Larner AC: Function of mitochondrial Stat3 in cellular respiration. Science 323: 793–797, 2009 [DOI] [PMC free article] [PubMed] [Google Scholar]
- 20.Hernández-Vargas P, López-Franco O, Sanjuán G, Rupérez M, Ortiz-Muñoz G, Suzuki Y, Aguado-Roncero P, Pérez-Tejerizo G, Blanco J, Egido J, Ruiz-Ortega M, Gómez-Guerrero C: Suppressors of cytokine signaling regulate angiotensin II-activated Janus kinase-signal transducers and activators of transcription pathway in renal cells. J Am Soc Nephrol 16: 1673–1683, 2005 [DOI] [PubMed] [Google Scholar]
- 21.Kuratsune M, Masaki T, Hirai T, Kiribayashi K, Yokoyama Y, Arakawa T, Yorioka N, Kohno N: Signal transducer and activator of transcription 3 involvement in the development of renal interstitial fibrosis after unilateral ureteral obstruction. Nephrology (Carlton) 12: 565–571, 2007 [DOI] [PubMed] [Google Scholar]
- 22.Arakawa T, Masaki T, Hirai T, Doi S, Kuratsune M, Arihiro K, Kohno N, Yorioka N: Activation of signal transducer and activator of transcription 3 correlates with cell proliferation and renal injury in human glomerulonephritis. Nephrol Dial Transplant 23: 3418–3426, 2008 [DOI] [PubMed] [Google Scholar]
- 23.Lu TC, Wang ZH, Feng X, Chuang PY, Fang W, Shen Y, Levy DE, Xiong H, Chen N, He JC: Knockdown of Stat3 activity in vivo prevents diabetic glomerulopathy. Kidney Int 76: 63–71, 2009 [DOI] [PMC free article] [PubMed] [Google Scholar]
- 24.Berthier CC, Zhang H, Schin M, Henger A, Nelson RG, Yee B, Boucherot A, Neusser MA, Cohen CD, Carter-Su C, Argetsinger LS, Rastaldi MP, Brosius FC, Kretzler M: Enhanced expression of Janus kinase-signal transducer and activator of transcription pathway members in human diabetic nephropathy. Diabetes 58: 469–477, 2009 [DOI] [PMC free article] [PubMed] [Google Scholar]
- 25.Feng X, Lu TC, Chuang PY, Fang W, Ratnam K, Xiong H, Ouyang X, Shen Y, Levy DE, Hyink D, Klotman M, D’Agati V, Iyengar R, Klotman PE, He JC: Reduction of Stat3 activity attenuates HIV-induced kidney injury. J Am Soc Nephrol 20: 2138–2146, 2009 [DOI] [PMC free article] [PubMed] [Google Scholar]
- 26.Ortiz-Muñoz G, Lopez-Parra V, Lopez-Franco O, Fernandez-Vizarra P, Mallavia B, Flores C, Sanz A, Blanco J, Mezzano S, Ortiz A, Egido J, Gomez-Guerrero C: Suppressors of cytokine signaling abrogate diabetic nephropathy. J Am Soc Nephrol 21: 763–772, 2010 [DOI] [PMC free article] [PubMed] [Google Scholar]
- 27.Leonhard WN, van der Wal A, Novalic Z, Kunnen SJ, Gansevoort RT, Breuning MH, de Heer E, Peters DJ: Curcumin inhibits cystogenesis by simultaneous interference of multiple signaling pathways: In vivo evidence from a Pkd1-deletion model. Am J Physiol Renal Physiol 300: F1193–F1202, 2011 [DOI] [PubMed] [Google Scholar]
- 28.Pang M, Ma L, Gong R, Tolbert E, Mao H, Ponnusamy M, Chin YE, Yan H, Dworkin LD, Zhuang S: A novel STAT3 inhibitor, S3I-201, attenuates renal interstitial fibroblast activation and interstitial fibrosis in obstructive nephropathy. Kidney Int 78: 257–268, 2010 [DOI] [PubMed] [Google Scholar]
- 29.Lim CP, Phan TT, Lim IJ, Cao X: Cytokine profiling and Stat3 phosphorylation in epithelial-mesenchymal interactions between keloid keratinocytes and fibroblasts. J Invest Dermatol 129: 851–861, 2009 [DOI] [PubMed] [Google Scholar]
- 30.Lieblein JC, Ball S, Hutzen B, Sasser AK, Lin HJ, Huang TH, Hall BM, Lin J: STAT3 can be activated through paracrine signaling in breast epithelial cells. BMC Cancer 8: 302, 2008 [DOI] [PMC free article] [PubMed] [Google Scholar]
- 31.Cheng N, Chytil A, Shyr Y, Joly A, Moses HL: Transforming growth factor-beta signaling-deficient fibroblasts enhance hepatocyte growth factor signaling in mammary carcinoma cells to promote scattering and invasion. Mol Cancer Res 6: 1521–1533, 2008 [DOI] [PMC free article] [PubMed] [Google Scholar]
- 32.Pillebout E, Burtin M, Yuan HT, Briand P, Woolf AS, Friedlander G, Terzi F: Proliferation and remodeling of the peritubular microcirculation after nephron reduction: Association with the progression of renal lesions. Am J Pathol 159: 547–560, 2001 [DOI] [PMC free article] [PubMed] [Google Scholar]
- 33.Laouari D, Burtin M, Phelep A, Martino C, Pillebout E, Montagutelli X, Friedlander G, Terzi F: TGF-alpha mediates genetic susceptibility to chronic kidney disease. J Am Soc Nephrol 22: 327–335, 2011 [DOI] [PMC free article] [PubMed] [Google Scholar]
- 34.Lantinga-van Leeuwen IS, Leonhard WN, van der Wal A, Breuning MH, de Heer E, Peters DJ: Kidney-specific inactivation of the Pkd1 gene induces rapid cyst formation in developing kidneys and a slow onset of disease in adult mice. Hum Mol Genet 16: 3188–3196, 2007 [DOI] [PubMed] [Google Scholar]
- 35.Alonzi T, Maritano D, Gorgoni B, Rizzuto G, Libert C, Poli V: Essential role of STAT3 in the control of the acute-phase response as revealed by inducible gene inactivation [correction of activation] in the liver. Mol Cell Biol 21: 1621–1632, 2001 [DOI] [PMC free article] [PubMed] [Google Scholar]
- 36.Ma M, Tian X, Igarashi P, Pazour GJ, Somlo S: Loss of cilia suppresses cyst growth in genetic models of autosomal dominant polycystic kidney disease. Nat Genet 45: 1004–1012, 2013 [DOI] [PMC free article] [PubMed] [Google Scholar]
- 37.Nishio S, Hatano M, Nagata M, Horie S, Koike T, Tokuhisa T, Mochizuki T: Pkd1 regulates immortalized proliferation of renal tubular epithelial cells through p53 induction and JNK activation. J Clin Invest 115: 910–918, 2005 [DOI] [PMC free article] [PubMed] [Google Scholar]
- 38.Fischer E, Legue E, Doyen A, Nato F, Nicolas JF, Torres V, Yaniv M, Pontoglio M: Defective planar cell polarity in polycystic kidney disease. Nat Genet 38: 21–23, 2006 [DOI] [PubMed] [Google Scholar]
- 39.Miyagi C, Yamashita S, Ohba Y, Yoshizaki H, Matsuda M, Hirano T: STAT3 noncell-autonomously controls planar cell polarity during zebrafish convergence and extension. J Cell Biol 166: 975–981, 2004 [DOI] [PMC free article] [PubMed] [Google Scholar]
- 40.Lin SL, Kisseleva T, Brenner DA, Duffield JS: Pericytes and perivascular fibroblasts are the primary source of collagen-producing cells in obstructive fibrosis of the kidney. Am J Pathol 173: 1617–1627, 2008 [DOI] [PMC free article] [PubMed] [Google Scholar]
- 41.Le Hir M, Hegyi I, Cueni-Loffing D, Loffing J, Kaissling B: Characterization of renal interstitial fibroblast-specific protein 1/S100A4-positive cells in healthy and inflamed rodent kidneys. Histochem Cell Biol 123: 335–346, 2005 [DOI] [PubMed] [Google Scholar]
- 42.Humphreys BD, Lin SL, Kobayashi A, Hudson TE, Nowlin BT, Bonventre JV, Valerius MT, McMahon AP, Duffield JS: Fate tracing reveals the pericyte and not epithelial origin of myofibroblasts in kidney fibrosis. Am J Pathol 176: 85–97, 2010 [DOI] [PMC free article] [PubMed] [Google Scholar]
- 43.Asada N, Takase M, Nakamura J, Oguchi A, Asada M, Suzuki N, Yamamura K, Nagoshi N, Shibata S, Rao TN, Fehling HJ, Fukatsu A, Minegishi N, Kita T, Kimura T, Okano H, Yamamoto M, Yanagita M: Dysfunction of fibroblasts of extrarenal origin underlies renal fibrosis and renal anemia in mice. J Clin Invest 121: 3981–3990, 2011 [DOI] [PMC free article] [PubMed] [Google Scholar]
- 44.LeBleu VS, Taduri G, O’Connell J, Teng Y, Cooke VG, Woda C, Sugimoto H, Kalluri R: Origin and function of myofibroblasts in kidney fibrosis. Nat Med 19: 1047–1053, 2013 [DOI] [PMC free article] [PubMed] [Google Scholar]
- 45.Chen YT, Chang FC, Wu CF, Chou YH, Hsu HL, Chiang WC, Shen J, Chen YM, Wu KD, Tsai TJ, Duffield JS, Lin SL: Platelet-derived growth factor receptor signaling activates pericyte-myofibroblast transition in obstructive and post-ischemic kidney fibrosis. Kidney Int 80: 1170–1181, 2011 [DOI] [PubMed] [Google Scholar]
- 46.Lu Y, Liu S, Zhang S, Cai G, Jiang H, Su H, Li X, Hong Q, Zhang X, Chen X: Tissue inhibitor of metalloproteinase-1 promotes NIH3T3 fibroblast proliferation by activating p-Akt and cell cycle progression. Mol Cells 31: 225–230, 2011 [DOI] [PMC free article] [PubMed] [Google Scholar]
- 47.Lovelock JD, Baker AH, Gao F, Dong JF, Bergeron AL, McPheat W, Sivasubramanian N, Mann DL: Heterogeneous effects of tissue inhibitors of matrix metalloproteinases on cardiac fibroblasts. Am J Physiol Heart Circ Physiol 288: H461–H468, 2005 [DOI] [PubMed] [Google Scholar]
- 48.Tarjus A, Martínez-Martínez E, Amador C, Latouche C, El Moghrabi S, Berger T, Mak TW, Fay R, Farman N, Rossignol P, Zannad F, López-Andrés N, Jaisser F: Neutrophil gelatinase-associated lipocalin, a novel mineralocorticoid biotarget, mediates vascular profibrotic effects of mineralocorticoids. Hypertension 66: 158–166, 2015 [DOI] [PubMed] [Google Scholar]
- 49.Ma FY, Flanc RS, Tesch GH, Han Y, Atkins RC, Bennett BL, Friedman GC, Fan JH, Nikolic-Paterson DJ: A pathogenic role for c-Jun amino-terminal kinase signaling in renal fibrosis and tubular cell apoptosis. J Am Soc Nephrol 18: 472–484, 2007 [DOI] [PubMed] [Google Scholar]
- 50.Yang L, Besschetnova TY, Brooks CR, Shah JV, Bonventre JV: Epithelial cell cycle arrest in G2/M mediates kidney fibrosis after injury. Nat Med 16: 535–543, 2010 [DOI] [PMC free article] [PubMed]
- 51.Prunotto M, Budd DC, Gabbiani G, Meier M, Formentini I, Hartmann G, Pomposiello S, Moll S: Epithelial-mesenchymal crosstalk alteration in kidney fibrosis. J Pathol 228: 131–147, 2012 [DOI] [PubMed] [Google Scholar]
- 52.Tang WW, Van GY, Qi M: Myofibroblast and alpha 1 (III) collagen expression in experimental tubulointerstitial nephritis. Kidney Int 51: 926–931, 1997 [DOI] [PubMed] [Google Scholar]
- 53.Ostendorf T, Eitner F, Floege J: The PDGF family in renal fibrosis. Pediatr Nephrol 27: 1041–1050, 2012 [DOI] [PubMed] [Google Scholar]
- 54.Viau A, El Karoui K, Laouari D, Burtin M, Nguyen C, Mori K, Pillebout E, Berger T, Mak TW, Knebelmann B, Friedlander G, Barasch J, Terzi F: Lipocalin 2 is essential for chronic kidney disease progression in mice and humans. J Clin Invest 120: 4065–4076, 2010 [DOI] [PMC free article] [PubMed] [Google Scholar]
- 55.Cai G, Zhang X, Hong Q, Shao F, Shang X, Fu B, Feng Z, Lin H, Wang J, Shi S, Yin Z, Chen X: Tissue inhibitor of metalloproteinase-1 exacerbated renal interstitial fibrosis through enhancing inflammation. Nephrol Dial Transplant 23: 1861–1875, 2008 [DOI] [PubMed] [Google Scholar]
- 56.Kim H, Oda T, López-Guisa J, Wing D, Edwards DR, Soloway PD, Eddy AA: TIMP-1 deficiency does not attenuate interstitial fibrosis in obstructive nephropathy. J Am Soc Nephrol 12: 736–748, 2001 [DOI] [PubMed] [Google Scholar]
- 57.Ronco P, Chatziantoniou C: Matrix metalloproteinases and matrix receptors in progression and reversal of kidney disease: Therapeutic perspectives. Kidney Int 74: 873–878, 2008 [DOI] [PubMed] [Google Scholar]
- 58.Phanish MK, Winn SK, Dockrell ME: Connective tissue growth factor-(CTGF, CCN2)--a marker, mediator and therapeutic target for renal fibrosis. Nephron, Exp Nephrol 114: e83–e92, 2010 [DOI] [PubMed] [Google Scholar]
- 59.Declèves AE, Sharma K: Novel targets of antifibrotic and anti-inflammatory treatment in CKD. Nat Rev Nephrol 10: 257–267, 2014 [DOI] [PMC free article] [PubMed] [Google Scholar]
- 60.Denton CP, Merkel PA, Furst DE, Khanna D, Emery P, Hsu VM, Silliman N, Streisand J, Powell J, Akesson A, Coppock J, Hoogen F, Herrick A, Mayes MD, Veale D, Haas J, Ledbetter S, Korn JH, Black CM, Seibold JR; Cat-192 Study Group; Scleroderma Clinical Trials Consortium : Recombinant human anti-transforming growth factor beta1 antibody therapy in systemic sclerosis: A multicenter, randomized, placebo-controlled phase I/II trial of CAT-192. Arthritis Rheum 56: 323–333, 2007 [DOI] [PubMed] [Google Scholar]
- 61.Dai Y, Gu L, Yuan W, Yu Q, Ni Z, Ross MJ, Kaufman L, Xiong H, Salant DJ, He JC, Chuang PY: Podocyte-specific deletion of signal transducer and activator of transcription 3 attenuates nephrotoxic serum-induced glomerulonephritis. Kidney Int 84: 950–961, 2013 [DOI] [PMC free article] [PubMed] [Google Scholar]
- 62.Gu L, Dai Y, Xu J, Mallipattu S, Kaufman L, Klotman PE, He JC, Chuang PY: Deletion of podocyte STAT3 mitigates the entire spectrum of HIV-1-associated nephropathy. AIDS 27: 1091–1098, 2013 [DOI] [PMC free article] [PubMed] [Google Scholar]
- 63.Pillebout E, Weitzman JB, Burtin M, Martino C, Federici P, Yaniv M, Friedlander G, Terzi F: JunD protects against chronic kidney disease by regulating paracrine mitogens. J Clin Invest 112: 843–852, 2003 [DOI] [PMC free article] [PubMed] [Google Scholar]
- 64.Lautrette A, Li S, Alili R, Sunnarborg SW, Burtin M, Lee DC, Friedlander G, Terzi F: Angiotensin II and EGF receptor cross-talk in chronic kidney diseases: A new therapeutic approach. Nat Med 11: 867–874, 2005 [DOI] [PubMed] [Google Scholar]
- 65.Verdeguer F, Le Corre S, Fischer E, Callens C, Garbay S, Doyen A, Igarashi P, Terzi F, Pontoglio M: A mitotic transcriptional switch in polycystic kidney disease. Nat Med 16: 106–110, 2010 [DOI] [PMC free article] [PubMed] [Google Scholar]
Associated Data
This section collects any data citations, data availability statements, or supplementary materials included in this article.


