

Abstract
In patients with ESRD, residual kidney function (RKF) contributes to achievement of adequate solute clearance. However, few studies have examined RKF in patients on hemodialysis. In a longitudinal cohort of 6538 patients who started maintenance hemodialysis over a 4-year period (January 2007 through December 2010) and had available renal urea clearance (CLurea) data at baseline and 1 year after hemodialysis initiation, we examined the association of annual change in renal CLurea rate with subsequent survival. The median (interquartile range) baseline value and mean±SD annual change of CLurea were 3.3 (1.9–5.0) and −1.1±2.8 ml/min per 1.73 m2, respectively. Greater CLurea rate 1 year after hemodialysis initiation associated with better survival. Furthermore, we found a gradient association between loss of RKF and all-cause mortality: changes in CLurea rate of −6.0 and +3.0 ml/min per 1.73 m2 per year associated with case mix–adjusted hazard ratios (95% confidence intervals) of 2.00 (1.55 to 2.59) and 0. 61 (0.50 to 0.74), respectively (reference: −1.5 ml/min per 1.73 m2 per year). These associations remained robust against adjustment for laboratory variables and ultrafiltration rate and were consistent across strata of baseline CLurea, age, sex, race, diabetes status, presence of congestive heart failure, and hemoglobin, serum albumin, and serum phosphorus levels. Sensitivity analyses using urine volume as another index of RKF yielded consistent associations. In conclusion, RKF decline during the first year of dialysis has a graded association with all-cause mortality among incident hemodialysis patients. The clinical benefits of RKF preservation strategies on mortality should be determined.
Keywords: hemodialysis adequacy, hemodialysis, chronic hemodialysis, end stage kidney disease, end-stage renal disease, renal function decline
In patients with ESRD, residual kidney function (RKF) contributes to achievement of adequate solute clearance and is associated with health and patient survival.1,2 RKF, even at such low levels as in patients undergoing maintenance dialysis, substantially contributes to solute clearance, particularly for protein-bound solutes and middle molecules,3,4 and among patients undergoing peritoneal dialysis, it has been shown that residual renal clearance is more strongly associated with survival versus dialysis clearance.5–8 Although this may also be the case in patients on hemodialysis, there is paucity of such data. Other benefits conferred by RKF include better fluid and metabolic homeostasis, less severity of mineral and bone abnormalities, and greater endogenous production of erythropoietin and calcitriol.7–12 These factors allow for greater fluid and dietary liberalization in this population and may prevent common complications in patients with ESRD, such as left ventricular hypertrophy, arterial media calcification, and congestive heart failure.
The importance of RKF in patients on peritoneal dialysis is widely known, but only a few studies have examined RKF in patients on hemodialysis, despite the fact that up to 45% of patients in the United States initiate maintenance dialysis at eGFRs>10 ml/min per 1.73 m2.13,14 Paucity of prior study in this area may, in part, be because of misconceptions that RKF declines rapidly after starting maintenance hemodialysis, when, in fact, the rates of RKF decline in patients on hemodialysis may be similar to those in patients on peritoneal dialysis if the current standard biocompatible membranes and bicarbonate buffer are used.15–17 In addition, timed urine collections for patients undergoing maintenance hemodialysis are labor intensive, and hence, they are not performed routinely. This is likely another important reason for the paucity of studies of RKF in patients on hemodialysis.
To address this knowledge gap, we studied a large national cohort of incident hemodialysis patients in the United States for 5 years to determine which clinical factors at the time of initiation of hemodialysis predict preserved RKF at 1 year and quantitatively investigate the association of annual change in RKF with survival. We hypothesized that faster decline in RKF has a dose-dependent association with higher mortality, irrespective of baseline RKF or comorbid conditions, in incident hemodialysis patients.
Results
Baseline Demographic, Clinical, and Laboratory Characteristics
Compared with the 44,416 excluded patients who lacked baseline residual renal urea clearance (CLurea; or KRU) data, the 6538 included patients were more likely to be men and non-Hispanic white; were more likely to have an arteriovenous fistula as their vascular access; and had larger body mass index, lower single–pool Kt/V (spKt/V), higher hemoglobin, higher albumin, lower bicarbonate, and lower ferritin at baseline (Supplemental Table 1). Additionally, compared with the 16,357 excluded patients who had CLurea data at baseline but not at year 1, the included patients were more likely to be non-Hispanic white; were more likely to have an arteriovenous fistula as their vascular access; and had greater RKF, higher hemoglobin, and higher albumin at baseline. The mean±SD age of the final study cohort was 62±14 years old, of which 65% were men, 56% were non-Hispanic white, 25% were non-Hispanic black, and 68% were diabetic (Table 1). Their median baseline renal CLurea was 3.4 (interquartile range [IQR], 2.1–5.1) ml/min per 1.73 m2.
Table 1.
Characteristics of 6538 incident hemodialysis patients who have urine collection data at both baseline and 1 year after initiation of dialysis stratified by annual change in renal CLurea
| Variable | Total, n=6538 | Annual Change in Renal CLurea | Ptrend Value | |||
|---|---|---|---|---|---|---|
| <−3 ml/min per 1.73 m2, n=1134; 17% | −3 to <−1.5 ml/min per 1.73 m2, n=1444; 22% | −1.5 to <0 ml/min per 1.73 m2, n=2073; 32% | ≥0 ml/min per 1.73 m2, n=1887; 29% | |||
| Renal CLurea, ml/min per 1.73 m2 | 3.4 (IQR, 2.1–5.1) | 6.2 (IQR, 5.2–7.9) | 3.9 (IQR, 3.0–5.0) | 2.6 (IQR, 1.7–3.8) | 2.4 (IQR, 1.3–3.7) | <0.001 |
| Urine volume, ml/d | 900 (IQR, 550–1400) | 1478 (IQR, 1100–1900) | 1075 (IQR, 750–1450) | 750 (IQR, 500–1200) | 650 (IQR, 400–1050) | <0.001 |
| Age, yr | 62±14 | 61±14 | 62±14 | 62±15 | 63±14 | 0.001 |
| Men, % | 65 | 74 | 66 | 62 | 61 | <0.001 |
| Race, % | ||||||
| Non-Hispanic white | 56 | 57 | 55 | 53 | 58 | 0.46 |
| Non-Hispanic black | 25 | 23 | 25 | 26 | 25 | 0.13 |
| Hispanic and others | 19 | 20 | 20 | 21 | 16 | <0.01 |
| Primary insurance, % | ||||||
| Medicare | 52 | 50 | 48 | 54 | 52 | 0.04 |
| Medicaid | 7 | 7 | 7 | 7 | 6 | 0.22 |
| Others | 42 | 43 | 44 | 39 | 42 | 0.15 |
| Access, % | ||||||
| Central venous catheter | 68 | 68 | 64 | 68 | 72 | 0.001 |
| AV fistula/graft | 27 | 27 | 30 | 27 | 23 | <0.001 |
| Unknown | 5 | 5 | 6 | 5 | 5 | 0.95 |
| Comorbidities, % | ||||||
| Hypertension | 52 | 48 | 51 | 55 | 53 | <0.01 |
| Diabetes | 68 | 74 | 71 | 66 | 66 | <0.001 |
| Congestive heart failure | 47 | 52 | 48 | 47 | 43 | <0.001 |
| Atherosclerotic heart disease | 16 | 17 | 16 | 15 | 17 | 0.98 |
| Other cardiovascular disease | 18 | 19 | 17 | 18 | 18 | 0.82 |
| Body mass index, kg/m2 | 27.7 (IQR, 24.0–32.8) | 27.8 (IQR, 24.4–32.8) | 27.8 (IQR, 23.8–32.6) | 27.4 (IQR, 23.9–32.4) | 27.7 (IQR, 24.2–33.2) | 0.98 |
| spKt/V | 1.30±0.27 | 1.23±0.26 | 1.28±0.27 | 1.32±0.26 | 1.34±0.28 | <0.001 |
| Ultrafiltration rate, L/h | 0.58±0.24 | 0.60±0.24 | 0.59±0.25 | 0.59±0.23 | 0.56±0.23 | <0.001 |
| nPCR, g/kg per d | 1.0±0.3 | 1.11±0.29 | 1.05±0.28 | 0.99±0.27 | 0.95±0.27 | <0.001 |
| Laboratory variables | ||||||
| Hemoglobin, g/dl | 11.5±1.0 | 11.6±1.0 | 11.6±1.0 | 11.5±1.0 | 11.5±1.1 | 0.02 |
| Albumin, mg/dl | 3.64±0.42 | 3.59±0.44 | 3.62±0.43 | 3.65±0.40 | 3.67±0.41 | <0.001 |
| Creatinine, mg/dl | 6.0±2.2 | 5.2±1.8 | 6.0±2.1 | 6.4±2.4 | 6.0±2.2 | <0.001 |
| Calcium, mg/dl | 9.1±0.5 | 9.1±0.5 | 9.1±0.5 | 9.1±0.5 | 9.1±0.5 | <0.01 |
| Phosphorus, mg/dl) | 5.1±1.1 | 4.9±1.0 | 5.1±1.1 | 5.2±1.1 | 5.0±1.0 | 0.08 |
| Intact PTH, pg/ml | 313 (IQR, 207–461) | 292 (IQR, 195–420) | 326 (IQR, 208–485) | 328 (IQR, 218–482) | 303 (IQR, 201–441) | 0.31 |
| Iron saturation, % | 23±8 | 22±7 | 23±7 | 22±8 | 23±8 | 0.80 |
| Ferritin, pg/nl | 243 (IQR, 140–403) | 219 (IQR, 136–364) | 230 (IQR, 132–380) | 249 (IQR, 141–401) | 258 (IQR, 148–437) | <0.001 |
| Bicarbonate, mmol/L | 23.2±2.5 | 23.1±2.5 | 23.1±2.5 | 23.1±2.5 | 23.4±2.5 | 0.003 |
All repeated measures from each patient during the first patient-quarter (the first 91 days of dialysis) were averaged, and the quarterly means are presented. Values are expressed as means±SDs, medians (IQRs), or percentages as appropriate. Conversion factors for units: albumin and hemoglobin in grams per deciliter to grams per liter, 10; creatinine in milligrams per deciliter to millimoles per liter, 88.4; calcium in milligrams per deciliter to millimoles per liter, 0.2495; and phosphorus in milligrams per deciliter to millimoles per liter, 0.3229. No conversion is necessary for ferritin in nanograms per milliliter and milligrams per liter. AV, arteriovenous.
Predictors of Annual Decline in RKF
Renal CLurea rates at 1 year after initiation of hemodialysis were lower than baseline levels (P for signed rank test <0.001); median renal CLurea was 2.1 (IQR, 0.9–3.6) ml/min per 1.73 m2, and mean±SD annual change in renal CLurea was −1.1±2.8 ml/min per 1.73 m2. In the overall cohort, 1134 (17%), 1444 (22%), and 2073 (32%) patients had change in renal CLurea <−3.0, −3.0 to <−1.5, and −1.5 to <0.0 ml/min per 1.73 m2, respectively, and 1887 (29%) showed maintained or increased CLurea during the first year of dialysis (Table 1).
After adjustment for case mix characteristics and baseline value, factors associated with less decline in renal CLurea included non-Hispanic white; presence of atherosclerotic heart disease; higher body mass index, hemoglobin, albumin, and corrected calcium; and normalized protein catabolic rate (nPCR) <0.8 g/kg per day at baseline, whereas older age, diabetes, presence of congestive heart failure, and higher creatinine, phosphorus, intact parathyroid hormone (PTH), and iron saturation at baseline were associated with faster decline in renal CLurea (Table 2). Consistent findings were observed in the fully adjusted model, whereas the association with faster CLurea decline became significant in women and higher serum bicarbonate rates. In the sensitivity analyses, where patients with baseline CLurea <1.5 ml/min per 1.73 m2 were excluded (Supplemental Table 2), atherosclerotic heart disease was not associated with annual change in CLurea. Additionally, nPCR and intact PTH lost their significance in the fully adjusted model.
Table 2.
Association of baseline characteristics with annual change in residual renal CLurea among 6538 incident patients on hemodialysis
| Variables | Case Mix–Adjusted Model | Fully Adjusted Model | ||
|---|---|---|---|---|
| β (95% CI) | P Value | β (95% CI) | P Value | |
| Baseline renal CLurea per 1.0 ml/min per 1.73 m2 | −0.62 (−0.65 to −0.59) | <0.001 | −0.70 (−0.74 to −0.67) | <0.001 |
| Age, yr | ||||
| <50 | −0.11 (−0.26 to 0.05) | 0.17 | 0.17 (0.01 to 0.32) | 0.04 |
| 50 to <60 | −0.16 (−0.29 to −0.02) | 0.03 | −0.04 (−0.18 to 0.10) | 0.56 |
| 60 to <70 | Reference | Reference | ||
| 70 to <80 | −0.08 (−0.22 to 0.06) | 0.25 | −0.19 (−0.33 to −0.05) | <0.01 |
| ≥80 | −0.29 (−0.46 to −0.11) | 0.001 | −0.48 (−0.66 to −0.30) | <0.001 |
| Men | −0.01 (−0.12 to 0.10) | 0.90 | 0.26 (0.15 to 0.38) | <0.001 |
| Race/ethnicity | ||||
| Non-Hispanic white | Reference | Reference | ||
| Non-Hispanic black | −0.34 (−0.45 to −0.22) | <0.001 | −0.15 (−0.28 to −0.02) | 0.02 |
| Hispanic and other | −0.32 (−0.44 to −0.19) | <0.001 | −0.10 (−0.22 to 0.03) | 0.14 |
| Medicare as primary insurance | −0.03 (−0.13 to 0.07) | 0.61 | −0.04 (−0.14 to 0.05) | 0.39 |
| Central venous catheter use | 0.09 (−0.01 to 0.19) | 0.06 | 0.19 (0.09 to 0.29) | <0.001 |
| Comorbidities | ||||
| Hypertension | −0.03 (−0.13 to 0.07) | 0.53 | −0.01 (−0.11 to 0.09) | 0.86 |
| Diabetes | −0.16 (−0.27 to −0.05) | 0.004 | −0.20 (−0.31 to −0.08) | 0.001 |
| Congestive heart failure | −0.31 (−0.41 to −0.21) | <0.001 | −0.27 (−0.37 to −0.18) | <0.001 |
| Atherosclerotic heart disease | 0.18 (0.03 to 0.34) | 0.02 | 0.19 (0.04 to 0.34) | 0.01 |
| Other cardiovascular disease | 0.01 (−0.13 to 0.16) | 0.87 | −0.02 (−0.16 to 0.12) | 0.77 |
| spKt/V per SD | 0.01 (−0.05 to 0.06) | 0.79 | 0.01 (−0.05 to 0.07) | 0.79 |
| Body mass index per SD | 0.09 (0.04 to 0.15) | 0.001 | 0.08 (0.02 to 0.14) | <0.01 |
| nPCR, g/kg per d | ||||
| <0.8 | 0.27 (0.12 to 0.43) | <0.001 | 0.19 (0.04 to 0.34) | 0.01 |
| 0.8 to <1.0 | 0.04 (−0.09 to 0.18) | 0.54 | −0.01 (−0.14 to 0.12) | 0.87 |
| 1.0 to <1.2 | Reference | Reference | ||
| ≥1.2 | −0.04 (−0.18 to 0.11) | 0.64 | 0.02 (−0.12 to 0.16) | 0.76 |
| Laboratories | ||||
| Hemoglobin per SD | 0.07 (0.02 to 0.12) | <0.01 | 0.05 (−0.01 to 0.10) | 0.09 |
| Albumin, g/dl | ||||
| <3.2 | −0.56 (−0.70 to −0.41) | <0.001 | −0.73 (−0.89 to −0.58) | <0.001 |
| 3.2 to <3.6 | −0.28 (−0.40 to −0.16) | <0.001 | −0.36 (−0.48 to −0.24) | <0.001 |
| 3.6 to <4.0 | Reference | Reference | ||
| ≥4.0 | 0.07 (0.03 to 0.12) | 0.002 | 0.34 (0.20 to 0.48) | <0.001 |
| Creatinine per SD | −0.39 (−0.45 to −0.33) | <0.001 | −0.38 (−0.45 to −0.31) | <0.001 |
| Calcium per SD | 0.07 (0.03 to 0.12) | 0.002 | 0.08 (0.03 to 0.13) | 0.002 |
| Phosphorus per SD | −0.30 (−0.35 to −0.25) | <0.001 | −−0.17 (−0.22 to −0.11) | <0.001 |
| Intact PTH, pg/ml | ||||
| <160 | 0.28 (0.12 to 0.44) | 0.001 | 0.12 (−0.04 to 0.28) | 0.14 |
| 160 to <320 | 0.23 (0.11 to 0.34) | <0.001 | 0.13 (0.01 to 0.24) | 0.03 |
| 320 to <640 | Reference | Reference | ||
| ≥640 | −0.25 (−0.38 to −0.12) | <0.001 | −0.13 (−0.26 to 0.00) | 0.04 |
| Iron saturation per SD | −0.05 (−0.10 to 0.00) | 0.04 | −0.07 (−0.12 to −0.02) | <0.01 |
| Ferritin, ng/ml | ||||
| <200 | −0.09 (−0.23 to 0.04) | 0.18 | −0.11 (−0.24 to 0.03) | 0.12 |
| 200 to <400 | −0.05 (−0.19 to 0.09) | 0.49 | −0.05 (−0.19 to 0.09) | 0.46 |
| 400 to <800 | Reference | Reference | ||
| ≥800 | 0.19 (−0.08 to 0.45) | 0.16 | 0.25 (−0.01 to 0.51) | 0.06 |
| Bicarbonate per SD | 0.01 (−0.04 to 0.06) | 0.60 | −0.13 (−0.18 to −0.08) | <0.001 |
Case mix variables included baseline urine volume, age, sex, race/ethnicity, primary insurance, central venous catheter use, comorbidities, and spKt/V.
RKF at 1 Year and Survival
A total of 1046 patients died during the follow-up period after year 1 until the end of the study (December 31, 2011). There was a significant trend toward lower mortality with higher renal CLurea (Ptrend<0.001 across all models). Compared with patients who had renal CLurea of 3.0 to <6.0 ml/min per 1.73 m2 at 1 year after hemodialysis initiation, those who had renal CLurea of 1.5 to <3.0 and <1.5 ml/min per 1.73 m2 experienced higher mortality, which remained significant after adjusting for case mix characteristics (hazard ratio [HR], 1.26; 95% confidence interval [95% CI], 1.08 to 1.47 and HR, 1.67; 95% CI, 1.44 to 1.94, respectively) or body mass index and laboratory variables at 1 year after hemodialysis initiation (Figure 1). The mortality risk in patients who had renal CLurea of ≥6.0 ml/min per 1.73 m2 at year 1 was not significantly different in the unadjusted model and the case mix adjustment model, but it was lower in the fully adjusted model (HR, 0.74; 95% CI, 0.57 to 0.97).
Figure 1.

Renal CLurea and all-cause mortality risk in incident hemodialysis patients. The mortality risk associated with renal CLurea at 1 year after initiating dialysis among 6538 incident hemodialysis patients (2007–2010) with three levels of adjustment. There was a significant trend toward lower mortality of higher renal CLurea (P for trend <0.001 across all models).
Annual Change in RKF and Survival
Cox regression analyses with restricted cubic spline functions showed a significant association of annual change in renal CLurea with all-cause mortality in the minimally adjusted, case mix–adjusted, and fully adjusted models (Figure 2); patients with faster CLurea decline showed higher risks of mortality. Case mix–adjusted HRs were 2.00 (95% CI, 1.55 to 2.59), 1.25 (95% CI, 1.16 to 1.35), 0.81 (95% CI, 0.73 to 0.91), and 0.61 (95% CI, 0.50 to 0.74) at −6.0, −3.0, ±0.0, and +3.0 ml/min per 1.73 m2 per year of change in CLurea, respectively (reference: −1.5 ml/min per 1.73 m2 per year). These associations were robust against additional adjustment for baseline ultrafiltration rate and its annual change. Consistent trends were observed in subgroup analyses according to baseline CLurea (Figure 3). Rapid CLurea decline (>3.0 ml/min per 1.73 m2 per year) also showed a case mix–adjusted HR of 1.62 (95% CI, 1.27 to 2.07) for all-cause mortality. This association was not modified by baseline age (≥65 or <65 years old), sex, race (white or nonwhite), diabetes, presence of congestive heart failure, hemoglobin (≥11.5 or <11.5 g/dl), serum albumin (≥3.6 or <3.6 g/dl), and serum phosphorus (≥5.0 or <5.0 mg/dl; Pinteraction>0.20 for all) (Figure 4).
Figure 2.

Distributions and restricted cubic splines comparing the relationship of annual change in residual renal CLurea with all-cause mortality among 6538 incident hemodialysis patients (2007–2010): (A) baseline renal CLurea adjustment model, (B) case mix adjustment model, (C) fully adjusted model, and (D) additional adjustment for baseline ultrafiltration rate (UFr) and its annual change on the fully adjusted model. Annual changes in renal CLurea were calculated subtracting values at year 1 (the fifth patient-quarter; the first 91 days of the second year of dialysis) from those at baseline (the first patient-quarter; the first 91 days of the first year of dialysis). Dashed and solid lines represent HR estimates and 95% CIs, respectively.
Figure 3.

Distributions and case mix–adjusted all–cause death HRs of annual change in renal CLurea by using restricted cubic splines among 6538 incident hemodialysis patients (2007–2010) stratified by baseline CLurea levels: (A) <1.5 ml/min per 1.73 m2, (B) 1.5 to <3.0 ml/min per 1.73 m2, (C) 3.0 to <6.0 ml/min per 1.73 m2, and (D) ≥6.0 ml/min per 1.73 m2. Annual changes in renal CLurea were calculated subtracting values at year 1 (the fifth patient-quarter; the first 91 days of the second year of dialysis) from those at baseline (the first patient-quarter; the first 91 days of the first year of dialysis). Dashed and solid lines represent HR estimates and 95% CIs, respectively.
Figure 4.

Overall and subgroup analyses of associations between rapid decline in residual renal CLurea >3 ml/min per 1.73 m2 per year and all-cause mortality among 6538 incident hemodialysis patients (2007–2010) in the case mix adjustment model. Annual changes in renal CLurea were calculated subtracting values at year 1 (the fifth patient-quarter; the first 91 days of the second year of dialysis) from those at baseline (the first patient-quarter; the first 91 days of the first year of dialysis). Points and bars represent HR estimates and 95% CIs, respectively. Alb, albumin; CHF, congestive heart failure; Hgb, hemoglobin; Phos, phosphorus.
Sensitivity Analyses Using Urine Volume as Another Index of RKF
Median baseline urine volume was 900 (IQR, 550–1400) ml/d (Supplemental Table 3). Median urine volume at year 1 was 650 (IQR, 380–1100) ml/d, and mean±SD annual change in urine volume was −240±610 ml/d. Compared with factors related to annual decline in CLurea, older age, non-Hispanic black, diabetes, presence of congestive heart failure, lower body mass index, lower serum albumin, higher serum creatinine, and higher serum phosphorus were consistently associated with faster decline in urine volume, irrespective of the adjustment model. Women, lower serum calcium, and higher serum bicarbonate also showed significant relationships to faster annual decline in the fully adjusted model (Supplemental Table 4). These findings were confirmed in the sensitivity analyses, where patients with baseline urine volume <300 ml/d were excluded (Supplemental Table 5).
There was a significant trend toward lower mortality at higher urine volume (Ptrend<0.001 across all models) (Supplemental Figure 1). Annual change in urine volume showed a significant association with all-cause mortality in all models, including adjustment for ultrafiltration rate and its annual change (Supplemental Figure 2); patients with faster decline in urine volume showed higher risk of mortality. Consistent trends were observed in subgroup analyses according to the baseline urine volume categories shown (Supplemental Figure 3). Rapid decline in urine volume (>600 ml/d per year) also showed higher mortality risk in the case mix adjustment model, and this association was not modified by any of the prespecified variables (Pinteraction>0.20 for all) (Supplemental Figure 4).
Discussion
Among 6538 incident hemodialysis patients who had available urine data at the time of hemodialysis initiation and 1 year afterward from a large dialysis organization in the United States, greater renal CLurea rates at year 1 were associated with better survival. Additionally, annual decline in renal CLurea showed a gradient association with all-cause death. These associations were robust against additional adjustment for laboratory variables and ultrafiltration rate, and they were consistent across strata of baseline RKF, age, sex, race, diabetes, congestive heart failure history, hemoglobin, serum albumin, and serum phosphorus. Sensitivity analyses using urine volume as another index of RKF yielded consistent associations.
Given the exclusion of RKF from the assessment of hemodialysis adequacy in the recent End-Stage Renal Disease Quality Incentive Program,18 the findings from our study are both timely and relevant. At this time, the only metric considered in the ascertainment of hemodialysis adequacy is spKt/V, with a threshold of ≥1.2. However, many patients early in their course of ESRD may retain substantial RKF, which may have an important bearing on their achievement of adequate clearance and volume removal, leading to better clinical outcomes. Furthermore, individualizing hemodialysis prescriptions according to RKF may allow for the reductions in dialysis treatment time and frequency, which may favorably affect patients’ quality of life and reduce medical costs.19–21
Although several investigators addressed the importance of RKF preservation, even in patients on hemodialysis, evaluation of change in RKF using at least two measurements separated by a reasonably long time interval is needed to overcome lead time bias. In a cohort study of 734 incident hemodialysis patients from the United States conducted in the late 1990s, RKF was qualitatively examined by questionnaire (urine volume ≥250 or <250 ml/d) in a prospective manner.10 Of these patients, 260 (35%) responded at both baseline and 1 year, and patients who reported maintained urine volume ≥250 ml/d during the first 1 year of dialysis showed better survival than those who lost urine output. The Netherlands Cooperative Study on the Adequacy of Dialysis Study Group prospectively examined 609 and 1191 patients new to peritoneal dialysis and hemodialysis, respectively, and showed that full loss of RKF was associated with higher mortality, irrespective of modality, hemodialysis, or peritoneal dialysis.22 However, when RKF was not fully lost, there was no significant association between RKF and mortality. Despite some discrepancies in results, partly because of differences in study populations, thresholds used to define RKF, and statistical modeling approaches (traditional Cox models used to evaluate long-term association in the former versus marginal structural model used to evaluate short-term association and account for time-dependent confounding in the latter), our study consistently shows the survival benefit of preserved RKF using a larger national representative cohort of incident hemodialysis patients. Rapid decrease in RKF has also been identified as an independent risk factor for all-cause death in patients on peritoneal dialysis.23
We observed large variations in annual change in RKF and identified several predictors of preserved RKF at 1 year after hemodialysis initiation after adjustment for baseline RKF values and case mix characteristics. Compared with a previous report by Moist et al.,9 women, nonwhite race, diabetes, and history of congestive heart failure were consistent risk factors of RKF decline. Although renin-angiotensin system inhibitors have been suggested to preserve RKF in patients on hemodialysis,9,24 medication information was not available in our study. However, a recent randomized, controlled trial found no significant difference in RKF decline over time with use of the angiotensin receptor blocker irbesartan versus placebo in patients undergoing hemodialysis.25 Although the not removing water strategy with hemodialysis may maintain urine volume, it also increases BP, left ventricular mass index, and cardiovascular events,26 suggesting the importance of individualized volume management to avoid both congestive heart failure and intradialytic hypotension.9,27 Other potential strategies include avoidance of nephrotoxic agents, ultrapure dialysis fluid,28 online hemodiafiltration,29,30 diuretic use,31,32 and incremental hemodialysis regimens.19–21,33–35
A substantial number of patients in this study increased their renal CLurea rate during the first 1 year of hemodialysis treatment. Although it may be partly caused by measurement error as with large decreases in RKF, subgroup analyses and sensitivity analyses excluding subjects with low baseline RKF yielded consistent results. Additionally, a US Renal Data System special study has shown that congestive heart failure and AKI are among the most common reasons of hospitalization at hemodialysis initiation,36 and approximately 5% of incident hemodialysis patients recovered their kidney function with successful discontinuation of dialysis treatment in 2008 and 2009.37 The prevalence of recovery of renal function is increasing over time and may be underestimated if patients continue dialysis without re-evaluation of RKF after recovery of their renal function.
We acknowledge several other limitations in this study. First, cause-specific death was not available in this study. Second, RKF measurement is not accurate given the use of CLurea and not the average of renal urea and creatinine clearances and the difficulties in complete collection of urine samples and its punctuality in patient daily life. The use of factor 0.9 for predialysis serum urea nitrogen for renal CLurea calculation might have also induced errors to some extent. Nevertheless, the population-level associations with clinical outcomes can be estimated from an adequate number of subjects if such errors are not associated with the outcome. Third, available RKF measures may not be representative of those in the entire hemodialysis population, because patients on dialysis with limited or no RKF are less likely to have undergone urine collections, especially at 1 year after hemodialysis initiation. This potential selection bias might have resulted in missing patients who lost RKF during the first 1 year of dialysis, and thus, the mortality risk of RKF decline might be underestimated. Additionally, although we adjusted for only baseline patient characteristics and not those at year 1 to avoid overadjustment, RKF decline could also be an intermediary between adverse events (e.g., cardiovascular events and infection) during the first year of dialysis and subsequent mortality. Indeed, the mortality risk of RKF decline was attenuated to some extent after adjusting for body mass index and laboratory variables at both baseline and 1 year, but it still remained significant (data not shown). Although it is hard to estimate the net effect of the former and the latter limitations, our results met seven of nine of the criteria by Hill38 (i.e., temporal relationship, strength, dose-response relationship, consistency, biologic plausibility, coherence, and reasoning by analogy), suggesting a possible causal relationship between RKF decline and all-cause death in patients on hemodialysis.
In conclusion, decline in RKF, both renal CLurea and urine volume separately, shows a graded association with higher mortality among incident hemodialysis patients. Future trials are warranted to test the clinical benefits of RKF preservation strategies, including maintaining diuretic use and the incremental hemodialysis regimen.
Concise Methods
Patients
We retrospectively extracted, refined, and examined data from all incident hemodialysis patients who were ages ≥18 years old and received hemodialysis treatment for ≥60 consecutive days in facilities operated by a large dialysis organization (DaVita, Inc.) in the United States from January 1, 2007 to December 31, 2010.39 Patients were followed until December 31, 2011, and the follow-up time was divided into patient-quarters (91-day periods from date of first dialysis). For each patient-quarter, patients were assigned the conventional hemodialysis modality if they did not receive treatments other than thrice weekly hemodialysis (i.e., peritoneal dialysis, less frequent in–center hemodialysis, home hemodialysis, frequent in–center hemodialysis, or nocturnal in–center hemodialysis) for at least 45 days within the patient-quarter.
To examine RKF and the changes during the first 1 year of hemodialysis, we used all incident in–center hemodialysis patients between 2007 and 2010 who were alive at year 1 and had measured renal CLurea at the start of dialysis and year 1. First, we excluded patients who were censored or ever treated with peritoneal dialysis, nocturnal hemodialysis, or home hemodialysis during the first 1 year of dialysis. Second, we identified 22,895 incident hemodialysis patients with baseline CLurea data from 67,311 patients who were assigned only conventional hemodialysis for the first four patient-quarters. Among them, 6538 patients also had RKF measurements at the fifth patient-quarter (i.e., the first 91-day period of the second year of dialysis) and were included in this study (details in Supplemental Figure 5). This study was approved by the Institutional Review Committees of the Los Angeles Biomedical Research Institute at Harbor–University of California, Los Angeles; the University of California, Irvine Medical Center; and the University of Washington.
Demographic, Clinical, and Laboratory Measures
The information on all-cause death, race/ethnicity, primary insurance, access type, the presence of comorbidities, and laboratory variables was obtained from the electronic database of the dialysis provider. To minimize measurement variability, all repeated measures for each patient during any given patient-quarter (91 days) were averaged, and the quarterly means in each quarter were used in all analyses. The averaged values during the first patient-quarter (the first 91 days of dialysis) served as baseline data.
Blood samples were drawn using uniform techniques in all dialysis clinics and transported to the central laboratory (Deland, FL) typically within 24 hours. All laboratory values were measured by automated and standardized methods. Most laboratory values were measured monthly, including serum urea nitrogen, creatinine, albumin, calcium, phosphorus, and bicarbonate. Serum ferritin and intact PTH were measured at least quarterly. Hemoglobin was measured at least monthly in essentially all patients and weekly to biweekly in most patients. Most blood samples were collected predialysis with the exception of the postdialysis urea, which was obtained to calculate urea kinetics.
The average serum urea concentrations during the collection were assumed to be 90% of the predialysis concentrations according to the approach by Daugirdas et al.,40 and thus, renal CLurea was calculated as follows:
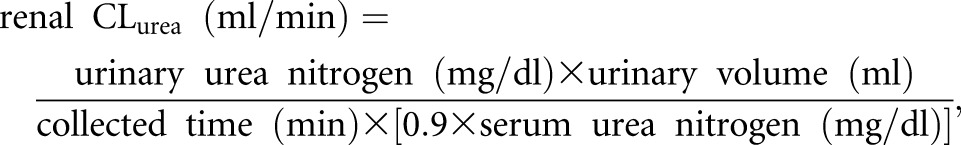 |
where serum urea nitrogen was obtained on the closest day within ±28 days to urine collection. Observations with CLurea>15 ml/min or urine volume >3000 ml/d were excluded from this study. Among the eligible 23,111 CLurea observations, urine collected time was reported as 1440 minutes in 22,716 observations (98%), ranging from 720 to 2880 minutes. Serum urea nitrogen was measured on the same day of urine collection in 22,520 (97%) patients. The differences between our calculated CLurea and CLurea reported from the large dialysis organization were within ±0.01 ml/min in 22,445 observations (97%) (Supplemental Figure 6). Renal CLurea was then adjusted for body surface area and expressed as milliliters per minute per 1.73 m2.1,41 Annual changes in renal CLurea and urine volume were calculated by subtracting values at year 1 (the fifth patient-quarter; the first 91 days of the second year of dialysis) from those at baseline (the first patient-quarter; the first 91 days of the first year of dialysis). spKt/V delivered by dialysis was calculated using urea kinetic modeling equations.42 nPCR was calculated taking renal CLurea into account.43
Statistical Analyses
Renal CLurea was used as the index of RKF in the primary analyses, and urine volume was used in the sensitivity analyses. Differences in baseline characteristics between included versus excluded patients were compared by standardized differences because of the relatively large sample size of this study.44,45 Patients were categorized into four groups according to annual change in renal CLurea (<−3.0, −3.0 to <−1.5, −1.5 to <0.0, and ≥0 ml/min per 1.73 m2) or urine volume (<−600, −600 to <−300, −300 to <0.0, and ≥0 ml/d), and the association with each patient characteristic was evaluated by nonparametric trend test. Linear regression with roust estimation was used to identify the predictors of annual change in RKF. Survival analysis with Cox regression was used to estimate association between the exposure variable (i.e., RKF at year 1 or annual change in RKF) and all-cause mortality. Annual changes in RKF (i.e., CLurea and urine volume) were modeled as continuous variables, and their relationship with all-cause death was estimated using restricted cubic spline functions with four knots at the 5th, 35th, 65th, and 95th percentiles of each index. In the primary analyses, −1.5 ml/min per 1.73 m2 and −300 ml/d were used as references for changes in CLurea and urine volume, respectively. Median values were used as references in each subgroup analysis. The first day of the fifth patient-quarter (i.e., 364th day of dialysis treatment) was used as the entry day of each patient. Proportional hazards assumptions were tested using log-log against survival plots and Schoenfeld residuals.
Models were examined with three levels of adjustment as listed below.
Unadjusted model or minimally adjusted model that included baseline RKF values.
Case mix–adjusted models that included the above plus age, sex, race, ethnicity (non-Hispanic black, non-Hispanic white, Hispanic, or other race/ethnicity), primary insurance (Medicare and others), central venous catheter use, and six comorbidities (hypertension, diabetes, presence of congestive heart failure, atherosclerotic heart disease, other cardiovascular disease, and spKt/V).
Fully adjusted models that included all of the covariates in the case mix model plus body mass index, nPCR, and nine laboratory variables (hemoglobin, serum albumin, creatinine, albumin-corrected calcium, phosphorus, iron saturation, total bicarbonate, and natural log–transformed intact PTH and ferritin).
When evaluating the association of RKF indices at 1 year after hemodialysis initiation with mortality, we used primary insurance, vascular access type, and laboratory variables obtained from the same period (i.e., the fifth patient-quarter). For analyses of the association between annual changes in RKF indices and all-cause mortality, baseline variables were used to avoid overadjustment, because those variables at year 1 may have been influenced by change in RKF (i.e., intermediaries between RKF decline and all-cause death). Additional adjustment for ultrafiltration rate at baseline and its annual change was conducted on the fully adjusted model to unfold how fluid removal may affect the RKF-mortality association.
Linear assumption among covariates was examined by using restricted spline functions and a likelihood ratio test for goodness of fit.46 For linear regression analyses where annual change in RKF was used an outcome, age, nPCR, and serum concentrations of albumin, intact PTH, and ferritin retained one or more spline functions (i.e., nonlinear association) and thus, were categorized irrespective of models as follows: five groups of age (<50, 50 to <60, 60 to <70, 70 to <80, and ≥80 years old), four groups of serum albumin (<3.2, 3.2 to <3.6, 3.6 to <4.0, and ≥4.0 g/dl), five groups of serum calcium (<8.5, 8.5 to <9.0, 9.0 to <9.5, 9.5 to <10.0, and ≥10.0 mg/dl), four groups of intact PTH (<160, 160 to <320, 320 to <640, and ≥640 pg/ml), and four groups of serum ferritin (<200, 200 to <400, 400 to <800, and ≥800 ng/ml). In the Cox regression analyses, significant spline functions were kept instead of categorizing variables and used in the multivariate models.
Effect modification of the association between annual RKF decline (i.e., >3.0 ml/min per 1.73 m2 in CLurea or >600 ml/d in urine volume) and all-cause death by baseline age (≥65 or <65 years old), sex, race (white or nonwhite), diabetes, presence of congestive heart failure, hemoglobin (≥11.5 or <11.5 g/dl), serum albumin (≥3.6 or <3.6 g/dl), and serum phosphorus (≥5.0 or <5.0 mg/dl) were examined by including each interaction term into case mix adjustment models. The frequency of missing data was low (<1% for most laboratory tests, except for nPCR [4%] and creatinine [4%]), and the multiple imputation method with five datasets was used in all regression analyses. Analyses were conducted using STATA MP, version 13.1 (StataCorp, College Station, TX) and SAS, version 9.4 (SAS Institute Inc., Cary, NC).
Disclosures
C.P.K. has received honoraria from Sanofi-Aventis, Relypsa, and ZS Pharma (Coppell, TX). K.K.-Z. has received honoraria and/or support from Abbott Laboratories (Alameda, CA); Abbvie; Alexion; Amgen, Inc. (Thousand Oaks, CA); the American Society of Nephrology; AstraZeneca Pharmaceuticals (Wilmington, DE); AVEO; Chugai Pharmaceutical Co (Tokyo, Japan); DaVita, Inc.; Fresenius; Genetech; Haymarket Media; Hospira; Kabi; Keryx; the National Institutes of Health; the National Kidney Foundation; Relypsa; Resverlogix; Sanofi US (Bridgewater, NJ); Shire; Vifor; and ZS Pharma.
Supplementary Material
Acknowledgments
We thank DaVita Clinical Research for providing the clinical data for this research.
The work for this manuscript was performed with the support of National Institute of Diabetes, Digestive and Kidney Disease of the National Institutes of Health research grants R01DK95668 (to R.M. and K.K.-Z.), K24DK091419 (to K.K.-Z.), and R01DK078106 (to K.K.-Z.). Y.O. was supported by the Shinya Foundation for International Exchange of Osaka University Graduate School of Medicine grant. C.M.R. is supported by National Institute of Diabetes, Digestive and Kidney Disease grant K23DK102903. C.P.K. is supported by National Institute of Diabetes, Digestive and Kidney Disease grants R01DK096920 and U01DK102163. K.K.-Z. is supported by philanthropic grants from Mr. Harold Simmons, Mr. Louis Chang, Mr. Joseph Lee, and AVEO.
Footnotes
Published online ahead of print. Publication date available at www.jasn.org.
See related editorial, “Preserving Residual Kidney Function in Hemodialysis Patients—Back in the Spotlight,” on pages 3504–3507.
This article contains supplemental material online at http://jasn.asnjournals.org/lookup/suppl/doi:10.1681/ASN.2015101142/-/DCSupplemental.
References
- 1.Anonymous: Clinical practice recommendations for peritoneal dialysis adequacy. Am J Kidney Dis 48[Suppl 1]: S130–S158, 2006 [DOI] [PubMed] [Google Scholar]
- 2.Hemodialysis Adequacy 2006 Work Group : Clinical practice guidelines for hemodialysis adequacy, update 2006. Am J Kidney Dis 48[Suppl 1]: S2–S90, 2006 [DOI] [PubMed] [Google Scholar]
- 3.Cheung AK, Rocco MV, Yan G, Leypoldt JK, Levin NW, Greene T, Agodoa L, Bailey J, Beck GJ, Clark W, Levey AS, Ornt DB, Schulman G, Schwab S, Teehan B, Eknoyan G: Serum beta-2 microglobulin levels predict mortality in dialysis patients: Results of the HEMO study. J Am Soc Nephrol 17: 546–555, 2006 [DOI] [PubMed] [Google Scholar]
- 4.Marquez IO, Tambra S, Luo FY, Li Y, Plummer NS, Hostetter TH, Meyer TW: Contribution of residual function to removal of protein-bound solutes in hemodialysis. Clin J Am Soc Nephrol 6: 290–296, 2011 [DOI] [PMC free article] [PubMed] [Google Scholar]
- 5.Bargman JM, Thorpe KE, Churchill DN; CANUSA Peritoneal Dialysis Study Group : Relative contribution of residual renal function and peritoneal clearance to adequacy of dialysis: A reanalysis of the CANUSA study. J Am Soc Nephrol 12: 2158–2162, 2001 [DOI] [PubMed] [Google Scholar]
- 6.Szeto CC, Wong TY, Chow KM, Leung CB, Law MC, Li PK: Independent effects of renal and peritoneal clearances on the mortality of peritoneal dialysis patients. Perit Dial Int 24: 58–64, 2004 [PubMed] [Google Scholar]
- 7.Termorshuizen F, Dekker FW, van Manen JG, Korevaar JC, Boeschoten EW, Krediet RT; NECOSAD Study Group : Relative contribution of residual renal function and different measures of adequacy to survival in hemodialysis patients: An analysis of the Netherlands Cooperative Study on the Adequacy of Dialysis (NECOSAD)-2. J Am Soc Nephrol 15: 1061–1070, 2004 [DOI] [PubMed] [Google Scholar]
- 8.Vilar E, Wellsted D, Chandna SM, Greenwood RN, Farrington K: Residual renal function improves outcome in incremental haemodialysis despite reduced dialysis dose. Nephrol Dial Transplant 24: 2502–2510, 2009 [DOI] [PubMed] [Google Scholar]
- 9.Moist LM, Port FK, Orzol SM, Young EW, Ostbye T, Wolfe RA, Hulbert-Shearon T, Jones CA, Bloembergen WE: Predictors of loss of residual renal function among new dialysis patients. J Am Soc Nephrol 11: 556–564, 2000 [DOI] [PubMed] [Google Scholar]
- 10.Shafi T, Jaar BG, Plantinga LC, Fink NE, Sadler JH, Parekh RS, Powe NR, Coresh J: Association of residual urine output with mortality, quality of life, and inflammation in incident hemodialysis patients: The Choices for Healthy Outcomes in Caring for End-Stage Renal Disease (CHOICE) Study. Am J Kidney Dis 56: 348–358, 2010 [DOI] [PMC free article] [PubMed] [Google Scholar]
- 11.Penne EL, van der Weerd NC, Grooteman MP, Mazairac AH, van den Dorpel MA, Nubé MJ, Bots ML, Lévesque R, ter Wee PM, Blankestijn PJ; CONTRAST investigators : Role of residual renal function in phosphate control and anemia management in chronic hemodialysis patients. Clin J Am Soc Nephrol 6: 281–289, 2011 [DOI] [PMC free article] [PubMed] [Google Scholar]
- 12.Mathew A, Fishbane S, Obi Y, Kalantar-Zadeh K: Preservation of residual kidney function in hemodialysis patients: Reviving an old concept for contemporary practice. Kidney Int 2016, in press [DOI] [PMC free article] [PubMed] [Google Scholar]
- 13.US Renal Data System : USRDS 2013 Annual Data Report: Atlas of Chronic Kidney Disease and End-Stage Renal Disease in the United States, Bethesda, MD, National Institutes of Health, National Institute of Diabetes and Digestive and Kidney Diseases, 2013 [Google Scholar]
- 14.O’Hare AM, Wong SP, Yu MK, Wynar B, Perkins M, Liu CF, Lemon JM, Hebert PL: Trends in the timing and clinical context of maintenance dialysis initiation. J Am Soc Nephrol 26: 1975–1981, 2015 [DOI] [PMC free article] [PubMed] [Google Scholar]
- 15.Van Stone JC: The effect of dialyzer membrane and etiology of kidney disease on the preservation of residual renal function in chronic hemodialysis patients. ASAIO J 41: M713–M716, 1995 [DOI] [PubMed] [Google Scholar]
- 16.Hartmann J, Fricke H, Schiffl H: Biocompatible membranes preserve residual renal function in patients undergoing regular hemodialysis. Am J Kidney Dis 30: 366–373, 1997 [DOI] [PubMed] [Google Scholar]
- 17.McKane W, Chandna SM, Tattersall JE, Greenwood RN, Farrington K: Identical decline of residual renal function in high-flux biocompatible hemodialysis and CAPD. Kidney Int 61: 256–265, 2002 [DOI] [PubMed] [Google Scholar]
- 18.Centers for Medicare & Medicaid Services (CMS), HHS : Medicare program; End-stage renal disease prospective payment system, quality incentive program, and durable medical equipment, prosthetics, orthotics, and supplies. Final rule. Fed Regist 79: 66119–66265, 2014 [PubMed] [Google Scholar]
- 19.Kalantar-Zadeh K, Unruh M, Zager PG, Kovesdy CP, Bargman JM, Chen J, Sankarasubbaiyan S, Shah G, Golper T, Sherman RA, Goldfarb DS: Twice-weekly and incremental hemodialysis treatment for initiation of kidney replacement therapy. Am J Kidney Dis 64: 181–186, 2014 [DOI] [PMC free article] [PubMed] [Google Scholar]
- 20.Obi Y, Eriguchi R, Ou SM, Rhee CM, Kalantar-Zadeh K: What is known and unknown about twice-weekly hemodialysis. Blood Purif 40: 298–305, 2015 [DOI] [PMC free article] [PubMed] [Google Scholar]
- 21.Obi Y, Streja E, Rhee CM, Ravel V, Amin AN, Cupisti A, Chen J, Mathew AT, Kovesdy CP, Mehrotra R, Kalantar-Zadeh K: Incremental hemodialysis, residual kidney function, and mortality risk in incident dialysis patients: A cohort study [published online ahead of print February 8, 2016]. Am J Kidney Dis doi:10.1053/j.ajkd.2016.01.008 [DOI] [PMC free article] [PubMed] [Google Scholar]
- 22.van der Wal WM, Noordzij M, Dekker FW, Boeschoten EW, Krediet RT, Korevaar JC, Geskus RB; Netherlands Cooperative Study on the Adequacy of Dialysis Study Group (NECOSAD) : Full loss of residual renal function causes higher mortality in dialysis patients; findings from a marginal structural model. Nephrol Dial Transplant 26: 2978–2983, 2011 [DOI] [PubMed] [Google Scholar]
- 23.Lu YH, Hwang JC, Jiang MY, Wang CT: Comparison of the impact of “fast decline” in residual renal function and “initial anuria” on long-term outcomes in CAPD patients. Perit Dial Int 35: 172–179, 2015 [DOI] [PMC free article] [PubMed] [Google Scholar]
- 24.Itoh Y, Fujikawa T, Toya Y, Mitsuhashi H, Kobayashi N, Ohnishi T, Tamura K, Hirawa N, Yasuda G, Umemura S: Effect of renin-angiotensin system inhibitor on residual glomerular filtration rate in hemodialysis patients. Ther Apher Dial 16: 554–559, 2012 [DOI] [PubMed] [Google Scholar]
- 25.Kjaergaard KD, Peters CD, Jespersen B, Tietze IN, Madsen JK, Pedersen BB, Novosel MK, Laursen KS, Bibby BM, Strandhave C, Jensen JD: Angiotensin blockade and progressive loss of kidney function in hemodialysis patients: A randomized controlled trial. Am J Kidney Dis 64: 892–901, 2014 [DOI] [PubMed] [Google Scholar]
- 26.Liu S, Diao Z, Zhang D, Ding J, Cui W, Liu W: Preservation of residual renal function by not removing water in new hemodialysis patients: A randomized, controlled study. Int Urol Nephrol 46: 83–90, 2014 [DOI] [PubMed] [Google Scholar]
- 27.Jansen MA, Hart AA, Korevaar JC, Dekker FW, Boeschoten EW, Krediet RT; NECOSAD Study Group : Predictors of the rate of decline of residual renal function in incident dialysis patients. Kidney Int 62: 1046–1053, 2002 [DOI] [PubMed] [Google Scholar]
- 28.Schiffl H, Lang SM, Fischer R: Ultrapure dialysis fluid slows loss of residual renal function in new dialysis patients. Nephrol Dial Transplant 17: 1814–1818, 2002 [DOI] [PubMed] [Google Scholar]
- 29.Penne EL, van der Weerd NC, van den Dorpel MA, Grooteman MP, Lévesque R, Nubé MJ, Bots ML, Blankestijn PJ, ter Wee PM; CONTRAST Investigators : Short-term effects of online hemodiafiltration on phosphate control: A result from the randomized controlled Convective Transport Study (CONTRAST). Am J Kidney Dis 55: 77–87, 2010 [DOI] [PubMed] [Google Scholar]
- 30.Schiffl H, Lang SM, Fischer R: Effects of high efficiency post-dilution on-line hemodiafiltration or conventional hemodialysis on residual renal function and left ventricular hypertrophy. Int Urol Nephrol 45: 1389–1396, 2013 [DOI] [PubMed] [Google Scholar]
- 31.Bragg-Gresham JL, Fissell RB, Mason NA, Bailie GR, Gillespie BW, Wizemann V, Cruz JM, Akiba T, Kurokawa K, Ramirez S, Young EW: Diuretic use, residual renal function, and mortality among hemodialysis patients in the Dialysis Outcomes and Practice Pattern Study (DOPPS). Am J Kidney Dis 49: 426–431, 2007 [DOI] [PubMed] [Google Scholar]
- 32.Lemes HP, Araujo S, Nascimento D, Cunha D, Garcia C, Queiroz V, Ferreira-Filho SR: Use of small doses of furosemide in chronic kidney disease patients with residual renal function undergoing hemodialysis. Clin Exp Nephrol 15: 554–559, 2011 [DOI] [PubMed] [Google Scholar]
- 33.Zhang M, Wang M, Li H, Yu P, Yuan L, Hao C, Chen J, Kalantar-Zadeh K: Association of initial twice-weekly hemodialysis treatment with preservation of residual kidney function in ESRD patients. Am J Nephrol 40: 140–150, 2014 [DOI] [PubMed] [Google Scholar]
- 34.Rhee CM, Unruh M, Chen J, Kovesdy CP, Zager P, Kalantar-Zadeh K: Infrequent dialysis: A new paradigm for hemodialysis initiation. Semin Dial 26: 720–727, 2013 [DOI] [PMC free article] [PubMed] [Google Scholar]
- 35.Kalantar-Zadeh K, Casino FG: Let us give twice-weekly hemodialysis a chance: Revisiting the taboo. Nephrol Dial Transplant 29: 1618–1620, 2014 [DOI] [PMC free article] [PubMed] [Google Scholar]
- 36.US Renal Data System : USRDS 2015 Annual Data Report: Atlas of Chronic Kidney Disease and End-Stage Renal Disease in the United States, Bethesda, MD, National Institutes of Health, National Institute of Diabetes and Digestive and Kidney Diseases, 2015 [Google Scholar]
- 37.Mohan S, Huff E, Wish J, Lilly M, Chen SC, McClellan WM; Fistula First Breakthrough Initiative Data Committee : Recovery of renal function among ESRD patients in the US medicare program. PLoS One 8: e83447, 2013 [DOI] [PMC free article] [PubMed] [Google Scholar]
- 38.Hill AB: The environment and disease: Association or causation? Proc R Soc Med 58: 295–300, 1965 [PMC free article] [PubMed] [Google Scholar]
- 39.Kuttykrishnan S, Kalantar-Zadeh K, Arah OA, Cheung AK, Brunelli S, Heagerty PJ, Katz R, Molnar MZ, Nissenson A, Ravel V, Streja E, Himmelfarb J, Mehrotra R: Predictors of treatment with dialysis modalities in observational studies for comparative effectiveness research. Nephrol Dial Transplant 30: 1208–1217, 2015 [DOI] [PMC free article] [PubMed] [Google Scholar]
- 40.Daugirdas JT: Physiologic Principles and Urea Kinetic Modeling. In Handbook of Dialysis,edited by Daugirdas JT, Blake PG, Ing TS, 5th Ed., Philadelphia, Lippincott Williams & Wilkins, 2014, pp 59–60 [Google Scholar]
- 41.Mosteller RD: Simplified calculation of body-surface area. N Engl J Med 317: 1098, 1987 [DOI] [PubMed] [Google Scholar]
- 42.Daugirdas JT, Leypoldt JK, Akonur A, Greene T, Depner TA; FHN Trial Group : Improved equation for estimating single-pool Kt/V at higher dialysis frequencies. Nephrol Dial Transplant 28: 2156–2160, 2013 [DOI] [PMC free article] [PubMed] [Google Scholar]
- 43.Depner TA, Daugirdas JT: Equations for normalized protein catabolic rate based on two-point modeling of hemodialysis urea kinetics. J Am Soc Nephrol 7: 780–785, 1996 [DOI] [PubMed] [Google Scholar]
- 44.Austin PC: Balance diagnostics for comparing the distribution of baseline covariates between treatment groups in propensity-score matched samples. Stat Med 28: 3083–3107, 2009 [DOI] [PMC free article] [PubMed] [Google Scholar]
- 45.Schacht A, Bogaerts K, Bluhmki E, Lesaffre E: A new nonparametric approach for baseline covariate adjustment for two-group comparative studies. Biometrics 64: 1110–1116, 2008 [DOI] [PubMed] [Google Scholar]
- 46.Royston P, Sauerbrei W, Freiburg G: Multivariable modeling with cubic regression splines: A principled approach. Stata J 7: 45–70, 2007 [Google Scholar]
Associated Data
This section collects any data citations, data availability statements, or supplementary materials included in this article.