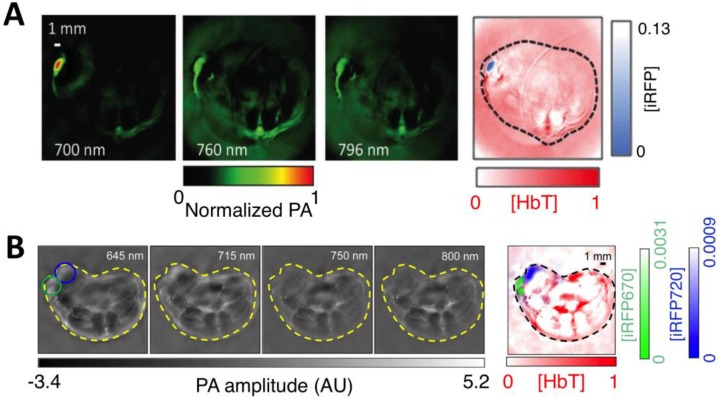
Figure 13.
In vivo PA imaging of tumors expressing iRFP. (A) PA images of mammary gland tumor expressing iRFP713. The three images on the left were acquired at different wavelengths as indicated in the figure; the right-most image is a spectrally separated image with the iRFP713 signal in blue and the blood signal in red. (B) PA images of two different tumors labeled with iRFP670 and iRFP720. The four images on the left were acquired at different wavelengths as indicated in the figure; the right-most image is the spectrally separated image with the iRFP720 signal in blue, the iRFP670 signal in green, and the blood signal in red. Figure adapted with permission from 83.

