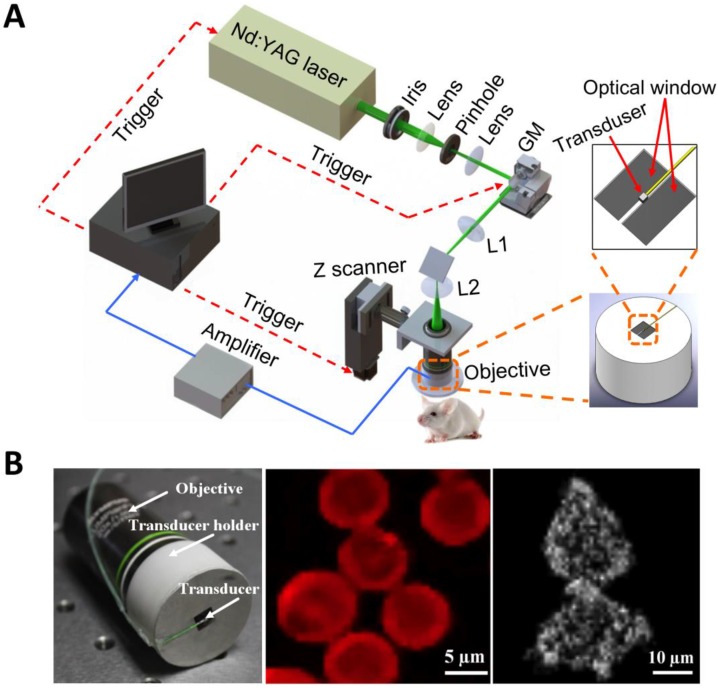
Figure 3.
Sub-wavelength resolution OR-PAM imaging of single cells ex vivo. (A) Schematic diagram of the reflection-mode sub-wavelength resolution PAM system. GM: galvanometer scanner; L1: scan lens; L2: tube lens. (B) Photograph of the PA signal detection probe (left); sub-wavelength resolution PA image of red blood cells (middle) and melanoma cells (right). Figure adapted with permission from 17.

