

Abstract
N-methyl-d-aspartate receptors (NMDARs) are ionotropic glutamatergic receptors that have been implicated in learning, development, and neuropathological conditions. They are typically composed of GluN1 and GluN2A-D subunits. Whereas a great deal is known about the role of GluN2A- and GluN2B-containing NMDARs, much less is known about GluN2D-containing NMDARs. Here we explore the subunit composition of synaptic NMDARs on hippocampal interneurons. GluN2D mRNA was detected by single-cell PCR and in situ hybridization in diverse interneuron subtypes in the CA1 region of the hippocampus. The GluN2D subunit was detectable by immunoblotting and immunohistochemistry in all subfields of the hippocampus in young and adult mice. In whole-cell patch-clamp recordings from acute hippocampal slices, (+)-CIQ, the active enantiomer of the positive allosteric modulator CIQ, significantly enhanced the amplitude of the NMDAR component of miniature excitatory postsynaptic currents (mEPSCs) in CA1 interneurons but not in pyramidal cells. (+)-CIQ had no effect in slices from Grin2d−/− mice, suggesting that GluN2D-containing NMDARs participate in excitatory synaptic transmission onto hippocampal interneurons. The time course of the NMDAR component of the mEPSC was unaffected by (+)-CIQ potentiation and was not accelerated in slices from Grin2d−/− mice compared with wild-type, suggesting that GluN2D does not detectably slow the NMDAR EPSC time course at this age. (+)-CIQ increased the activity of CA1 interneurons as detected by the rate and net charge transfer of spontaneous inhibitory postsynaptic currents (sIPSCs) recorded from CA1 pyramidal cells. These data provide evidence that interneurons contain synaptic NMDARs possessing a GluN2D subunit, which can influence interneuron function and signal processing.
Introduction
N-methyl-d-aspartate receptors (NMDARs) are tetrameric assemblies comprising GluN1 and GluN2 subunits. Whereas GluN3 subunits can be incorporated into NMDARs, our understanding of their role remains incomplete. Four independent genes (Grin2a, Grin2b, Grin2c, and Grin2d) encode GluN2A-D subunits, which have distinct spatial and developmental expression patterns (Traynelis et al., 2010). Among the GluN2 subunits, little is known about the role of GluN2D in brain function, even though anatomic studies have suggested that it is expressed in many cell types, such as hippocampal interneurons (Akazawa et al., 1994; Monyer et al., 1994; von Engelhardt et al., 2015). Receptor pharmacology has been studied extensively in heterologous expression systems. Incorporation of the various GluN2 subunits into NMDARs confers strikingly different functional properties to the receptors, with GluN1/GluN2D receptors showing an unusually slow deactivation and low open probability (Monyer et al., 1994; Vicini et al., 1998; Vance et al., 2012, 2013; Wyllie et al., 2013). Given that the deactivation time course after removal of glutamate controls the time course of the NMDAR-mediated component of the excitatory postsynaptic current (EPSC) (Lester et al., 1990), the presence of GluN2D-containing receptors might alter the signal processing by changing the time course of the composite excitatory synaptic current. GluN1/GluN2D receptors also show reduced Ca2+ permeability and reduced Mg2+ sensitivity (Clarke and Johnson, 2006; Retchless et al., 2012), suggesting that inclusion of this subunit into synaptic receptors may alter synaptic signaling in multiple ways.
NMDARs have been implicated in a number of neurologic processes and disorders. Accordingly, this receptor class has been the focus of intense study as a potential target for the treatment of a wide range of neuropathologies including Alzheimer disease, depression, epilepsy, Parkinson disease, schizophrenia, and traumatic brain injury (Choi, 1992; Palmer, 2001; Coyle et al., 2003; Hallett and Standaert, 2004; Preskorn et al., 2008; Coyle, 2012; Preskorn et al., 2015; Yuan et al., 2015). Expression of different GluN2 subunits in different cells and nuclei (Akazawa et al., 1994; Monyer et al., 1994, Standaert et al., 1994, 1996) may provide an opportunity to selectively target specific circuits using subunit-selective modulators. This approach should allow for enhanced efficacy and greater safety for new therapeutic strategies by restricting actions of drugs to the brain regions and synapses involved in the pathology. Whereas GluN2A and GluN2B receptors are expressed in principal cells, a number of studies suggest that GluN2D is expressed in cortical and hippocampal interneurons (Monyer et al., 1994; Landwehrmeyer et al., 1995; Rudolf et al., 1996; Thompson et al., 2002), which should confer unique circuit properties in these regions. Here we evaluate the role of GluN2D in hippocampal interneuron function using genetic, anatomic, pharmacologic, and functional experiments.
We previously described a series of GluN2C/GluN2D-selective positive allosteric modulators (PAMs) exemplified by the prototypical chiral compound CIQ (Mullasseril et al., 2010; Santangelo Freel et al., 2013, 2014). This pharmacologic tool was used to evaluate subunit composition of NMDAR-mediated EPSCs onto spinal and subthalamic neurons (Hildebrand et al., 2014; Swanger et al., 2015). Here, we describe in detail the properties and selectivity of the active enantiomer (+)-CIQ and several closely related analogs. We subsequently use (+)-CIQ to assess the subunit composition of the synaptic NMDARs in CA1 hippocampal interneurons. Our anatomic and functional data suggest that GluN2D is expressed in hippocampal interneurons, participates in synaptic transmission, and can increase the activity of these inhibitory interneurons.
Materials and Methods
Molecular Biology.
All procedures using animals were reviewed and approved by the Institutional Animal Care and Use Committee of Emory University or National Institute of Child Health and Human Development. cDNAs for rat wild-type NMDAR subunits GluN1-1a (GenBank U11418, U08261; hereafter GluN1), GluN2A (D13211), GluN2B (U11419), GluN2C (M91563), and GluN2D (L31611), modified as described (Monyer et al., 1994), GluA1 (X17184), and GluK2 (Z11548) were provided by Drs. S. Heinemann (Salk Institute), S. Nakanishi (Kyoto University), and P. Seeburg (University of Heidelberg). Plasmids containing the genes for the GABAA (α1β2γ2s), GABAC (ρ1), glycine (α1), serotonin (5-HT3A), nicotinic acetylcholine receptor (nAChR; α1β1δγ, α2β4, α4β3, α9α10), and purinergic (P2X2 rat, P2X2 human) receptors were provided by Drs. Heinemann (Salk), Weiss (University of Texas, San Antonio), Papke (University of Florida), and Hume (University of Michigan). For expression in Xenopus laevis oocytes, cDNA constructs were linearized by restriction endonuclease digestion, purified using the QIAquick PCR Purification Kit (Qiagen, North Rhine-Westphalia, Germany) and used as templates to transcribe cRNAs using the mMessage mMachine kit (ThermoFisher Scientific, Tewksbury, MA) following the manufacturer’s protocol.
Two-Electrode Voltage-Clamp Recordings from X. laevis.
X. laevis stage VI oocytes (Ecocyte Biosciences, Austin, TX) were isolated as previously described (Hansen et al., 2013) and injected with 50 nl of water containing 5–10 ng of cRNA encoding the GluN1 and GluN2 NMDAR subunits (3:7 ratio). Oocytes were stored at 15°C in media containing (in mM) 88 NaCl, 2.4 NaHCO3, 1 KCl, 0.33 Ca(NO3)2, 0.41 CaCl2, 0.82 MgSO4, 5 Tris-HCl (pH was adjusted to 7.4 with NaOH), 1 U/ml penicillin, 0.1 mg/ml gentamicin sulfate, and 1 μg/ml streptomycin. Two to seven days after injection, two-electrode voltage-clamp recordings were performed at room temperature. All extracellular solutions contained (in mM) 90 NaCl, 1 KCl, 10 HEPES, 0.5 BaCl2, and 0.01 EDTA (pH 7.4 with NaOH). Gravity-applied solutions (4 to 5 ml/min) were exchanged by an eight-port Modular Valve Positioner (Hamilton Company, Reno, NV) and controlled by custom software. Voltage and current electrodes were filled with 0.3 M and 3.0 M KCl, respectively. Oocyte currents were recorded at a holding potential of −40 mV and recorded by a two-electrode voltage-clamp amplifier (OC-725B or C; Warner Instruments, Hamden, CT).
(+)-CIQ and related analog stocks were prepared as a 20 mM solution in dimethylsulfoxide (DMSO), and working solutions were prepared during rapid stirring immediately before the experiment. For concentration-response curve recordings, 1-5 mM 2-(hydroxypropyl)-β-cyclodextrin was used to increase the solubility of modulators and subsequently added to all agonist solutions to control for any direct effects. Unless indicated otherwise, current responses were elicited by application of 100 μM glutamate plus 30 μM glycine. Currents from the GluA1 and GluK2 receptors were evoked with 100 μM glutamate; oocytes expressing GluK2 were soaked in 10 μM concanavalin-A for 5 minute prior to recording. Currents were evoked for the following receptors using the agonist concentrations indicated: GABAC ρ1 (2 μM GABA), GABAA α1β2γ2 (20 μM GABA), glycine α1 (50 μM glycine), 5-HT3A (15 μM serotonin), nicotinic acetylcholine α1β1δγ (20 μM acetylcholine), α4β2 (1 μM acetylcholine), α7 (100 or 300 μM acetylcholine), and the P2X2 receptor (9 μM ATP).
Electrophysiological Recordings of Hippocampal Interneurons.
Horizontal hippocampal brain slices (300 µm) were made from C57Bl/6 mice (post-natal day 7-14 or P7-14, unless otherwise stated) using a vibratome (TPI, St. Louis, MO). During preparation, the slices were bathed in ice-cold (0-2°C) artificial cerebral spinal fluid (slicing-aCSF containing in mM, 75 NaCl, 2.5 KCl, 1.25 NaH2PO4, 25 NaHCO3, 5 MgCl2 or MgSO4, 0.5 CaCl2, 20 glucose, 70 sucrose, and bubbled with 95% O2/5% CO2; Supplemental Table S1). After preparation, slices were allowed to recover for 1 hour at 37°C before use in experimentation. For single-cell RT-PCR analysis of interneuron mRNA (from C57BL/6 mice P14-21), slices were transferred to a recording chamber and perfused with the RT-PCR-aCSF (containing in mM, 130 NaCl, 24 NaHCO3, 3.5 KCl, 1.25 NaH2PO4, 2.5 CaCl2, 1.5 MgCl2, 10 glucose, bubbled with 95% O2/5% CO2, and pH 7.4; Supplemental Table S1) and supplemented with 0.01 mM bicuculline methobromide. Recording electrodes were filled with the RT-PCR-internal solution (containing in mM, 130 K-gluconate, 10 KCl, 0.6 EGTA, 10 HEPES, 2 MgCl2, 2 Na-ATP, 0.3 Na-GTP, and pH 7.2–7.3, Supplemental Table S2) and supplemented with 0.1% biocytin. Hippocampal interneurons were recorded in current-clamp mode to assay basic membrane properties and firing patterns in response to a series of square wave current injections (+/− 200 pA). At the end of the recording period the cell cytoplasm was aspirated into the recording electrode, an outside-out patch was obtained, and the pipette contents were subsequently expelled into a test tube for single-cell RT-PCR processing as described below.
Whole-cell voltage-clamp recordings of miniature EPSCs (mEPSCs) were made using the mEPSC-aCSF (containing in mM, 130 NaCl, 2.5 KCl, 1.25 NaH2PO4, 25 NaHCO3, 0.1 MgCl2 or MgSO4, 2.5 CaCl2, and 20 glucose, Supplemental Table S1) supplemented with 0.01 mM bicuculline methobromide or gabazine and 0.5 μM tetrodotoxin (TTX). Patch recording electrodes were filled with the mEPSC-internal solution (containing in mM, 110 Cs-gluconate, 30 CsCl, 5 HEPES, 4 NaCl, 0.5 CaCl2, 2 MgCl2, 5 BAPTA, 2 Na-ATP, 0.3 Na-GTP, Supplemental Table S2) supplemented with 1 mM QX-314 and 0.1% biocytin (pH 7.35, 285-295 mOsm). The bath temperature was maintained at 29-32°C throughout the experiment using an in-line solution heater and a bath chamber heating element (Warner Instruments). Thin-walled borosilicate glass (1.5-mm outer, 1.12-mm inner diameter, WPI Inc., Sarasota, FL) was used to fabricate recording electrodes (3–5 MΩ), which were positioned using a micromanipulator (Luigs and Neumann, North Rhine-Westphalia, Germany) for whole-cell patch-clamp recording; currents were recorded using an Axopatch 1D, filtered at 1 kHz (−3 dB), and digitized at 2 kHz by a Digidata 1440A for analysis off line (Molecular Devices, Sunnyvale, CA). To minimize uncontrolled voltage-gated receptor activation when changing the membrane holding potential during an experiment, the holding potential was slowly altered at a rate less than 4 mV/s. For experiments testing the effects of (+)-CIQ on mEPSC properties, slices were first equilibrated with aCSF supplemented with the GABAA receptor antagonist gabazine (10 μM) and containing reduced Mg2+ (0.1 mM). Following equilibration, mEPSCs were recorded 3-6 minutes to determine the baseline properties. We subsequently recorded with either a vehicle solution of the same composition or a solution that contained 10 μM (+)-CIQ. (+)-CIQ solutions were made from 20 mM DMSO stock and mixed immediately before the switch in perfusion; an equivalent amount of DMSO was added to the vehicle recording solution (Fig. 5A). We subsequently switched to aCSF supplemented with the NMDAR-selective competitive antagonist APV (200 µM) to confirm that the slow component we recorded was mediated by NMDARs, followed by a switch to aCSF supplemented with both APV and DNQX (10 µM) to confirm that the mEPSCs we analyzed arose from α-amino-3-hydroxy-5-methyl-4-isoxazolepropionic acid (AMPA) receptors; no mEPSCs could be detected in the presence of DNQX. The tubing and chamber were washed with ethanol followed by an extensive aCSF rinse between recordings from each cell to remove any residual (+)-CIQ from tubing and slice-chamber.
Fig. 5.

(+)-CIQ potentiates NMDAR currents in hippocampal CA1 stratum radiatum interneurons but not CA1 pyramidal neuron or in Grin2d−/− interneurons from P7-14 mice. (A) The average composite mEPSC response from each phase of the mEPSC experiment is shown. (B) Composite APV difference current reveals the NMDAR component of the mEPSC waveform. (C) The AMPAR amplitudes are shown for WT interneurons before and during (+)-CIQ application. (D) The measured mean NMDAR responses are shown for WT interneurons before and during (+)-CIQ application. (E) The measured mean NMDAR responses from WT interneurons before and during application of vehicle. (F) The measured mean NMDAR responses are shown from WT pyramidal cell (+)-CIQ recordings. (G) The measured mean NMDAR responses are shown from Grin2d−/− interneurons before and during (+)-CIQ application. *P < 0.05 by Dunnett’s test. 10 µM (+)-CIQ, 200 µM APV.
For whole-cell patch-clamp recordings of evoked EPSCs, hippocampal slices (300-350 µm thick) were prepared from P14-21 C57BL/6 mice as previously described (Pelkey et al., 2005, 2006). This age was chosen to match the single cell PCR studies, which were performed at the same time. After recovery, slices were transferred to a recording chamber and perfused with the EPSC-aCSF extracellular solution (containing in mM, 130 NaCl, 24 NaHCO3, 3.5 KCl, 1.25 NaH2PO4, 2.5 CaCl2, 1.5 MgCl2, 10 glucose; Supplemental Table S1) and supplemented with 0.01 mM bicuculline methobromide. Diverse interneurons throughout the hippocampus were visually identified with IR/DIC videomicroscopy and targeted for whole-cell recordings (MultiClamp 700A amplifier; Molecular Devices) in voltage-clamp mode using electrodes (3–5 MΩ) pulled from borosilicate glass filled with the EPSC-internal solution (containing in mM, 100 Cs-gluconate, 5 CsCl, 0.6 EGTA, 5 BAPTA, 5 MgCl2, 8 NaCl, 2 Na-ATP, 0.3 Na-GTP, 40 HEPES; Supplemental Table S2) supplemented with 0.1 mM spermine, and 1 mM QX-314 (pH 7.2–7.3, 290–300 mOsm). EPSCs were evoked at 0.2 Hz by low-intensity stimulation (150 μs/10–30 μA) via a constant current isolation unit (A360, WPI Inc.) connected to a patch electrode filled with oxygenated extracellular solution. The stimulating electrode was placed within 50–100 µm of the recorded cell. Stable dual component (AMPAR/NMDAR) synaptic responses were obtained at a holding potential of −60 mV. Slices were perfused with DNQX (20 µM), and the holding potential was changed to +50 mV to relieve Mg2+ block and record the pharmacologically isolated NMDAR component of evoked EPSCs. In some experiments, EPSCs were evoked by paired current stimulation of the Schaffer collaterals (200 ms interval) to monitor the EPSC paired-pulse ratio as a metric of presynaptic function. Data were filtered at 3.0 kHz and acquired at 20 kHz for analysis off-line with pClamp 9.0 software (Molecular Devices).
For whole-cell voltage-clamp recordings of sIPSCs, recordings were performed using the sIPSC-aCSF (containing in mM, 130 NaCl, 2.5 KCl, 1.25 NaH2PO4, 25 NaHCO3, 1.0 MgCl2, 2.0 CaCl2, and 20 glucose, Supplemental Table S1) using patch recording electrodes filled with the same internal solution used for recording mEPSC (Supplemental Table S2), supplemented with 1 mM QX-314 and 0.1% biocytin (pH 7.35, 285–295 mOsm). GABAAR-mediated currents were isolated by performing recordings at the reversal potential for EPSCs, which in these recording solutions was +10 mV.
Intracellular recording solutions for electrophysiology and single-cell PCR experiments contained biocytin (0.1%–0.2%), which allowed for anatomic reconstruction after conclusion of the experiment. Biocytin-filled cells were stained with Alexa dye-conjugated avidin (Molecular Probes/Invitrogen, Carlsbad, CA). Slices were fixed in 4% paraformaldehyde in phosphate-buffered saline (PBS) for 12 to 60 hours at 4°C and then rinsed twice with PBS and maintained in PBS until further processing. Slices were resectioned, mounted on slides, and imaged as previously reported (Matta et al., 2013). Neurons were classified by their cell-body localization as well as dendritic and axonal arborization.
Miniature EPSC Detection and Analysis.
Minianalysis (Synaptosoft, Decatur, GA) was used to detect mEPSCs using amplitude and integral threshold cutoffs. Recordings were filtered using a 250-Hz low-pass Butterworth filter only for detection purposes. For the detection of composite AMPAR/NMDAR-mediated currents while holding the membrane voltage at –60 mV, an amplitude threshold from 8–12 pA and an area of 40 fC were used to identify mEPSCs, which were aligned on the time of the peak of the response. Amplitude threshold was selected based on the variance (>3 times the standard deviation of a stretch of recording with no mEPSCs) of the control recording in each experiment. An amplitude threshold of 8 pA and an area of 80 fC were used to detect NMDAR-mediated spontaneous synaptic currents at a holding voltage at +40 mV. The same detection parameters were used throughout analysis of each data set from every experiment. Each detected current was evaluated for synaptic-like shape (rapid 10–90 rise <2 ms, an exponential decay) and rejected if there was a second mEPSC or any nonsynaptic recording artifact present during the mEPSC. After detection of mEPSCs, the original recorded mEPSC (digitized at 2 kHz) was aligned on the rising phase of the response and the time course averaged. The experimenter was blinded to the identity of the recording group while analyzing mEPSCs. mEPSCs selected for inclusion were further analyzed using custom written Matlab scripts to determine mEPSC peak amplitude, decay-time constants, and the amplitude of the NMDAR-component of the mEPSC. The deactivation time course for the rapid (AMPAR) and slower (NMDAR) components of the mEPSC were evaluated by nonlinear least-squares fitting of a dual exponential equation to the synaptic waveform in eq. 1:
 |
(1) |
where I is the current response, AmplitudeFAST is the amplitude of the fast component, time is the time of the response in reference to the peak response amplitude, τFAST is the deactivation time constant of the fast component, AmplitudeSLOW is the amplitude of the slow component, and τSLOW is the deactivation time constant of the slow component. In the mEPSC recordings, τFAST was assumed to reflect the AMPAR component and determined by fitting the response in the presence of the competitive NMDAR antagonist APV. To estimate the amplitude of the NMDAR-mediated component of EPSC, the mean current between 40–50 ms after the peak of the AMPAR response was measured. The AMPAR/NMDAR ratio was calculated by dividing AmplitudeFAST by AmplitudeSLOW.
The NMDAR-mediated evoked EPSC peak amplitude was measured within a 2 ms window around the peak of the waveform obtained from the average of 30–40 individual EPSCs. Rise time was determined as the time for the current to rise from 20% to 80% of the peak amplitude. The EPSC time course was analyzed by fitting a single exponential component to the averaged waveform between 90% and 20% of the peak amplitude. For these experiments, EPSC decay kinetics were measured using the second EPSC waveform evoked by the paired stimuli and the paired-pulse ratio was calculated as P2/P1, where P1 represents the amplitude of the first evoked current and P2 the amplitude of the second synaptic current measured from the averaged EPSC waveform.
Spontaneous IPSCs (sIPSCs) were detected using Minianalysis as described above, with an amplitude threshold of 6–8 pA and an area of 30 fC at a holding potential of +10 mV. sIPSC recordings were analyzed for their relative frequency throughout the experiment. A rolling average (60-second window) of the sIPSC frequency was normalized to a 60-second period in pretreatment control phase of experiment for each cell, and the resulting plots averaged between cells to produce the composite response for all recordings in an experimental group. The comparable 60-second periods in the baseline and at the end of the application of (+)-CIQ phases was used to determine the change in sIPSC frequency and amplitude. To determine the integral of the spontaneous activity, the mean current in a stretch of the recording free of sIPSCs was subtracted from the full record. The current response in a 50-second window was integrated during the baseline, at the end of the (+)-CIQ phases and in the presence of gabazine. The gabazine current was subtracted from baseline and (+)-CIQ and the ratio (modulated/baseline) was calculated.
Single-Cell Reverse Transcription-PCR.
Reverse transcription (RT) was performed on the interneuron cytoplasm harvested as described herein. Reactions were run in a final volume of 10 µl (Lambolez et al., 1992), and two series of PCR were performed, as described previously (Cauli et al., 1997). The cDNAs present in 10 µl of the RT reaction first were amplified simultaneously using primer pairs with the sense and antisense primers positioned on two different exons (see Supplemental Table S3). Taq polymerase (2.5 U; Qiagen, Hilden, Germany) and 20 pmol of each primer were added to the buffer supplied by the manufacturer (final volume, 100 µl), and 21 cycles (94°C for 30 seconds, 60°C for 30 seconds, and 72°C for 30 seconds) of PCR were run. Second rounds of PCR were performed using 2 µl of the first PCR product as template. In this second round, each cDNA was amplified individually with a second set of primers internal to the primer pair used in the first PCR and positioned on two different exons (see nested primer pairs in Supplemental Table S3). Thirty-five PCR cycles were performed with cycle temperatures/times as described already; 10 µl of each individual PCR was run on a 2% agarose gel, with ΦX174 digested by HaeIII as a molecular weight marker; gels were stained with ethidium bromide and analyzed. The RT-PCR protocol was tested on 100 ng of total RNA purified from mouse whole brain. All transcripts were detected from 100 ng of whole-brain RNA. The sizes of the PCR-generated fragments were as predicted by the mRNA sequences (see Supplemental Table S3).
In Situ Hybridization.
Two C57Bl/6 mice aged P25 were used for in situ hybridization. Animals were anesthetized with isoflurane. Brains were then removed and flash-frozen in liquid N2. Frozen brains were cut into 12-µm coronal sections using a cryostat (Leica, Buffalo Grove, IL) and were mounted on slides. Slide-mounted sections were fixed in 4% paraformaldehyde and dehydrated in increasing concentrations of ethanol. Hybridization and amplification steps were then performed in a similar fashion (Pelkey et al., 2015) using RNAscope Flourescent Multiplex kit (Advanced Cell Diagnostics Inc., Hayward, CA). Probes used include Grin2d (cat no. 425951), parvalbumin (PV, cat no. 421931), cannabinoid receptor type 1 (CB1R, cat no.420721), somatostatin (SOM, cat no. 404631).
Hippocampal Field Tissue Preparation and Western Blotting for GluN2D.
Wild-type C57Bl/6 P9, P17, P30, P58, and P74 mice (both male and female, three in each age group) were used for Western blot analysis of GluN2D expression. Experiments included analysis of three Grin2d−/− mice at P9. Animals were euthanized by isoflurane overdose, the brains rapidly were removed, and 500-µm slices were cut in ice-cold PBS on a vibratome (TPI, St. Louis, MO). The whole hippocampus was dissected out for some slices and tissue punches of the CA1 region, the CA3 region, and the dentate gyrus/hilar region collected using a 0.75-mm Stoelting tissue punch from other slices. The tissue was frozen on dry ice and subsequently homogenized in lysis buffer containing (in mM) 150 NaCl, 50 Tris, 50 NaF, 5 EDTA, 5 EGTA, 1% Triton, 1% SDS, and protease inhibitors (Pierce, Thermo Scientific) at pH 7.4. A Bradford assay was used to quantify and normalize total protein concentrations, and the samples were then mixed with 4× Laemmli buffer (containing 40% glycerol, 240 mM Tris/HCl pH 6.8, 8% SDS, 0.04% bromophenol blue, 175 mM DDT). After samples were heated to 95°C for 5 minutes, they were separated by electrophoresis using a 4%–20% SDS-PAGE gel and transferred to a PVDF membrane (Bio-Rad, Hercules, CA). The mouse anti-GluN2D (cat no. MAB5578, 1:5000; Millipore), mouse anti-tubulin (1:50,000; Sigma-Aldrich), and horseradish peroxidase-conjugated goat anti-mouse (1:10,000; Jackson Immunoresearch, West Grove, PA) antibodies were used. Between probing for different primary antibodies, Restore Stripping Buffer (Pierce) was applied for 10 minutes to strip off previous probe. Band intensities were imaged (Bio-Rad Gel Doc XR+ Imager) from films exposed to chemiluminescence signals, and band intensity was analyzed using ImageJ Software (National Institutes of Health).
Off-Target Screening Using the Psychoactive Drug Screening Program.
The National Institute of Mental Health Psychoactive Drug Screening Program (PDSP, http://pdsp.med.unc.edu/) evaluated the potential off-target effects of (+)-CIQ and (-)-CIQ (Besnard et al., 2012). A total of 45 targets were assayed, including the serotonin receptor 5-HT1A, 5-HT1B, 5-HT1D, 5-HT1E, 5-HT2A, 5-HT2B, 5-HT2C, 5-HT3, 5-HT5A, 5-HT6, and 5-HT7; adrenergic receptor α1A, α1B, α1D, α2A, α2B, α2C, β1, β2, and β3; benzodiazepine site in rat brain; dopamine receptor D1, D2, D3, D4, and D5; opioid receptor δ, κ, and μ; histamine receptor H1, H2, H3, and H4; muscarinic receptor M1, M2, M3, M4, and M5; sigma receptor 1 and 2; peripheral benzodiazepine receptor (PBR); norepinephrine transporter, dopamine transporter, serotonin transporter, and GABA type-A receptor. A fixed concentration assay was used to determine whether a radioligand for each receptor could be displaced by each test compound. If it was determined that more than 50% of the radioligand was displaced, a secondary assay was run to determine the affinity of this interaction. This assay was designed to determine the affinity of the test compound at the potential target when Ki was less than 10 µM.
Chemistry Methods.
Racemic mixtures of CIQ (Life Chemicals, Burlington, Canada), FIQ (Life Chemicals), IIQ (synthesized as described in Santangelo Freel et al., 2013), and BIQ (Life Chemicals) were separated via a ChiralPak OD-RH reverse-phase 30 mm × 250 mm, 5 μM column using acetonitrile (ACN; 0.1% formic acid) and H2O (0.1% formic acid) as the solvent system, and the conditions for each compound are listed in Table 1. The enantiomeric excess was calculated for all enantiomer pairs as 100% ee using an Agilent 1200 high-performance liquid chromatography pump on a Chiral OD-RH column (4.6 mm × 150 mm, 5 μm) using ACN (0.1% formic acid) and H2O (0.1% formic acid) as the solvent system; the conditions are given in Table 2. All retention times for the ChiralPak and analytical chiral OD-RH, along with optical rotation values, are listed in Table 2. Optical rotation values were obtained using a polarimeter. The purity of both enantiomers was established to be greater than 95% by high-performance liquid chromatography.
TABLE 1.
Semipreparatory chiral column conditions and retention times of each enantiomer
| ChiralPak OD-RH Solvent Composition |
ChiralPak OD-RH Retention Time |
|||||
|---|---|---|---|---|---|---|
| ACN | H2O | Flow Rate | Run Time | Peak 1 | Peak 2 | |
| ml/min | min | min | min | |||
| CIQ | 75% | 25% | 10 | 40 | 24.04 | 27.68 |
| BIQ | 75% | 25% | 10 | 30 | 25.62 | 27.56 |
| IIQ | 65% | 35% | 10 | 40 | 30.06 | 35.27 |
| FIQ | 60% | 40% | 10 | 40 | 24.28 | 27.36 |
TABLE 2.
Analytical chiral column conditions and characterization of each enantiomer
| Analytical OD-RH Solvent Composition |
ChiralPak OD-RH Retention Time |
Optical Rotation Values |
||||||
|---|---|---|---|---|---|---|---|---|
| ACN | H2O | Flow Rate | Run Time | Peak 1 | Peak 2 | Peak 1 | Peak 2 | |
| ml/min | min | min | min | degrees | degrees | |||
| CIQ | 75% | 25% | 0.5 | 20 | 16.81 | 19.32 | +121 (c 0.10, dry DMSO) | −145 (c 0.10, dry DMSO) |
| BIQ | 75% | 25% | 0.5 | 20 | 8.61 | 9.79 | +104 (c 0.1, dry CHCl3) | −128 (c 0.1, dry CHCl3) |
| IIQ | 65% | 35% | 0.5 | 30 | 17.33 | 19.89 | +106 (c 0.1, dry CHCl3) | −93 (c 0.1, dry CHCl3) |
| FIQ | 60% | 40% | 0.5 | 30 | 13.47 | 15.53 | +89.4 (c 1.0, dry CHCl3) | −102 (c 1.0, dry CHCl3) |
Statistical Analysis.
Nonlinear least-squares fitting was performed on experimental data from individual concentration-response curves from each oocyte, which were fitted by the Hill equation (eq. 2):
 |
(2) |
where I is the current response, Potmax is the maximal predicted potentiation of the glutamate/glycine response (and expressed as a percent for clarity), [A] is the concentration of the modulator, h is the Hill slope, and EC50 is the half-maximally effective concentration of the modulator. The potentiated current response was expressed as percent of control. Displayed fitted curves were obtained by simultaneously fitting all oocyte data from each concentration.
Data are shown as mean ± S.E.M. unless otherwise indicated. Experimental sample size was chosen to ensure a power of at least 0.80 when detecting effect size changes ranging from 30% to 50%. Data were evaluated for statistical significance using a one-way analysis of variance (ANOVA) with Dunnett’s multiple comparison test with α set to 0.05 or a paired t test, as appropriate. For statistical testing of EC50 values, a one-way ANOVA with Dunnett’s multiple comparison test was calculated using the logarithm of the EC50 values with α set to 0.05.
Results
Enantiomeric Preference of a Series of GluN2C/D-Selective NMDAR Positive Allosteric Modulators.
To explore the subunit composition of the NMDARs underlying EPSCs in CA1 interneurons, we used a series of GluN2C/GluN2D-selective allosteric modulators (Mullasseril et al., 2010; Santangelo Freel et al., 2013). Racemic CIQ was described as the first GluN2C and GluN2D subunit-selective positive allosteric modulator for NMDARs (Mullasseril et al., 2010), with virtually all activity residing in the (+) enantiomer (Santangelo Freel et al., 2013). Although the stereochemistry of the two enantiomers has not been absolutely resolved, a model of the stereoselective reduction during the chiral synthesis of the enantiomers predicts that the (+)-enantiomer is the (R)-enantiomer (Santangelo Freel et al., 2014). In the absence of a crystal structure of either enantiomer, however, we refer to the active enantiomer as (+)-CIQ (Fig. 1B).
Fig. 1.

(+)-CIQ, but not (–)-CIQ, potentiates NMDAR–mediated currents in X. laevis oocytes. (A) Representative response of a GluN1/GluN2D NMDAR (activated by 100 µM glutamate and 30 µM glycine) in the absence and presence of increasing concentrations of (+)-CIQ (0, 0.3, 1, 3, 10, 30 µM). (B) The chemical structure of CIQ is shown, with the chiral carbon indicated by the asterisk (Santangelo Freel et al., 2013, 2014). (C-F) Concentration-response relationships show the effects of the purified enantiomers (+)-CIQ, (-)-CIQ and racemic CIQ on the diheteromeric NMDARs recorded under two electrode voltage clamp from X. laevis oocytes. (G) Off-target effects of 20 μM (+)- and (-)-CIQ on a subset of central nervous system receptors expressed in X. laevis oocytes (see Materials and Methods).
We first evaluated the properties of purified (+)-CIQ as well as closely related halogen-substituted analogs of CIQ (Table 3). In agreement with previous work using (±)-CIQ, neither (+)-CIQ nor (-)-CIQ affected responses of GluN1/GluN2A or GluN1/GluN2B diheteromeric NMDARs expressed in X. laevis oocytes when activated by 100 μM glutamate and 30 μM glycine (Fig. 1, C and D; Table 3). (+)-CIQ enhanced the response of GluN1/GluN2C and GluN1/GluN2D NMDARs activated by maximally effective coagonist concentrations, whereas (-)-CIQ had minimal effects at these NMDARs (Fig. 1, E and F; Table 3). To further examine the enantiomeric specificity of this class of modulator, other enantiopure halogenated isoquinolines (FIQ, BIQ, IIQ) were assayed for their activity on recombinant GluN1/GluN2 diheteromeric NMDARs. In all cases, activity resided with the (+) enantiomers (Table 3).
TABLE 3.
Stereoselective potentiation of GluN2C- and GluN2D-containing NMDARs
Values for current ratio and EC50 are mean ± S.E.M. from 8–22 oocytes obtained from at least two different frogs.
| Compound | I (30 µM) / I (Control) (%) |
EC50 (µM) [CI]a (% Max. Modulation) |
||||
|---|---|---|---|---|---|---|
| GluN2A | GluN2B | GluN2C | GluN2D | GluN2C | GluN2D | |
| (+)-FIQ | 100 ± 2.9 | 102 ± 2.1 | 192 ± 6.4 | 177 ± 3.5 | NA | NA |
| (-)-FIQ | 97 ± 0.9 | 96 ± 0.9 | 102 ± 3.5 | 106 ± 4.9 | NE | NE |
| (+)-CIQ | 118 ± 1.9 | 98 ± 1.3 | 250 ± 15 | 285 ± 11 | 7.8 [6.8, 9.0] (286 ± 23) | 10.5 [9.5, 11.7] (322 ± 18) |
| (-)-CIQ | 105 ± 2.7 | 88 ± 2.7 | 125 ± 4.7 | 117 ± 5.6 | NE | NE |
| (+)-BIQ | 87 ± 0.5 | 99 ± 0.8 | 318 ± 28 | 326 ± 16 | 3.8 [3.2, 4.5] (352 ± 47) | 5.5 [5.1, 6.0] (354 ± 21) |
| (-)-BIQ | 89 ± 5.7 | 84 ± 0.6 | 100 ± 5.0 | 96 ± 3.2 | NE | NE |
| (+)-IIQ | 98 ± 1.4 | 97 ± 0.7 | 197 ± 14 | 273 ± 15 | 2.1 [1.9, 2.2] (204 ± 16) | 3.5 [3.1, 4.0] (289 ± 16) |
| (-)-IIQ | 88 ± 3.6 | 85 ± 1.3 | 98 ± 5.4 | 85 ± 3.8 | NE | NE |
Mean half-maximally effective concentration of modulators (see Materials and Methods). The value [95% CI] was determined from fitting individual concentration-effect curves, averaging the fitted values on the log scale, and presented on linear scale. The Hill slopes ranged between 0.5 and 1.5. The fitted maximal response as a percentage of control is given in parentheses.
CI, confidence interval; NA, not analyzed; the concentration-effect curve could not be fitted by the Hill equation; NE, no effect; the ratio of current in 30 µM test compound to control current was less than 130%, which was our threshold for further analysis.
A previous evaluation of potential off-target activity of racemic CIQ suggested it was highly selective (Santangelo Freel et al., 2013), with a few notable exceptions, such as low-micromolar actions on 5-HT6 serotonin receptor, PBR, and several nACh receptors. Off-target analysis of 45 assayed receptors (see Materials and Methods) (Besnard et al., 2012) showed that 3 μM (+)-CIQ displaced bound ligand of the serotonin 5-HT1A receptor and PBR in the initial screening assay, prompting further evaluation of affinity. The Ki of (+)-CIQ was determined to be greater than 10 μM (which was the upper boundary for this assay) for the 5-HT1A receptor and 1.8 μM for the PBR receptor by the secondary assay. Additionally, 3 μM (-)-CIQ was found to displace bound ligand for serotonin 5-HT6, 5-HT7, and PBR receptors. Further evaluation determined that the Ki of (-)-CIQ was 1.0 μM for the 5-HT6 receptor, and greater than 10 μM for both the 5-HT7 receptor and the PBR. (+)-CIQ and (-)-CIQ were also screened at a higher concentration (20 μM) on a series of ionotropic receptors expressed in X. laevis oocytes using two electrode voltage clamp (Fig. 1G). Both (+)-CIQ and (-)-CIQ similarly inhibited nicotinic α1β1γδ acetylcholine receptors (42% ± 0.8% of control by (+)-CIQ versus 57% ± 17% by (-)-CIQ, unpaired t test, P = 0.54) and nicotinic α4β2 acetylcholine receptors (44% ± 5.1% by (+)-CIQ versus 34% ± 4.8% by (-)-CIQ, unpaired t test, P = 0.22) but did not significantly affect the other receptors tested. (+)-CIQ is a better tool compound than racemic CIQ for evaluation of GluN2C- and GluN2D-containing receptors due to its reduced off-target activity.
Grin2d mRNA and the GluN2D Protein are Expressed in Hippocampal Interneurons.
Several studies suggest that cortical and hippocampal interneurons express Grin2d mRNA (Monyer et al., 1994; Rudolf et al., 1996; Porter et al., 1998; Cauli et al., 2000), which encodes the GluN2D subunit. To provide more detailed information regarding interneuron subtype and NMDAR subunit expression patterns in the hippocampus, we performed single-cell RT-PCR from various interneurons throughout the hippocampal formation. A total of 37 interneurons were recorded using whole-cell patch-clamp methods under current-clamp and classified by their spiking activity before harvesting their cytoplasmic contents for the analysis of mRNA (Fig. 2, A–C). Patched cells were filled with biocytin, allowing for post hoc determination of soma and axon location (Fig. 2A). Single-cell RT-PCR (Fig. 2C) detected Grin2d in multiple interneuron subpopulations of the hippocampus, including dendritic targeting bistratified and oriens-lacunosum molecular cells, as well as fast spiking (PV) and regular spiking (cholecystokinin) perisomatic targeting basket cells. The location and prevalence of NMDAR subunits for the 37 interneurons assayed are summarized in Table 4 (complete cellular results are shown in Supplemental Table S4). Overall, amplified signals for Grin1, Grin2a, and Grin2b were detected in most cells (33, 26, and 31 of 37 interneurons, respectively). Grin2c was only detected in 1 of the 37 interneurons. Grin2d was detected in 29 of 37 cytoplasmic harvests from randomly recorded hippocampal interneurons.
Fig. 2.

Characterization of Grin2d mRNA expression in subtypes of CA1 hippocampal interneurons. (A) Flattened two-dimensional maximum projection image of a representative interneuron recorded in stratum oriens. (B) Example membrane-potential response recorded under current clamp to the square-wave current injection (±400 pA) protocol indicated as follows (scale bars, 500 ms/20 mV). (C) Single-cell RT-PCR products from the neuron shown in (A) reveal expression of PV, SOM, NPY, GAD65/67, Grin1, Grin2a, Grin2b, and Grin2d (upper panel). The lower panel shows RT-PCR products from 100 ng of whole-brain total RNA, confirming that all primer pairs generate appropriate bands. (D–F) Representative fluorescence in situ hybridization images from P25 mice depicting the colocalization of the Grin2d and interneuron markers: PV (D), CB1R is a marker of CCK interneurons (E), SOM (F).
TABLE 4.
Single-cell RT-PCR results from 37 neurons from mice P14–21
| Grin1a | Grin2aa | Grin2ba | Grin2ca | Grin2da | |
|---|---|---|---|---|---|
| Interneuron marker | |||||
| PV expressing | 100% | 78% | 78% | 11% | 67% |
| SOM expressing | 95% | 81% | 86% | 0% | 81% |
| NPY expressing | 86% | 75% | 86% | 4% | 79% |
| CCK expressing | 100% | 57% | 86% | 0% | 100% |
| Firing properties | |||||
| Fast spiking | 100% | 50% | 75% | 25% | 50% |
| Regular spiking | 88% | 73% | 85% | 0% | 82% |
| Soma location | |||||
| slm | 80% | 80% | 60% | 0% | 60% |
| so | 94% | 81% | 88% | 6% | 81% |
| sr | 87% | 60% | 93% | 0% | 87% |
| All interneurons | |||||
| Detection count | 33 | 26 | 31 | 1 | 29 |
| Percentage | 89% | 70% | 84% | 3% | 78% |
Percentage of cells.
After harvesting the intracellular contents of each recorded cell, soma localization was evaluated using fluorescence microscopy and assigned to stratum oriens (so), stratum pyramidale (sp), stratum radiatum (sr), stratum lacunosum moleculare (slm), stratum granulosum (sg), or hilus. Cells were categorized as fast spiking if they sustained high-frequency (>150 Hz) action potential discharge with little or no decrement in spike amplitude during a strong depolarizing current pulse of long duration (1 nA, 800–1000 ms) or regular spiking if they exhibited significant accommodation in spike frequency and decreasing spike amplitude during the same depolarizing current injection. See Supplemental Table S2 for explicit results from all cells.
To further investigate the cell-type specificity of Grin2d subunit expression, we performed fluorescent in situ hybridization examining mRNA expression for Grin2d and interneuron-specific molecular markers. Corroborating single-cell RT-PCR data, we found Grin2d in cells positive for PV, cannabinoid receptor type 1 (CB1R, a marker for cholecystokinin-expressing interneurons), and SOM (Fig. 2, D–F).
As an independent assessment of GluN2D expression at the protein level, we performed immunohistochemistry on adult mouse brain sections from mice using a GluN2C/D polyclonal antibody (Supplemental Fig. S1A, C). Several reports suggest that expression of GluN2D decreases throughout development (Akazawa et al., 1994; Monyer et al., 1994). We thus used adult animals to test whether GluN2D protein persists at older ages. Diffuse neuropil staining was evident throughout the hippocampus, in addition to staining of cell bodies. Parallel experiments showed that staining was greatly diminished in these same regions in age-matched Grin2d−/− mice (Supplemental Fig. S1B), confirming the specificity of the immunoreactivity for the GluN2D subunit. These data suggest that the immunostaining observed in these neurons reflected primarily GluN2D rather than GluN2C, consistent with lack of detection of Grin2c in RT-PCR analysis of interneuron mRNA.
To assess the protein expression of the GluN2D subunit across hippocampal regions and through early developmental periods, we collected hippocampal slices (Fig. 3A, B, D) from acute mouse brain slices (Fig. 3C and E). The expression of GluN2D was not detected in P9 Grin2d−/− hippocampal preparations (Fig. 3C). To assess expression of the GluN2D subunit in the different subfields of the adult hippocampus, micropunches of tissue were isolated from slices prepared from P74 mice (Fig. 3B). The GluN2D subunit was detected in all regions, with lower levels in the CA1 as compared with the dentate gyrus (Fig. 3, B and D). Similar to previous studies, GluN2D is expressed in the hippocampus of young and adult rodents but decreases in adulthood (Akazawa et al., 1994; Monyer et al., 1994; von Engelhardt et al., 2015).
Fig. 3.

GluN2D protein expression across development and hippocampus subfield. (A) Images of mouse brain slices illustrating typical tissue punches (diameter, 0.75 mm) taken for protein analysis of (from left to right) the dentate gyrus (Den), CA1, CA3, and a dissected whole hippocampus slice. (B) Representative Western blot for GluN2D and tubulin from three different animals (p74) for the CA1, CA3, and dentate gyrus tissue punch samples. (C) Representative Western blot of GluN2D and tubulin from whole hippocampus slices from WT mice aged P9, P17, P30, and P58 and Grin2d−/− aged P9. (D) Densitometry measurements for the GluN2D levels normalized to tubulin, analyzed by one-way repeat measure ANOVA (n = 3, F(2,4) = 8.869, P = 0.034, Tukey’s multiple comparison test; comparisons that were P < 0.05 are denoted by *). Measurements from six replicate SDS-PAGE gels and Western blots were used to produce the average for each animal’s value. (E) Densitometry measurements for the GluN2D levels as a function of age of WT samples normalized to tubulin, analyzed by one-way ANOVA (n = 3, F(3,8) = 3.95, P = 0.054). Measurements from three replicate SDS-PAGE gels and Western blots were used to produce the average for each animal’s protein value.
The NMDAR Component of mEPSCs in Hippocampal Interneurons Is Potentiated by (+)-CIQ.
To investigate the subunit composition of synaptic NMDARs in interneurons, we recorded from hippocampal interneurons in the CA1 stratum radiatum under voltage clamp (Vhold −60 mV) using the whole-cell patch-clamp method (Fig. 4A). We chose animals aged P7–14 as these ages preceded a switch from GluN2B to GluN2A (Akazawa et al., 1994; Monyer et al., 1994; Edman et al., 2012; McKay et al., 2012); these ages were also similar to those used in a recent study of NMDAR expression in hippocampal neurons (von Engelhardt et al., 2015). Slices were bathed in aCSF supplemented with 0.5 µM TTX, 10 µM gabazine or bicuculline, and extracellular Mg2+ reduced to 0.1 mM to record miniature EPSCs (mEPSCs). These inward currents had a rapid rise time and a dual exponential decay thought to reflect spontaneous release of a single vesicle of glutamate (Fig. 4B). By detecting and aligning these mEPSCs, we could average them together to resolve a deactivation time course containing two components, a fast exponential component (typically about a 5 ms decay time constant) and a slow exponential component (typically a decay time constant over 100 ms). We consider these dual-component mEPSCs to reflect the activation of AMPARs and NMDARs (Fig. 4, C and D; Table 5). The NMDAR antagonist APV (200 µM) eliminated the slow component of the inward current, suggesting that it is entirely generated by NMDARs (Fig. 4, E and F). Experiments were concluded by adding the AMPAR and kainate receptor antagonist DNQX (10 µM), which blocked all mEPSCs, confirming that they reflected glutamatergic synaptic currents. Using this recording paradigm, we assayed the actions of (+)-CIQ on mEPSCs from hippocampal CA1 interneurons (for observed mEPSC characteristics, Table 5; the protocol is given in Supplemental Fig. S2A).
Fig. 4.

Characterization of mEPSCs in hippocampal CA1 interneurons from P7-14 mice. (A) Visible light image of a mouse hippocampal slice showing a CA1 stratum radiatum interneuron in the whole-cell patch-clamp configuration; the outline of the recording electrode has been enhanced. (B) An illustrative recording of spontaneous glutamatergic activity from a CA1 interneuron in the presence of 0.5 µM TTX, 10 µM bicuculline, and 5 µM nimodipine. (C) Superimposed mEPSCs (black) and the mean response-time course (white); the red dashed line illustrates pre-mEPSC baseline current level. (D) The mEPSC peak-response amplitude histogram from the interneuron recording is shown in (C); the patterned area indicates amplitudes below the detection threshold. (E) Averaged composite mEPSC time course is shown for control conditions and in APV (200 µM); the difference current reveals the NMDAR component of the mEPSC (average response is shown ± S.E.M. indicated by the shaded area). (F) The same recordings in (E) shown on an expanded scale to better illustrate the NMDAR-component.
TABLE 5.
Measured mEPSC characteristics of neurons from P7–14 mice
| AMPAR Time Constant (ms) | NMDAR Time Constant (ms) | AMPAR Amplitude (pA) | NMDAR Amplitude (pA)a | mEPSC Detection rate (s−1) | AMPAR/NMDAR ratiob | n | |
|---|---|---|---|---|---|---|---|
| Interneuron WT | 4.6 ± 0.5 | 138 ± 37 | 20 ± 1.6 | 2.1 ± 0.2 | 1.6 ± 0.4 | 9.7 ± 1.1 | 25 |
| Interneuron Grin2d−/− | 3.9 ± 0.7 | 140 ± 48 | 24 ± 4.3 | 3.9 ± 1.3 | 1.0 ± 0.5 | 6.8 ± 0.7 | 4 |
| Pyramidal WT | 6.5 ± 0.4 | 91 ± 8.6 | 21 ± 1.4 | 4.7 ± 0.6 | 0.92 ± 0.22 | 5.9 ± 0.9 | 17 |
NMDAR amplitude is calculated from the amplitude of slower component of the dual exponential fit.
Recordings were performed in 0.1 mM Mg2+. Values are mean ± S.E.M.; n is the number of cells.
(+)-CIQ (10 μM) had no significant effect on the amplitude of the AMPAR component of the mEPSCs (99% ± 3%; Fig. 5, A and C; Table 6, repeat-measures ANOVA, n = 17, F(2,32) = 5.651, P = 0.0079, Dunnett’s test, P < 0.05 for a slight increase by APV). By contrast, (+)-CIQ enhanced the amplitude of the NMDAR-mediated component of the mEPSC to 147% ± 10% of control (Fig. 5, B and D; Table 6, repeat-measures ANOVA, n = 17, F(2,32) = 173.0; P < 0.0001, Dunnett’s test, P < 0.05). APV reduced the NMDAR amplitude to 18% ± 4% of control (P < 0.001, Dunnett’s test). In vehicle experiments, the AMPAR-component amplitude of the mEPSCs did not significantly change, nor did the NMDAR-component, the latter of which was blocked by APV (NMDAR amplitude, 115% ± 22% vehicle/control, 14% ± 4% APV/control, Fig. 5E, Supplemental Fig. S2BD; Table 6; repeat-measures ANOVA, n = 8, F(2,14) = 22.31, P < 0.0001, Dunnett’s test, P < 0.0001 for APV). We also recorded mEPSCs from CA1 pyramidal neurons, which should lack the GluN2D subunit (Table 5). When (+)-CIQ was applied to pyramidal neurons, there were no detectable changes in the amplitude of the AMPAR-mediated fast component of the mEPSC (94% ± 15%) or the NMDAR-mediated slow components of the mEPSCs (109% ± 19%), the latter of which was sensitive to APV (10% ± 2%, Fig. 5, A, B, and F; Supplemental Fig. S2D; Table 6 repeat-measure ANOVA, n = 10, F(2,18) = 76.94, P < 0.0001, Dunnett’s test P > 0.05 for (+)-CIQ and P < 0.0001 for APV). (+)-CIQ also had no significant effect on the amplitude of the AMPAR or NMDAR component of the mEPSC in slices prepared from Grin2d−/− mice (NMDAR amplitude, 90% ± 20% (+)-CIQ/control, 16% ± 3% APV/control; Fig. 5, A, B, and G; Supplemental Fig. S2D; Table 6, repeat-measure ANOVA, n = 4, F(2,6) = 56.02, P < 0.0001, Dunnett’s test, P > 0.05 for (+)-CIQ and P < 0.0001 for APV). These data support the idea that the potentiating effects of (+)-CIQ on interneuron mEPSCs reflect actions at the GluN2D subunit.
TABLE 6.
Effects of (+)-CIQ on the AMPAR and NMDAR components of mEPSCs in P7–14 mice
| AMPAR Amplitudea |
NMDAR Amplitudeb |
n | ||||||
|---|---|---|---|---|---|---|---|---|
| Control (pA) | Treatment (pA) | Treatment/Control | Control (pA) | Treatment (pA) | Treatment/Control | |||
| Interneuron | ||||||||
| WT | Vehicle | 18 ± 3.4 | 19 ± 3.3 | 1.07 ± 0.21 | 1.4 ± 0.25 | 1.6 ± 0.26 | 1.15 ± 0.22 | 8 |
| WT | (+)-CIQ | 20 ± 1.8 | 20 ± 1.7 | 0.99 ± 0.03 | 1.2 ± 0.12 | 1.7 ± 0.11* | 1.47 ± 0.10 | 17 |
| Grin2d−/− | (+)-CIQ | 24 ± 4.3 | 23 ± 5.3 | 0.95 ± 0.21 | 1.8 ± 0.17 | 1.6 ± 0.20 | 0.90 ± 0.20 | 4 |
| Pyramidal | ||||||||
| WT | Vehicle | 23 ± 2.6 | 19 ± 1.8 | 0.85 ± 0.16 | 2.5 ± 0.89 | 3.0 ± 1.0 | 1.33 ± 0.27 | 7 |
| WT | (+)-CIQ | 20 ± 1.6 | 19 ± 2.4 | 0.94 ± 0.15 | 2.9 ± 0.32 | 3.0 ± 0.29 | 1.09 ± 0.19 | 10 |
AMPAR amplitudes were measured by the amplitude of fast component of the fitted composite mEPSC (mean ± S.E.M.).
NMDAR amplitudes were measured as the averaged response between 40 and 50 ms after the peak AMPAR response (mean ± S.E.M.).
P < 0.05, Dunnett’s test after a repeat-measure ANOVA (control versus treatment).
(+)-CIQ Does Not Alter the NMDAR EPSC Time Course.
We analyzed the time course of the NMDAR component of the mean composite mEPSCs recorded in the presence of 1.5 mM extracellular Mg2+ at a holding current of +40 mV. These currents were larger and provide a more reliable analysis of the synaptic time course of the NMDAR component of the mEPSC. These synaptic currents may arise from a mixed population of interneurons that have different AMPAR subtype expression. Some of these interneurons express GluA2-lacking AMPARs with inward rectifying current-voltage relationships in the presence of intracellular spermine (Matta et al., 2013; McBain and Dingledine 1993). We measured the time course of the NMDAR component of the mEPSC in the presence of only GABAA antagonists for wild-type and Grin2d−/− stratum radiatum interneurons (Fig. 6A). The average mEPSC response amplitude at +40 mV was 18 ± 1.2 pA in CA1 interneurons in slices from wild-type mice, similar to mEPSCs in CA3 stratum radiatum interneurons (McBain and Dingledine 1993). By fitting the composite mEPSC time course to two exponential components, the amplitude of the NMDAR-component was 12 ± 1.2 pA and decayed with a time constant of 200 ± 18 ms. The amplitude of the NMDAR component under these recording conditions is likely greater than that determined at −60 mV owing to the channel block produced by 0.1 mM Mg2+, as well as the ability of Mg2+ at 1.5 mM (+40 mV) to potentiate GluN2B outward currents (Paoletti et al., 1995). Additionally, we observed an increase in NMDAR-dependent noise in recordings at +40 mV, which altered the amplitude threshold for mEPSCs detection, potentially skewing our sample of mEPSCs to a subset with larger amplitudes. In CA1 interneurons held at +40 mV in slices from Grin2d−/− mice, the mEPSC amplitude was 13 ± 1.9 pA (Grin2d−/− compared with WT, unpaired t test, P = 0.06, n = 12,5). The amplitude of the NMDAR-mediated component of the Grin2d−/− mEPSC was 9.7 ± 2.3 pA (Grin2d−/− compared with WT, unpaired t test, P = 0.33, n = 12,5) with a time constant of 300 ± 44 ms (Grin2d−/− compared with WT, unpaired t test, P = 0.02, m = 12,5).
Fig. 6.

Synaptic response time course for GluN2D-containing receptors. (A) Normalized mEPSCs (VHold +40 mV) from wild type and Grin2d−/− interneurons (P7-14) are superimposed (20% scale bar corresponds to 3.2 pA for WT and 2.6 pA for Grin2d−/−). (B) Time-course plot of EPSC-NMDA amplitude is shown for a representative interneuron that displayed reversible potentiation by racemic CIQ. Each point represents the peak amplitude of an individual EPSC-NMDA (first peak in paired pulse experiments, shown above) evoked at 0.2 Hz before, during, and after CIQ (10 µM) treatment. At the end of an experiment, slices were treated with the NMDAR antagonist APV (100 µM) to confirm that current responses were mediated by NMDAR activation. Current responses above are superimposed pairs of evoked average EPSC waveforms (30 consecutive events) obtained at the times indicated (scale bars 200 ms/100 pA); expanded traces (right) show the first peak. (C) Fold change in the peak amplitude of responding cells (right, red shaded) and nonresponding cells (left, blue, and unshaded) during CIQ application, on brain slices from mice P14–21, and during the washout period are shown in the left graph. Box and whiskers plots illustrate the 2.5%–97.5% range of the data. Responders are defined as a showing a reversible increase in current amplitude of 20% or more. In the right graph, the weighted time constant of the responding cells is shown during the CIQ and washout periods as fold-change from pretreatment control. Data are expressed as percentage of control EPSCs obtained before racemic CIQ treatment.
Additional experiments were performed with racemic CIQ to investigate the time course of the CIQ-responsive synaptic current (Fig. 6, B–D). Pairs of evoked EPSCs were recorded from hippocampal interneurons at +40 mV from P14–21 slices (Fig. 6B). The evoked EPSC time course was determined in cells for which racemic CIQ produced a reversible increase of the NMDAR peak amplitude (at least 120% of control, 16 of 50 cells; Fig. 6C). Potentiation of the peak amplitude in these cells was on average 142% ± 6% of control (Fig. 6D). There was no detectable change by CIQ in the paired pulse ratio (Fig. 6B, summary data not shown, P = 0.34, one sample t test). In this subset of CIQ-sensitive cells, the weighted time constant was not significantly different in CIQ compared with control (Fig. 6D; 110% ± 5.7% of control, n = 16, P = 0.08, paired t test).
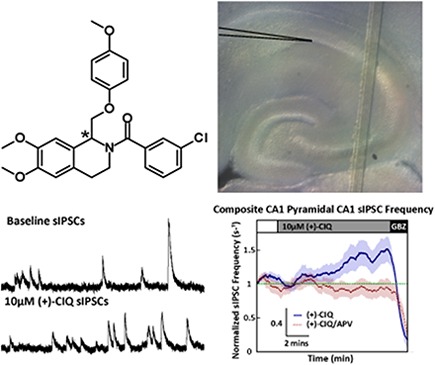
(+)-CIQ Increases Spontaneous Interneuron Activity in Mouse Hippocampal Brain Slices.
Hippocampal CA1 interneurons exhibit tonic firing activity that can be modulated by NMDAR activity (Lacaille et al., 1987; Xue et al., 2011). To determine whether (+)-CIQ could influence interneuron activity through its actions on GluN2D-containing NMDARs, we recorded spontaneous inhibitory post synaptic currents (sIPSCs) from CA1 pyramidal cells from P7–14 mice. GABAA receptor-mediated sIPSCs (Fig. 7A) were isolated by recording at the reversal potential of AMPARs and NMDARs (+10 mV, see Materials and Methods). The baseline sIPSC frequency (3.51 ± 0.55 s−1) was increased during application of (+)-CIQ by 1.48 ± 1.9-fold (Fig. 7, B and C, paired t test, P = 0.02). In addition, (+)-CIQ significantly increases the total inhibitory charge transfer, measured as the integral of the sIPSC recordings, by 1.71 ± 0.3-fold of baseline (paired t test, P = 0.04; Fig. 7C). There was no detectable difference in sIPSC peak amplitude (1.12 ± 0.12-fold of baseline, paired t test, P = 0.32).
Fig. 7.

(+)-CIQ increases spontaneous interneuron activity in hippocampal brain slices from P7–14 mice. (A) Representative sIPSC recordings from CA1 pyramidal cells before and during the application of (+)-CIQ. (B) Composite rolling average (30-s window) of sIPSC frequency from CA1 pyramidal cells in the presence of (+)-CIQ and (+)-CIQ/APV. The baseline sIPSC frequency was established (white box, aCSF/DMSO for (+)-CIQ recordings and aCSF/200 µM APV/DMSO for (+)-CIQ/APV recordings), followed by the addition of 10 µM (+)-CIQ (gray box). Experiments ended in 10 µM gabazine (black box) to ensure spontaneous sIPSCs reflected solely GABAA receptor-mediated transmission. The shaded area shows S.E.M. across cells. (C) Average change (fold over baseline response) in sIPSC frequency, amplitude, and integral of current response of spontaneous activity for (+)-CIQ and (+)-CIQ/APV recordings. *P < 0.05 by unpaired t test of fold change over baseline for test conditions.
In parallel experiments, 200 μM APV was applied to the slice and did not detectably alter the mean sIPSC frequency (control 2.60 ± 0.54 s−1, APV 2.18 ± 0.34 s−1). Application of (+)-CIQ, in the presence of APV, had no significant effect on sIPSC frequency (0.92 ± 0.13-fold of baseline, P = 0.56), amplitude (0.96 ± 0.08-fold of baseline, P = 0.65) or total inhibitory charge transfer (Fig. 7, B and C, 0.86 ± 0.15-fold of baseline, P = 0.32). These data suggest that the effects of (+)-CIQ that we measured were NMDA receptor-dependent.
Discussion
Three important conclusions can be drawn from this study. First, Grin2d mRNA is present in a wide array of interneurons as assessed by single-cell PCR and in situ hybridization experimentation. Second, GluN2D subunit immunoreactivity could be detected in the neuropil of all hippocampal subfields, and expression persisted in adult mice. Third, the GluN2C/GluN2D-selective positive allosteric modulator (+)-CIQ potentiates the NMDAR component of synaptic events in WT hippocampal CA1 interneurons but not Grin2d−/− interneurons. These data suggest that (+)-CIQ can increase the activity of hippocampal CA1 interneurons, which was confirmed in recordings of sIPSCs in hippocampal pyramidal cells. These data provide strong evidence that the GluN2D subunit incorporates into the NMDARs that mediate excitatory synaptic transmission onto interneurons. In addition, we describe (+)-CIQ’s improved pharmacologic properties over its racemic mixture.
Expression of GluN2D in hippocampal interneurons has been previously inferred by various means (Monyer et al., 1994, Thompson et al., 2002; von Engelhardt et al., 2015). Here, we provide direct functional and pharmacologic evidence supporting the expression of GluN2D at synapses in hippocampal interneurons. By contrast, GluN2D appears to be undetectable in the NMDARs that mediate excitatory synapses onto CA1 pyramidal cells at this developmental stage. Multiple lines of evidence in this study suggest that this population of synaptic NMDARs that are modulated by (+)-CIQ may be triheteromeric receptors that contain one GluN2D plus either a GluN2A or GluN2B subunit. The observed time course of the (+)-CIQ-sensitive currents (GluN2D-containing synaptic NMDAR responses) is distinct from that of recombinant diheteromeric GluN1/GluN2D NMDARs in vitro (Vance et al., 2012; Wyllie et al., 2013; Swanger et al., 2015). Diheteromeric GluN1/GluN2D NMDARs display an unusually long decay time constant after removal of glutamate (time constant ∼1 second, at 32°C). If diheteromeric GluN1/GluN2D NMDARs were present at the synapse, we would expect a slower EPSC time course than observed, regardless of the GluN1 splice variant expressed (Vance et al., 2012), given that the deactivation rate of the expressed receptors controls the time course of the EPSC (Lester et al., 1990). However, the absence of a detectable increase in the deactivation time course of the NMDAR response by potentiating GluN2D-containing receptors suggests that the NMDAR pool does not contain a high proportion of diheteromeric GluN1/GluN2D NMDARs. Recent data describing the time course of triheteromeric NMDARs suggest that the deactivation time course may be dominated by that of the faster deactivating subunit following rapid removal of glutamate (Hansen et al., 2014). For example, the deactivation time course for triheteromeric GluN1/GluN2A/GluN2B NMDARs (57 ms, 23°C) was closer to that of the faster deactivating GluN1/GluN2A diheteromeric receptor (33 ms, 23°C) than the slower deactivating GluN1/GluN2B diheteromeric receptor (274 ms, 23°C; data from Hansen et al., 2014). Thus, the EPSC time course that we detected here (200 ± 18 ms, 29–32°C) may reflect the more rapid deactivation of the GluN2 subunit that is coassembled with GluN2D. In addition, racemic CIQ’s actions on in vitro GluN1/GluN2A/GluN2D-containing NMDAR further suggest that (+)-CIQ acts on triheteromeric receptors in this study. The degree of potentiation by 10 µM (+)-CIQ (150%) observed here is similar to that described for CIQ actions on triheteromeric GluN1/GluN2A/GluN2D receptors, as opposed to diheteromeric receptors that contain two copies of GluN2D, which show >200% potentiation by CIQ (Mullasseril et al., 2010). Together, these data suggest that GluN2D-containing diheteromeric NMDARs are either not present at the synapse or constitute a small portion of the synaptic receptor pool of NMDARs.
There is also the possibility that only a subset of synapses express synaptic GluN2D-containing NMDARs, which would reduce the experimentally measured mean effect of (+)-CIQ from all synapses (as measured by mEPSC recordings). In addition, (+)-CIQ for unanticipated reasons might not reach all synapses in the recorded slices, preventing a fully potentiated state. The evoked EPSCs recorded at positive potentials revealed that approximately one in three cells are influenced by racemic CIQ. By contrast, in data obtained for mEPSCs and single-cell RT-PCR experiments, more than 75% of the cells show evidence of Grin2d expression. This discrepancy in GluN2D detection may have a systematic cause. In single-cell RT-PCR samples, the complete cellular contents of the neuron and detected mEPSCs should be sampled from the entire dendritic arbor of the neuron, whereas typical stimulating protocols activate release from only 5–20 synapses (approximated from the average stimulated response amplitudes and mEPSC amplitude at +40 mV in this study). The lower percentage of CIQ-sensitive cells may also reflect voltage-dependent plasticity of GluN2D, given that the step to +50 mV might increase intracellular levels of Ca2+ that could momentarily overload the buffering capacity provided by the intracellular BAPTA and alter receptor expression or localization.
Our results agree with a study (von Engelhardt et al., 2015) that used genetic and pharmacologic experiments to suggest the expression of synaptic GluN2D by analyzing the effects of a GluN2B-selective inhibitor, ifenprodil, on hippocampal CA1 interneurons in WT and Grin2d−/− mice. Our data from experiments showing the actions of (+)-CIQ on mEPSCs deactivation time constants suggest that the presence of a GluN2D-containing pool of synaptic NMDARs does not prolong the EPSC time course. This result differs from data showing that ifenprodil prolongs the EPSC time course (von Engelhardt et al., 2015), which was interpreted to reflect the influence of GluN2D on synaptic currents in the absence of functional GluN2B. Additionally, our data with (+)-CIQ suggest that synaptic GluN2D-containing NMDARs in CA1 interneurons are potentially triheteromeric NMDARs. The discrepancy in the GluN2D-containing component of the NMDAR-EPSC synaptic time course between these two studies could be due to the pharmacology of ifenprodil at these triheteromeric receptors. For instance, ifenprodil is known to increase glutamate affinity at GluN2B-containing NMDARs (Kew and Kemp, 1998), which slows the deactivation time course, an effect that might be pronounced in GluN2B/GluN2D triheteromeric NMDARs. A complete study of ifenprodil’s actions at all possible triheteromeric receptors that can be made with GluN2A, GluN2B, and GluN2D will need to be performed to fully interpret these observations.
Interestingly, we detected a slower NMDAR synaptic time course in Grin2d−/− neurons (300 ± 44 ms) than WT neurons (200 ± 18 ms), consistent with the result reported by von Engelhardt et al. (2015), who showed at a lower recording temperature and different animal age a prolongation of the median time constant from 253 ms in WT mice to and 323 ms in Grin2d−/− mice. This result is paradoxical since GluN2D has a longer deactivation time course, and the loss of GluN2D would therefore be expected to shorten the net NMDA deactivation time course, as observed in the spinal cord and subthalamic nuclei (Hildebrand et al., 2014; Swanger et al., 2015), which may reflect an overall difference in GluN2D expression or differences in GluN2D-containing NMDAR composition. Additionally, the Grin2d−/− mice might have a disrupted GluN2A/GluN2B developmental switch that gives rise to this observed deactivation time course at this age (Liu et al., 2004; Lu and Constantine-Paton 2004) or other compensatory mechanisms that alter the properties of synaptic receptors. More work needs to be done to further understand how specific NMDAR subunits such as GluN2D influence circuit-, network-, and systems-level dynamics.
The finding that GluN2D is expressed in hippocampal interneurons has important implications for circuit function, exemplified by the ability of (+)-CIQ to increase the activity of CA1 interneurons. The presence of GluN2D could enable a different role of NMDARs in these cell types and in the hippocampal network. Coassembly of GluN2D may change open probability and trafficking of synaptic receptors and consequently alter where these receptors are expressed, what signals (i.e., synaptic, perisynaptic, extrasynaptic) they receive, and how these signals are integrated. The interneurons of the hippocampus as well as neocortex control the excitability of local circuits, influencing other interneurons as well as principal cells, thus sculpting the firing patterns of pyramidal/projection neurons. Furthermore, the GluN2D subunit may dictate distinct rules for the firing patterns that are capable of triggering NMDAR-dependent synaptic plasticity. If potentiation of GluN2D changes the synaptic NMDAR response to be more GluN2D-like (low open probability, low Ca2+ permeability, weak Mg2+ block), when the population of receptors are mixed, neuronal plasticity that depends on these properties, such as spike timing-dependent plasticity, may be altered by GluN2D potentiation (Hao and Oertner 2012; Verhoog et al., 2013; Stefanescu and Shore, 2015). A complete understanding of the pharmacology of triheteromeric NMDARs containing GluN2D is required to understand how these receptors are behaving in the hippocampus. As shown by the increase in sIPSC frequency by (+)-CIQ, positive allosteric modulation of GluN2D-containing NMDARs could have important effects on circuit and network function. The ability of GluN2C/D-selective modulators to alter the network balance of hippocampus by selectively acting on interneurons (Bachtiar and Stagg, 2014; Talaei et al., 2016) might have significant actions on animal behavior, such as learning and memory (Kullmann and Lamsa, 2007; Sweatt, 2016). In addition, modulation of interneuron activity by GluN2C/D-selective allosteric modulators could have therapeutic implications (Collingridge et al., 2013).
Acknowledgments
The authors thank Phoung Le and Jing Zhang for outstanding technical assistance; Susan Jenkins and Jean-Francois Pare for help with immunostaining; and the National Institute of Mental Health’s Psychoactive Drug Screening Program, contract no. HHSN-271-2013-00017-C (NIMH PDSP), for Ki determinations and receptor binding profiles. The NIMH PDSP is directed by Bryan L. Roth at the University of North Carolina at Chapel Hill and Project Officer Jamie Driscoll at NIMH, Bethesda, MD. Dennis Liotta, Katie Strong, and Stephen Traynelis are inventors on Emory-owned IP. Dennis Liotta is a member of the Board of Directors, and Stephen Traynelis is a paid consultant for NeurOp Inc., a company developing NMDA receptor modulators. Stephen Traynelis is a paid consultant for Pfizer and Janssen Research and Development. The authors also thank Sharon Swanger for critical comments on the manuscript.
Abbreviations
- ACN
acetonitrile
- aCSF
artificial cerebral spinal fluid
- AMPA
α-amino-3-hydroxy-5-methyl-4-isoxazolepropionic acid
- ANOVA
analysis of variance
- APV
(2R)-amino-5-phosphonovaleric acid
- BIQ
(3-bromophenyl)[3,4-dihydro-6,7-dimethoxy-1-[(4-methoxyphenoxy)methyl]-2(1H)-isoquinolinyl]methanone
- cDNA
complementary deoxyribonucleic acid
- CIQ
(3-chlorophenyl)[3,4-dihydro-6,7-dimethoxy-1-[(4-methoxyphenoxy)methyl]-2(1H)-isoquinolinyl]methanone
- DAB
3,3′ diaminobenzidine
- DMSO
dimethylsulfoxide
- EPSC
excitatory postsynaptic current
- FIQ
(3-flourophenyl)[3,4-dihydro-6,7-dimethoxy-1-[(4-methoxyphenoxy)methyl]-2(1H)-isoquinolinyl]methanone
- GABA
γ-aminobutyric acid
- GABAAR
γ-aminobutyric acid type A receptor
- IIQ
(3-iodophenyl)[3,4-dihydro-6,7-dimethoxy-1-[(4-methoxyphenoxy)methyl]-2(1H)-isoquinolinyl]methanone
- IPSC
inhibitory postsynaptic current
- mEPSC
miniature excitatory postsynaptic current
- NMDA
N-methyl-d-aspartate
- NMDAR
N-methyl-d-aspartate receptor
- PAM
positive allosteric modulator
- PBR
peripheral benzodiazepine receptor
- PBS
phosphate-buffered saline
- PCR
polymerase chain reaction
- PV
parvalbumin
- RT
reverse transcription
- sIPSC
spontaneous inhibitory postsynaptic current
- SOM
somatostatin
- TTX
tetrodotoxin
Authorship Contributions
Participated in research design: Perszyk, DiRaddo, Strong, Low, Ogden, Khatri, Vargish, Pelkey, Tricoire, Liotta, Smith, McBain, Traynelis.
Conducted experiments: Perszyk, DiRaddo, Low, Ogden, Khatri, Vargish, Pelkey, Tricoire, Smith.
Contributed new reagents or analytic tools: Strong, Liotta.
Performed data analysis: Perszyk, DiRaddo, Low, Ogden, Khatri, Vargish, Pelkey, Tricoire, Smith.
Wrote or contributed to the writing of the manuscript: Perszyk, DiRaddo, Strong, Low, Ogden, Khatri, Vargish, Pelkey, Tricoire, Liotta, Smith, McBain, Traynelis.
Footnotes
This work was supported by the National Institutes of Health (NIH) National Institute of Neurologic Disorders and Stroke [Grants RO1-NS036654, RO1-NS065371], NIH National Institute of General Medical Sciences [Grant T32-GM008602], and NIH Office of Research Infrastructure Programs [Grant P51OD011132]. This research was supported [in part] by the Intramural Research Program of the NIH National Institute of Child Health and Human Development.
 This article has supplemental material available at molpharm.aspetjournals.org.
References
- Akazawa C, Shigemoto R, Bessho Y, Nakanishi S, Mizuno N. (1994) Differential expression of five N-methyl-D-aspartate receptor subunit mRNAs in the cerebellum of developing and adult rats. J Comp Neurol 347:150–160. [DOI] [PubMed] [Google Scholar]
- Bachtiar V, Stagg CJ. (2014) The role of inhibition in human motor cortical plasticity. Neuroscience 278:93–104. [DOI] [PubMed] [Google Scholar]
- Besnard J, Ruda GF, Setola V, Abecassis K, Rodriguiz RM, Huang X-P, Norval S, Sassano MF, Shin AI, Webster LA, et al. (2012) Automated design of ligands to polypharmacological profiles. Nature 492:215–220. [DOI] [PMC free article] [PubMed] [Google Scholar]
- Cauli B, Audinat E, Lambolez B, Angulo MC, Ropert N, Tsuzuki K, Hestrin S, Rossier J. (1997) Molecular and physiological diversity of cortical nonpyramidal cells. J Neurosci 17:3894–3906. [DOI] [PMC free article] [PubMed] [Google Scholar]
- Cauli B, Porter JT, Tsuzuki K, Lambolez B, Rossier J, Quenet B, Audinat E. (2000) Classification of fusiform neocortical interneurons based on unsupervised clustering. Proc Natl Acad Sci USA 97:6144–6149. [DOI] [PMC free article] [PubMed] [Google Scholar]
- Choi DW. (1992) Excitotoxic cell death. J Neurobiol 23:1261–1276. [DOI] [PubMed] [Google Scholar]
- Clarke RJ, Johnson JW. (2006) NMDA receptor NR2 subunit dependence of the slow component of magnesium unblock. J Neurosci 26:5825–5834. [DOI] [PMC free article] [PubMed] [Google Scholar]
- Collingridge GL, Volianskis A, Bannister N, France G, Hanna L, Mercier M, Tidball P, Fang G, Irvine MW, Costa BM, et al. (2013) The NMDA receptor as a target for cognitive enhancement. Neuropharmacology 64:13–26. [DOI] [PMC free article] [PubMed] [Google Scholar]
- Coyle JT. (2012) NMDA receptor and schizophrenia: a brief history. Schizophr Bull 38:920–926. [DOI] [PMC free article] [PubMed] [Google Scholar]
- Coyle JT, Tsai G, Goff D. (2003) Converging evidence of NMDA receptor hypofunction in the pathophysiology of schizophrenia. Ann N Y Acad Sci 1003:318–327. [DOI] [PubMed] [Google Scholar]
- Edman S, McKay S, Macdonald LJ, Samadi M, Livesey MR, Hardingham GE, Wyllie DJA. (2012) TCN 201 selectively blocks GluN2A-containing NMDARs in a GluN1 co-agonist dependent but non-competitive manner. Neuropharmacology 63:441–449. [DOI] [PMC free article] [PubMed] [Google Scholar]
- Hallett PJ, Standaert DG. (2004) Rationale for and use of NMDA receptor antagonists in Parkinson’s disease. Pharmacol Ther 102:155–174. [DOI] [PubMed] [Google Scholar]
- Hansen KB, Ogden KK, Yuan H, Traynelis SF. (2014) Distinct functional and pharmacological properties of Triheteromeric GluN1/GluN2A/GluN2B NMDA receptors. Neuron 81:1084–1096. [DOI] [PMC free article] [PubMed] [Google Scholar]
- Hansen KB, Tajima N, Risgaard R, Perszyk RE, Jorgensen L, Vance KM, Ogden KK, Clausen RP, Furukawa H, Traynelis SF. (2013) Structural determinants of agonist efficacy at the glutamate binding site of NMDA receptors. Mol Pharmacol 84:114–127. [DOI] [PMC free article] [PubMed] [Google Scholar]
- Hao J, Oertner TG. (2012) Depolarization gates spine calcium transients and spike-timing-dependent potentiation. Curr Opin Neurobiol 22:509–515. [DOI] [PubMed] [Google Scholar]
- Hildebrand ME, Pitcher GM, Harding EK, Li H, Beggs S, Salter MW. (2014) GluN2B and GluN2D NMDARs dominate synaptic responses in the adult spinal cord. Sci Rep 4:4094. [DOI] [PMC free article] [PubMed] [Google Scholar]
- Kew JNC, Kemp JA. (1998) An allosteric interaction between the NMDA receptor polyamine and ifenprodil sites in rat cultured cortical neurones. J Physiol 512:17–28. [DOI] [PMC free article] [PubMed] [Google Scholar]
- Kullmann DM, Lamsa KP. (2007) Long-term synaptic plasticity in hippocampal interneurons. Nat Rev Neurosci 8:687–699. [DOI] [PubMed] [Google Scholar]
- Lacaille JC, Mueller AL, Kunkel DD, Schwartzkroin PA. (1987) Local circuit interactions between oriens/alveus interneurons and CA1 pyramidal cells in hippocampal slices: electrophysiology and morphology. J Neurosci 7:1979–1993. [DOI] [PMC free article] [PubMed] [Google Scholar]
- Lambolez B, Audinat E, Bochet P, Crépel F, Rossier J. (1992) AMPA receptor subunits expressed by single Purkinje cells. Neuron 9:247–258. [DOI] [PubMed] [Google Scholar]
- Landwehrmeyer GB, Standaert DG, Testa CM, Penney JB, Jr, Young AB. (1995) NMDA receptor subunit mRNA expression by projection neurons and interneurons in rat striatum. J Neurosci 15:5297–5307. [DOI] [PMC free article] [PubMed] [Google Scholar]
- Lester RAJ, Clements JD, Westbrook GL, Jahr CE. (1990) Channel kinetics determine the time course of NMDA receptor-mediated synaptic currents. Nature 346:565–567. [DOI] [PubMed] [Google Scholar]
- Liu X-B, Murray KD, Jones EG. (2004) Switching of NMDA receptor 2A and 2B subunits at thalamic and cortical synapses during early postnatal development. J Neurosci 24:8885–8895. [DOI] [PMC free article] [PubMed] [Google Scholar]
- Lu W, Constantine-Paton M. (2004) Eye opening rapidly induces synaptic potentiation and refinement. Neuron 43:237–249. [DOI] [PubMed] [Google Scholar]
- Matta JA, Pelkey KA, Craig MT, Chittajallu R, Jeffries BW, McBain CJ. (2013) Developmental origin dictates interneuron AMPA and NMDA receptor subunit composition and plasticity. Nat Neurosci 16:1032–1041. [DOI] [PMC free article] [PubMed] [Google Scholar]
- McBain CJ, Dingledine R. (1993) Heterogeneity of synaptic glutamate receptors on CA3 stratum radiatum interneurones of rat hippocampus. J Physiol 462:373–392. [DOI] [PMC free article] [PubMed] [Google Scholar]
- McKay S, Griffiths NH, Butters PA, Thubron EB, Hardingham GE, Wyllie DJA. (2012) Direct pharmacological monitoring of the developmental switch in NMDA receptor subunit composition using TCN 213, a GluN2A-selective, glycine-dependent antagonist. Br J Pharmacol 166:924–937. [DOI] [PMC free article] [PubMed] [Google Scholar]
- Monyer H, Burnashev N, Laurie DJ, Sakmann B, Seeburg PH. (1994) Developmental and regional expression in the rat brain and functional properties of four NMDA receptors. Neuron 12:529–540. [DOI] [PubMed] [Google Scholar]
- Mullasseril P, Hansen KB, Vance KM, Ogden KK, Yuan H, Kurtkaya NL, Santangelo R, Orr AG, Le P, Vellano KM, et al. (2010) A subunit-selective potentiator of NR2C- and NR2D-containing NMDA receptors. Nat Commun 1:90. [DOI] [PMC free article] [PubMed] [Google Scholar]
- Palmer GC. (2001) Neuroprotection by NMDA receptor antagonists in a variety of neuropathologies. Curr Drug Targets 2:241–271. [DOI] [PubMed] [Google Scholar]
- Paoletti P, Neyton J, Ascher P. (1995) Glycine-independent and subunit-specific potentiation of NMDA responses by extracellular Mg2+. Neuron 15:1109–1120. [DOI] [PubMed] [Google Scholar]
- Pelkey KA, Barksdale E, Craig MT, Yuan X, Sukumaran M, Vargish GA, Mitchell RM, Wyeth MS, Petralia RS, Chittajallu R, et al. (2015) Pentraxins coordinate excitatory synapse maturation and circuit integration of parvalbumin interneurons. Neuron 85:1257–1272. [DOI] [PMC free article] [PubMed] [Google Scholar]
- Pelkey KA, Lavezzari G, Racca C, Roche KW, McBain CJ. (2005) mGluR7 is a metaplastic switch controlling bidirectional plasticity of feedforward inhibition. Neuron 46:89–102. [DOI] [PubMed] [Google Scholar]
- Pelkey KA, Topolnik L, Lacaille JC, McBain CJ. (2006) Compartmentalized Ca(2+) channel regulation at divergent mossy-fiber release sites underlies target cell-dependent plasticity. Neuron 52:497–510. [DOI] [PubMed] [Google Scholar]
- Porter JT, Cauli B, Staiger JF, Lambolez B, Rossier J, Audinat E. (1998) Properties of bipolar VIPergic interneurons and their excitation by pyramidal neurons in the rat neocortex. Eur J Neurosci 10:3617–3628. [DOI] [PubMed] [Google Scholar]
- Preskorn S, Macaluso M, Mehra DO, Zammit G, Moskal JR, Burch RM, GLYX-13 Clinical Study Group (2015) Randomized proof of concept trial of GLYX-13, an N-methyl-D-aspartate receptor glycine site partial agonist, in major depressive disorder nonresponsive to a previous antidepressant agent. J Psychiatr Pract 21:140–149. [DOI] [PubMed] [Google Scholar]
- Preskorn SH, Baker B, Kolluri S, Menniti FS, Krams M, Landen JW. (2008) An innovative design to establish proof of concept of the antidepressant effects of the NR2B subunit selective N-methyl-D-aspartate antagonist, CP-101,606, in patients with treatment-refractory major depressive disorder. J Clin Psychopharmacol 28:631–637. [DOI] [PubMed] [Google Scholar]
- Rudolf GD, Cronin CA, Landwehrmeyer GB, Standaert DG, Penney JB, Jr, Young AB. (1996) Expression of N-methyl-D-aspartate glutamate receptor subunits in the prefrontal cortex of the rat. Neuroscience 73:417–427. [DOI] [PubMed] [Google Scholar]
- Santangelo Freel RM, Ogden KK, Strong KL, Khatri A, Chepiga KM, Jensen HS, Traynelis SF, Liotta DC. (2013) Synthesis and structure activity relationship of tetrahydroisoquinoline-based potentiators of GluN2C and GluN2D containing N-methyl-D-aspartate receptors. J Med Chem 56:5351–5381. [DOI] [PMC free article] [PubMed] [Google Scholar]
- Santangelo Freel RM, Ogden KK, Strong KL, Khatri A, Chepiga KM, Jensen HS, Traynelis SF, Liotta DC. (2014) Correction to synthesis and structure activity relationship of tetrahydroisoquinoline-based potentiators of GluN2C and GluN2D containing N-Methyl-d-aspartate receptors. J Med Chem 57:4975. [DOI] [PMC free article] [PubMed] [Google Scholar]
- Siegler Retchless B, Gao W, Johnson JW. (2012) A single GluN2 subunit residue controls NMDA receptor channel properties via intersubunit interaction. Nat Neurosci 15:406–413, S1–S2. [DOI] [PMC free article] [PubMed] [Google Scholar]
- Standaert DG, Landwehrmeyer GB, Kerner JA, Penney JB, Jr, Young AB. (1996) Expression of NMDAR2D glutamate receptor subunit mRNA in neurochemically identified interneurons in the rat neostriatum, neocortex and hippocampus. Brain Res Mol Brain Res 42:89–102. [DOI] [PubMed] [Google Scholar]
- Standaert DG, Testa CM, Young AB, Penney JB., Jr (1994) Organization of N-methyl-D-aspartate glutamate receptor gene expression in the basal ganglia of the rat. J Comp Neurol 343:1–16. [DOI] [PubMed] [Google Scholar]
- Stefanescu RA, Shore SE. (2015) NMDA receptors mediate stimulus-timing-dependent plasticity and neural synchrony in the dorsal cochlear nucleus. Front Neural Circuits 9:75 DOI: 10.3389/fncir.2015.00075. [DOI] [PMC free article] [PubMed] [Google Scholar]
- Swanger SA, Vance KM, Pare J-F, Sotty F, Fog K, Smith Y, Traynelis SF. (2015) NMDA receptors containing the GluN2D subunit control neuronal function in the subthalamic nucleus. J Neurosci 35:15971–15983. [DOI] [PMC free article] [PubMed] [Google Scholar]
- Sweatt JD. (2016) Neural plasticity & behavior: sixty years of conceptual advances. J Neurochem DOI:10.1111/jnc.13580 [published ahead of print]. [DOI] [PubMed] [Google Scholar]
- Talaei SA, Azami A, Salami M. (2016) Postnatal development and sensory experience synergistically underlie the excitatory/inhibitory features of hippocampal neural circuits: Glutamatergic and GABAergic neurotransmission. Neuroscience 318:230–243. [DOI] [PubMed] [Google Scholar]
- Thompson CL, Drewery DL, Atkins HD, Stephenson FA, Chazot PL. (2002) Immunohistochemical localization of N-methyl-D-aspartate receptor subunits in the adult murine hippocampal formation: evidence for a unique role of the NR2D subunit. Brain Res Mol Brain Res 102:55–61. [DOI] [PubMed] [Google Scholar]
- Traynelis SF, Wollmuth LP, McBain CJ, Menniti FS, Vance KM, Ogden KK, Hansen KB, Yuan H, Myers SJ, Dingledine R. (2010) Glutamate receptor ion channels: structure, regulation, and function. Pharmacol Rev 62:405–496. [DOI] [PMC free article] [PubMed] [Google Scholar]
- Vance KM, Hansen KB, Traynelis SF. (2012) GluN1 splice variant control of GluN1/GluN2D NMDA receptors. J Physiol 590:3857–3875. [DOI] [PMC free article] [PubMed] [Google Scholar]
- Vance KM, Hansen KB, Traynelis SF. (2013) Modal gating of GluN1/GluN2D NMDA receptors. Neuropharmacology 71:184–190. [DOI] [PMC free article] [PubMed] [Google Scholar]
- Verhoog MB, Goriounova NA, Obermayer J, Stroeder J, Hjorth JJJ, Testa-Silva G, Baayen JC, de Kock CPJ, Meredith RM, Mansvelder HD. (2013) Mechanisms underlying the rules for associative plasticity at adult human neocortical synapses. J Neurosci 33:17197–17208. [DOI] [PMC free article] [PubMed] [Google Scholar]
- Vicini S, Wang JF, Li JH, Zhu WJ, Wang YH, Luo JH, Wolfe BB, Grayson DR. (1998) Functional and pharmacological differences between recombinant N-methyl-D-aspartate receptors. J Neurophysiol 79:555–566. [DOI] [PubMed] [Google Scholar]
- von Engelhardt J, Bocklisch C, Tönges L, Herb A, Mishina M, Monyer H. (2015) GluN2D-containing NMDA receptors-mediate synaptic currents in hippocampal interneurons and pyramidal cells in juvenile mice. Front Cell Neurosci 9:95 DOI: 10.3389/fncel.2015.00095. [DOI] [PMC free article] [PubMed] [Google Scholar]
- Wyllie DJA, Livesey MR, Hardingham GE. (2013) Influence of GluN2 subunit identity on NMDA receptor function. Neuropharmacology 74:4–17. [DOI] [PMC free article] [PubMed] [Google Scholar]
- Xue J-G, Masuoka T, Gong X-D, Chen K-S, Yanagawa Y, Law SKA, Konishi S. (2011) NMDA receptor activation enhances inhibitory GABAergic transmission onto hippocampal pyramidal neurons via presynaptic and postsynaptic mechanisms. J Neurophysiol 105:2897–2906. [DOI] [PubMed] [Google Scholar]
- Yuan H, Low C-M, Moody OA, Jenkins A, Traynelis SF. (2015) Ionotropic GABA and glutamate receptor mutations and human neurologic diseases. Mol Pharmacol 88:203–217. [DOI] [PMC free article] [PubMed] [Google Scholar]