Abstract
Implicit solvent models offer an attractive way to estimate the effects of a solvent environment on the properties of small or large solutes without the complications of explicit simulations. One common test of accuracy is to compute the free energy of transfer from gas to liquid for a variety of small molecules, since many of these values have been measured. Studies of he temperature dependence of these values (i.e. solvation enthalpies and entropies) can provide additional insights into the performance of implicit solvent models. Here, we show how to compute temperature derivatives of hydration free energies for the 3D-RISM integral equation approach. Results for 1123 small drug-like molecules (both neutral and charged) in water are compared to results from molecular dynamics simulations and to experiment. The uncorrected results are rather poor, but it is known that errors are strongly correlated with the partial molar volumes of the solutes. We examine several linear solvation Gibbs energy correction schemes and extend them to deal with solvation ethalpies and entropies.
Keywords: hydration free energy, hydration energy, hydration entropy, 3D-RISM molecular theory of solvation, molecular modeling
1. Introduction
Accurate hydration free energies (HFEs) and entropies are critical to correctly predicting and understanding the outcome of most clinically relevant biochemical processes, including drug binding affinity and reaction rates. During drug development, experimental measurement of solvation thermodynamics is cost prohibitive due to the large number of candidate molecules that must be synthesized and tested. This has led to interest in calculating solvation thermodynamics using computer simulations. Unfortunately, the most accurate simulation methods, such as molecular dynamics (MD) and ab initio quantum mechanical methods (QM), use explicit atomic models of the solvent, making them computationally expensive and often take weeks or months to complete a single calculation [1–3] (although estimates of relative free energies of binding may be less expensive [4]). In response, faster, less accurate simulation methods have been developed which model the solvent as an implicit continuum, such as the generalized Born (GB) [5] and Poisson-Boltzmann (PB) [6, 7] methods. While PB in particular has had some success in predicting experimental and MD hydration free energies, it is unable to predict the location of the solvent molecules about the solute, and generally yields rather poor estimates for temperature derivatives [8, 9]. The spatial distribution of solvent molecules is often critical to understanding how solvation affects a particular reaction and can help improve the design of drug candidates. Statistical mechanical methods from liquid-state theory [10], such as density functional theory (DFT) [11, 12] or integral equation theories like molecular Ornstein-Zernike (MOZ) [13–15] and the reference interaction site model (RISM) [16–18], fill the gap between explicit and implicit solvent simulations. These methods typically make use of an atomic model of the solvent without explicitly modeling its motion in solution, allowing the methods to predict accurate solvent distributions, similar to explicit solvent models, while retaining the relatively low computational cost of implicit solvent models.
One promising integral equation method is the 3D-RISM [19–21], which extends the RISM to calculate three-dimensional solvent distributions about a solute, at a fraction of the computational expense of explicit solvent simulations. A known limitation of the 3D-RISM is its poor agreement with experimental solvation energies for small neutral molecules. Linear corrections for HNC-like closures have been proposed which increase the accuracy of the 3D-RISM solvation energies to be comparable with those of explicit solvent MD. Two such linear corrections are the Universal Correction (UC) [21, 22] and the Ng bridge correction (NgB) [23], both having correction terms related to the partial molar volume of the solvent. These linear corrections have found application both to DFT theories and the 3D-RISM. Though useful, these corrections have not yet been satisfactorily explained on physical grounds and require experimental parameterization to obtain best results. Recent work by Sergiievsky et al. [24, 25] has lead to a parameter free correction of similar quality to UC and NgB for which several physical explanations have been proposed [24, 26–28]. Gaining physical insight into why these corrections are needed may provide a deeper understanding of integral equation methods and point towards an analytic means of increasing their accuracy beyond what is possible with ad hoc corrections.
In this work we introduce 3D-RISM as a practical method to calculate solvation enthalpies and entropies. Used in combination with the aforementioned corrections, good quantitative agreement with experiment is achieved. Previously, the only way to obtain such a decomposition was using exceptionally taxing MD simulations [29–31], but now the 3D-RISM can be used to calculate accurate solvation energies and entropies for small molecules in a fraction of the time. Further, when compared to experiment, the decomposition indicates that the linear solvation energy corrections are mostly correcting the entropic term. Possible implications of this on the physical basis for the linear corrections and its relation to HNC-like closures will be discussed. These results provide insights into the physical realism of the 3D-RISM and suggest a path a to further improvements in the method.
2. Theory
2.1. Energy and Entropy
Decomposition of excess chemical potentials into energy and entropic contributions using temperature derivatives comes from Yu, Roux and Karplus [32, 33] and has been previously applied in a few applications [34–36].
In the canonical ensemble, the excess chemical potential, Δμ, due to a solvent site α is composed of the excess partial molar entropy, ΔsT,V, and partial molar energy, ΔεT,V [33]
| (1) |
To simplify the notation, we will omit T, V from this point on. The entropy can be expressed as the temperature derivative of the the excess chemical potential,
| (2) |
where
| (3) |
Inserting equation (2) into equation (1) we have
| (4) |
and
To obtain Δμα and its temperature derivative for a large macromolecule we employ 3D-RISM [19, 20, 37, 38] to compute the distribution of each solvent site:
| (5) |
where h (k) is the total correlation function, c (k) is the direct correlation function, is solvent susceptibility of solvent sites α and γ, precomputed by dielectrically consistent RISM (DRISM) [18, 39] and ˙̂ denotes the Fourier transform. Alternatively, this may be expressed in matrix notation
| (6) |
The temperature derivative is obtained by applying equation (3) to the 3D-RISM equation, equation (5), giving
| (7) |
where δTχ̂VV = ρδTĥVV is obtained from 1D-RISM.
equation (6) and (7) require closure equations to calculate a solution and provide an expression for Δμα and δTΔμα. The most popular closure equations used in RISM theory are the hypernetted chain equation (HNC) [40], Kovalenko-Hirata (KH) [19] and the partial series expansion of order-n [41], which all have closed form expressions for the excess chemical potential. As the results for HNC and KH can be obtained from PSE-n when n = ∞ and n = 1 respectively, we will restrict our attention to the PSE-n. Results for all closures are in Table 2.
Table 2.
Closure expression temperature derivatives and excess solvation energy equations for various common closures and corrections.
| Closure | Temperature Derivative | |
|---|---|---|
| KH |
|
|
| HNC | δTh(r) = g(r) δTt*(r) | |
| PSE-n |
|
|
| δTt*(r) = βu(r) + δTh(r) − δTc(r) | ||
|
| ||
| Closure | Excess Solvation Energy | |
|
| ||
| KH |
|
|
| HNC |
|
|
| PSE-n |
|
|
|
| ||
| Correction | Excess Solvation Energy | |
|
| ||
| GF |
|
|
| UCT | ΔεUCT = ΔεRISM + a(v − δTv) − Ta1v + b0 | |
| NgBT |
|
|
| PC+/3D-RISM |
|
|
The PSE-n expression for the closures is given as
| (8) |
and the excess chemical potential as
| (9) |
where Θ is the Heaviside step function. Applying equation (3) gives
| (10) |
The temperature derivative of the closure, necessary to solve the temperature derivative integral equation, is
| (11) |
2.2. Free Energy Corrections
While equation (9) is consistent with the PSE-n closure, in practice, hydration free energies calculated from this expression are too high, which has been linked to the non-polar component[42–44]. In response to this, a number corrections have been proposed that use a modified equation for the excess chemical potential while leaving the predicted solvent distributions unchanged.
For brevity, we will focus on the Universal Correction (UC) [45] and the pressure corrections known as PC+/3D-RISM [24, 25, 28]. We do not apply the recently developed Galvani correction for ions [46]. Details of the Gaussian fluctuations correction (GF) [47, 48], and the Ng Bridge Correction (NgB) [23] are presented in Appendix A. Temperature derivatives of these corrected free energy expressions yield an expression for the solvation energy, much like equation (10). Expressions for all these corrections can be found in Table 1 and Table 2.
Table 1.
Closure expressions and excess chemical potential equations for various common closures and corrections.
| Closure | Closure Relation | |
|---|---|---|
| KH |
|
|
| HNC | g(r) = exp(t*(r)) | |
| PSE-n |
|
|
| t*(r) = −βu(r) + h(r) − c(r) | ||
|
| ||
| Closure | Excess Chemical Potential | |
|
| ||
| KH |
|
|
| HNC |
|
|
| PSE-n |
|
|
|
| ||
| Correction | Excess Chemical Potential | |
|
| ||
| GF |
|
|
| UCT | ΔμUC = ΔμRISM + av + b | |
| NgBT |
|
|
| PC+/3D-RISM |
|
|
2.2.1. Universal Correction
The Universal Correction (UC) is a simple empirical correction to the RISM excess chemical potential [45],
| (12) |
where a and b are parameterized from experimental data and v, the partial molar volume (PMV), is calculated from equation (13). In the original presentation, the Gaussian fluctuation approximation (GF) [47, 48] was used for ΔμRISM, but subsequent studies have used the closure specific excess chemical potential with improved results [23, 49]. In what follows either the closure specific or Gaussian fluctuation approximation may be used (see Appendix Appendix A.1 for details of the GF temperature derivative). The parameterization must be repeated for any change in solvent composition, temperature or density. The expression shows considerable improvement for small, non-polar molecules in pure water.
Chong and Hirata [34] provide the following convenient expression for the PMV
| (13) |
where χT is the isothermal compressibility for the bulk solvent, calculated as [10, 50, 51]
| (14) |
For uncorrected excess chemical potential, the non-polar component, , can be obtained by setting all partial charges to zero. The polar component is then
For UC, the non-polar component is
where vNP is the partial molar volume of the chargeless solute. The polar component is computed as
Since solvent polarization component of the partial molar volume, vPol, is relatively small, the polar component of the excess chemical potential is only slightly changed.
In the original formulation, a and b are constants with no temperature dependence. However, as we show in Results, including a linear temperature dependence for these coefficients,
| (15) |
provides significantly improved results compared to experiment. Applying equation (3) to equation (12) we have
| (16) |
The temperature derivative of the PMV is
| (17) |
where δTχT is also pre-calculated with DRISM,
| (18) |
After some algebra, we have
Including this form of temperature dependence does not change the fitting procedure to determine a and b needed for hydration free energies. Only two new parameters need to be fit, a1 and b0, and can determined by fitting against empirical enthalpies or entropies at a single temperature.
The Ng Bridge Correction (NgB) [23] is similar in spirit to UC but contains an explicit temperature dependence and only one free parameter. Details of NgB can be found in Appendix A.2.
2.2.2. Pressure Correction
It is well known that the HNC family of closures overestimate solvent pressures by several orders of magnitude [10, 44]. While the mechanical, PΔV, work required to create a cavity for a small molecule is negligible at atmospheric pressure, the high pressures from the HNC closure lead to large solvation penalties in 3D-RISM. Recent work has sought to compensate for this excess mechanical work by subtracting this additional mechanical work from ΔμRISM [24, 28] and has been successfully applied to neutral and ionic small molecules [25, 28, 46].
The expression for pressure in these corrections was original proposed for DFT [24],
| (19) |
and later 3D-RISM [28]
| (20) |
where , χT is the calculated isothermal compressibility of the solvent and Nsite is the number of sites in the solvent. equation (19) has previously been derived as the contact pressure of a hard sphere solvent at an infinite hard wall for both DFT [52] and Ornstein-Zernike theory [53] using the HNC closure. These expressions are not the same as the bulk pressure calculated from the free energy route [54], which is too low to be used in the correction below. In fact, the pressure predicted by equation (20) is approximately 1.6 times that of the bulk pressure. This discrepancy between the pressure equations is expected due to known thermodynamic inconsistencies of the HNC closure [10]. However, it is not clear that equation (19) and equation (20) are applicable to a Lennard-Jones potential since previous derivations depend on the form of the potential [53].
Taking the PMV as the change in volume, pressure correction expressions for DFT and 3D-RISM have been proposed with (PC) and without (PC+) the ideal gas contribution included. PC+ has been observed to produce superior results for both DFT and 3D-RISM. For 3D-RISM, the PC+ expression has the form
| (21) |
For water, Nsite = 3, giving PC+/3D-RISM the same final form as PC/DFT, which is also known as the initial state correction (ISc) in the literature [25]. It should be noted that while the total PexpV may be negligible, the ideal and excess components are not. In particular, Pideal = 1354 atm for water at 298.15 K and 101325 Pa. It is therefore unclear why PC+ works better than PC.
As with UC, the polar/non-polar decomposition is straightforward:
and
The solvation energy is then
2.2.3. Long-Range Asymptotics
In order to compute solutions to equation (6) and (7), it is necessary to account for the long-range behavior of electrostatic interactions, which cannot be Fourier transformed due to divergence at small k. The use of long-range asymptotics [55–57] has been described for 1D-RISM and 3D-RISM [37, 38, 58–60].
As we are only concerned with pure water, we need only consider the long-range behavior of cα (r), which is approximated as
| (22) |
where qα is the charge of solvent site α, Qi and Ri are the partial charge and position of site i of NU solute sites, η is the charge smearing coefficient and erf is the error function. is subtracted from cα(r) before performing a forward Fourier transform and then
| (23) |
is added back in reciprocal space.
equation (7) also requires the temperature derivatives of equation (22) and 23:
and
| (24) |
3. Methods
3.1. Data Sets and Hydration Energy Data
Several sets of small molecule structures and their experimental hydration energies were obtained from previous publications for use in this work. These sets are labeled after the last name of one of their publication authors: Abagyan [61], Mobley [62], Rizzo [63], and Palmer [45]. Only the Rizzo set contains ionic molecules. Additionally, a solute set of 9 alkali halide ions was created using parameters from [44]. These sets were combined into a single small molecule database, including duplicate molecules whose structures differ due to use of different relaxation techniques among published sets.
In total the small molecule database contains 1123 molecules, consisting of 1075 neutral molecules, 39 monovalent ionic molecules, and 9 monovalent monoatomic ions, all with associated experimental Gibbs energies of hydration. To allow decomposing the enthalpic and entropic contributions to the Gibbs energies, experimental enthalpic and entropic energies of hydration were collected from the literature. Due to the relative sparsity of experimental entropic and enthalpic energies of hydration, only 74 molecules have their full experimental energy decomposition data. Datasets are again labeled using the last name of the first author: Abraham [64] and Cabani [65] (59 neutral molecules), Fawcett [66] (7 monovalent ionic molecules), and Marcus [67, 68] (8 monovalent monoatomic molecules). All experimental values are reported as being measured in standard thermodynamic conditions with temperatures between 298 and 298.15 K.
3.2. Solute Preparation
Antechamber was used to assign partial charges to all molecular atoms using the AM1-BCC semi-empirical model and the Amber GAFF [69] force field parameters, except for alkali halides which used Joung and Cheatham SCP/E parameters [70]. No structural alterations were made to the published molecules. A small set of molecules whose 3D-RISM calculations failed to converge were not used for correction model fitting.
3.3. Hydration Free Energy Calculations
All RISM calculations were performed using a modified version of AmberTools 15. Modifications will be released as part of AmberTools 16.
3.3.1. 1D-RISM Calculations
One 1D-RISM calculation was performed for each desired closure (KH, HNC, and PSE-3) for a total of three 1D-RISM calculations. Each calculation used the cSPC/E water model [71] (see Table Table 3) at 298 K on a simulation grid of 16,384 grid points separated by a grid spacing of 0.025 Å. Calculations were performed with a solvent dielectric of 78.497, water density of 55.345 M, and a target residual tolerance for the MDIIS solver set to 10−12.
Table 3.
Parameters of water models used in 1D-RISM calculations.
| Parameter | cSPC/E | |
|---|---|---|
| H Value | O Value | |
| mass (u) | 1.008 | 16 |
| charge (e+) | 0.4238 | −0.8476 |
| Lennard-Jones ε (J/C) | 0.01553 | 0.1553 |
| Lennard-Jones rmin/2 (Å) | 0.654237952 | 1.7767 |
| H-O bond length (Å) | 1 | |
| H-O-H bond angle (degrees) | 109.47° | |
3.3.2. 3D-RISM Calculations
The 3D-RISM calculations were performed for the KH, HNC, and PSE-3 closures. The 3D-RISM equation and its closure relation were solved on a 3D grid with infinite dilution boundary conditions. The simulation box was a cube with 30 Å side length and 0.3 Å grid spacing. Interaction potentials were given an infinite cut off. The modified direct inversion in the iterative subspace (MDIIS) solver was used to increase the rate of convergence of the integral equation solution [72]. In order to overcome convergence problems with PSE-3 and HNC, closure chaining was used. Here, a solution was obtained using a lower order closure and this solution was used as a starting point for solving the target closure. For PSE-3, solutions with KH and PSE-2 were used, while for the HNC closure, KH, PSE-2 and PSE-3 were chained together.
3.4. Parameter Fitting
Correction model parameters were fitted by bootstrap ordinary least squares (OLS) linear regression using the Python statsmodels module (version 0.6.1) [73]. Parameter fitting used only empirical data for neutral molecules from the Mobley, Abagyan, Rizzo and Palmer datasets. As with bootstrap analysis described below, the original data was resampled with replacement to obtain a new data set. An independent OLS fitting was performed on each resampled data set. The final values and confidence interval for each parameter was taken as the mean and standard error over all best fit parameters for each set or resampled data.
3.5. Model Testing
Testing of corrected and uncorrected expressions, with and without fit parameters, was done independently from parameter fitting and employed 1,000 rounds of bootstrap analysis and k-fold cross validation.
3.5.1. k-Fold Cross-Validation
The expected goodness of fit of each model, independent of the data used to train it, was estimated using k-fold cross-validation. To perform k-fold cross-validation, the sample is randomly divided into k equally sized subsamples. Each subsample is used once as test data for the model produced using the other k − 1 subsamples as training data. The statistics of the resulting k models and their test regressions form distributions which can be used to calculate the root mean squared error of the R2 regression factor. The error in the R2 factor provides a statistical estimate for the effect the particular small molecular solute sample has on goodness of fit of the correction regression. For this work k = 10 was chosen and the average taken over 1,000 cross-validations. Due to the small number of solutes in the Fawcett and Marcus datasets, k-fold cross-validation was not performed for the enthalpy/entropy decomposition of ions.
3.5.2. Bootstrap Analysis
Bootstrap regression analysis was used to obtain the confidence intervals for the fitted model parameters. In bootstrap analysis, a random sample of size N is obtained from the original sample, allowing the same sample member to be selected more than once (i.e., sampling with replacement). Regression is performed using the resampled data. This procedure is repeated many times. The statistics of the resulting regression models form distributions which can be used to calculate the desired confidence intervals for the fitting parameters. In this work N was chosen to be equal to the original sample size and 1,000 resamples were taken.
4. Results
In total, eight different corrections were tested with three different closures. Of these, the UC(T) and NgB corrections performed well against all closures. PC+/3D-RISM performed well with PSE-3 and HNC but not KH. As PC+/3D-RISM was derived for HNC, the poor performance with KH is not surprising. The original UC functional, UCGF(T), only performed well for the KH closure. Despite adding temperature dependence to the fit coefficient, NgBT did no better than NgB. This can be seen in parameterization (see Table 4) where γ0 is the dominate contribution to γ. In the case of UCT, the addition of temperature dependence to the coefficient is necessary and a1T is the dominate contribution to a at room temperature. In this, UCT, NgB and PC+/3D-RISM all give a linear temperature dependence to the PMV correction.
Table 4.
Fit parameters for UC(T) and NgB(T) corrections. Standard error in the last digit is given in parentheses.
| Correction | a | a0 | a1 | b | b0 | b1 |
|---|---|---|---|---|---|---|
| UC(T)-KH | −0.1499(7) | 0.008(7) | −0.00053(2) | −0.1(1) | −3.2(9) | 0.010(3) |
| UC(T)-PSE-3 | −0.1185(7) | 0.032(7) | −0.00051(2) | −0.3(1) | −3.2(9) | 0.010(3) |
| UC(T)-HNC | −0.1186(7) | 0.033(7) | −0.00051(2) | −0.2(1) | −3.2(9) | 0.010(3) |
|
| ||||||
| Correction | γ | γ0 | γ1 | |||
|
| ||||||
| NgB(T)-KH | 0.333(1) | 0.38(1) | −0.00015(4) | |||
| NgB(T)-PSE-3 | 0.366(1) | 0.31(1) | 0.00019(4) | |||
| NgB(T)-HNC | 0.364(1) | 0.31(1) | 0.00020(4) | |||
None of the three closures used performed significantly better or worse overall with UC(T) or NgB. PSE-3 generally has good agreement with experiment and molecular dynamics and typically has the same convergence properties as KH when the closure chaining protocol described in Methods is used. Furthermore, PC+/3D-RISM worked well with PSE-3 but not KH. For these reasons, our discussion focuses on PSE-3 but complete results for all closures and corrections can be found in ??. An archive of all Amber input and output files is available upon request.
4.1. Hydration Free Energies
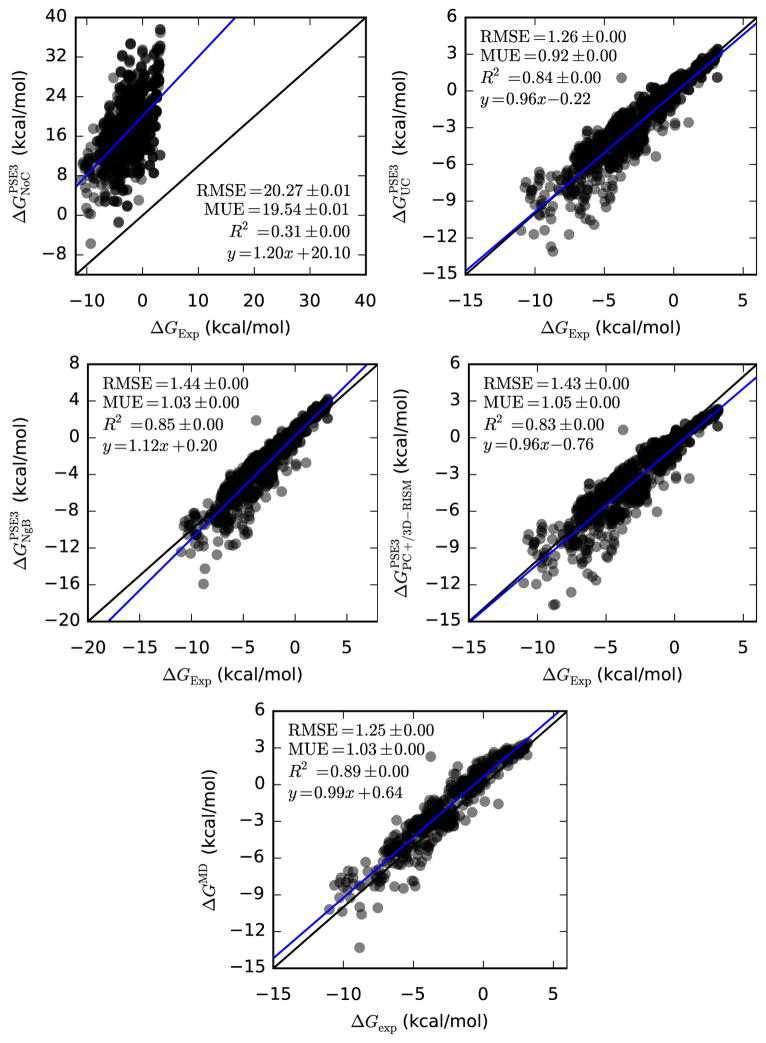
As expected, uncorrected 3D-RISM provides poor predictions of the HFE of small neutral molecules for all closures (for PSE-3, see Figure 1 and Table 5 and for all closures, see Table ??). R2 ranged from 0.218(1) to 0.305(1) for the three closures and the y-intercept, MUE and RMSE were approximately 20 kcal/mol or higher.
Figure 1.
Hydration free energies of neutral molecules (semi-transparent circles) from 3D-RISM-PSE-3 and MD vs. experiment (Mobley, Abagyan, Rizzo and Palmer datasets).
Table 5.
Bootstrap statistical comparison between predicted and empirical hydration free energies for neutral molecules (Mobley, Abagyan, Rizzo and Palmer datasets). As described in Methods, values are the mean of all resampled data. RMSE: root-mean-squared-error. MUE: mean unsigned error. Standard error in the last digit is given in parentheses.
| ΔG
| |||||
|---|---|---|---|---|---|
| Slope | y-intercept | R2 | RMSE | MUE | |
| PSE-3 | 1.20(8) | 20.1(4) | 0.306(1) | 20.275(8) | 19.538(8) |
| UC-PSE-3 | 0.96(2) | −0.22(5) | 0.8407(4) | 1.260(2) | 0.916(1) |
| NgB-PSE-3 | 1.12(2) | 0.20(6) | 0.8525(4) | 1.435(3) | 1.031(1) |
| PC+/3D-RISM-PSE-3 | 0.96(2) | −0.76(5) | 0.8321(5) | 1.431(2) | 1.054(1) |
| MD | 0.92(2) | −0.66(5) | 0.8586(4) | 1.186(1) | 0.918(1) |
UC-PSE-3, NgB-PSE-3 and PC+/3D-RISM-PSE-3 all compare favorably to experiment and are statistically quite close to MD. Results for UC-PSE-3 and PC+/3D-RISM-PSE-3 are extremely close for the PSE-3 closure and have identical slopes. The errors are, overall all, lower for UC-PSE-3, which is to be expected since UC-PSE-3 has been fit to the data. However, while PC+/3D-RISM performs well for PSE-3 and HNC, it is significantly worse with the KH closure, giving errors more than 2 kcal/mol (see Table ??). UCGF, the original correction proposed by Palmer et al. [45], gives results similar to UC for KH but shows large systematic errors for higher order closures with slopes of 1.30.
There is no clear best overall correction and closure combination, though UC has the lowest errors across all closures. We recommend against UCGF for all closures (even for KH, UC is better). We also recommend against PC+/3D-RISM for KH, due to the relatively large errors.
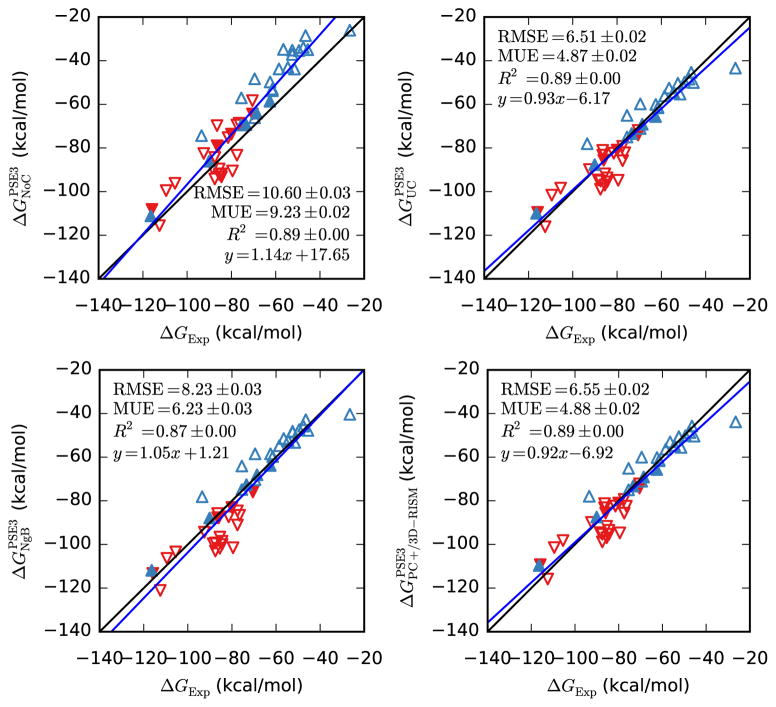
UC-PSE-3, NgB-PSE-3 and PC+/3D-RISM-PSE-3 all capture the slope of ionic solutes approximately as well as they do for neutral solutes and have improved R2 values. In absolute terms, the RMSE, MUE and the y-intercept are all significantly worse (see Figure 2 and Table 6) but the relative errors are similar to those of the neutral compounds.
Figure 2.
Hydration free energies of ions from 3D-RISM-PSE-3 vs. experiment (Rizzo dataset). Positive ions are blue triangles pointing up and negative ions are red triangles pointing down. Filled symbols are alkali-halide ions.
Table 6.
Bootstrap statistical comparison between predicted and empirical hydration free energies for ions (Rizzo dataset).
| ΔG
| |||||
|---|---|---|---|---|---|
| Slope | y-intercept | R2 | RMSE | MUE | |
| PSE-3 | 1.14(6) | 18(4) | 0.8938(8) | 10.60(3) | 9.23(2) |
| UC-PSE-3 | 0.93(5) | −6(4) | 0.8907(9) | 6.51(2) | 4.87(2) |
| NgB-PSE-3 | 1.05(6) | 1(4) | 0.871(1) | 8.23(3) | 6.23(3) |
| PC+/3D-RISM-PSE-3 | 0.92(5) | −7(4) | 0.8888(9) | 6.55(2) | 4.88(2) |
It is not immediately clear how much of this error is due to 3D-RISM and how much should be attributed to the force field or errors in the experimental data. The relatively simple case of monovalent ions highlights the problem (filled triangles in Figure 2). Empirical values are available from Refs. [74–76] and have a RMS difference of roughly 3 kcal/mol. We have used the Joung-Cheatham parameters [44], which are fit to data from Ref. [74] but, for comparison purposes, we use values from Ref. [75, 76]. Other ions in the data set have not received the same attention as the alkali-halide ions, contributing to the large absolute errors. Due to these uncertainties, the ion HFEs were not used in fitting UC, UCGF or NgB corrections.
4.1.1. Comparison Against Molecular Dynamics
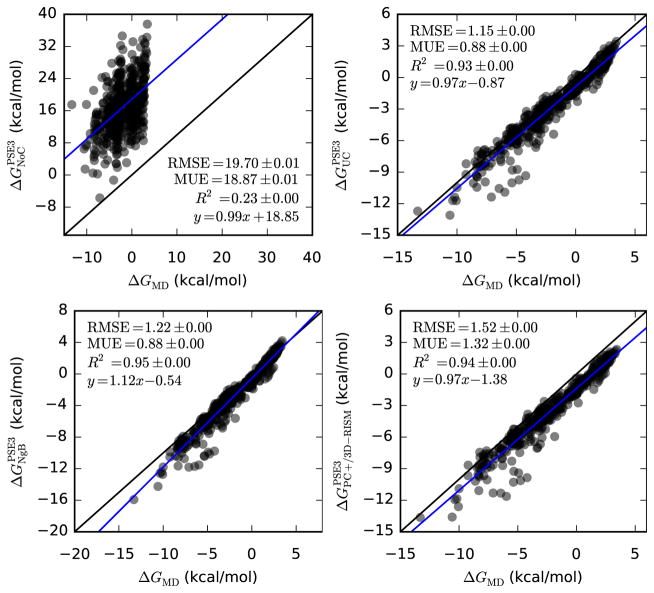
Since 3D-RISM and MD calculations share nearly the same force field, we might expect 3D-RISM to reproduce MD results better than experiment. Comparing Table 7 and Table 5 we see this is the case with R2 > 0.9 for all corrections, a significant improvement over the comparison to experiment.
Table 7.
Bootstrap statistical comparison between predicted and molecular dynamics hydration free energies for neutral molecules (Mobley dataset). As described in Methods, R2 bootstrap is the mean of all resampled data and R2 k-fold is the mean over all training sub-samples. RMSE: root-mean-squared-error. MUE: mean unsigned error.
| ΔG
| |||||
|---|---|---|---|---|---|
| Slope | y-intercept | R2 | RMSE | MUE | |
| PSE-3 | 0.99(8) | 18.9(3) | 0.232(1) | 19.697(8) | 18.866(8) |
| UC-PSE-3 | 0.97(1) | −0.87(3) | 0.9321(3) | 1.145(2) | 0.883(1) |
| NgB-PSE-3 | 1.12(1) | −0.54(3) | 0.9467(2) | 1.224(2) | 0.881(1) |
| PC+/3D-RISM-PSE-3 | 0.97(1) | −1.38(3) | 0.9392(3) | 1.519(2) | 1.320(1) |
Despite the improved correlations, RMSE, MUE and the absolute y-intercept between PC+/3D-RISM and MD are larger than those between 3D-RISM and experiment. This is despite having despite having improved correlation coefficients and slightly improved slopes. This can be understood by observing the y-intercept was negative relative to the experimental data while MD over estimated experimental data by 0.64(5) kcal/mol. This relative shift then contributes to the RMSE and MUE values.
There are also several factors that affect the ability of 3D-RISM to reproduced MD results. Certainly, approximations in RISM theory contribute to some of the differences between 3D-RISM and MD. Modifying the water model by adding a Lennard-Jones potential to the water hydrogens also contributes, as does setting the dielectric constant of water to 78.497, rather than that of SPC/E. In addition, we fit UC and NgB against experimental data and did not optimize to reproduce MD results.
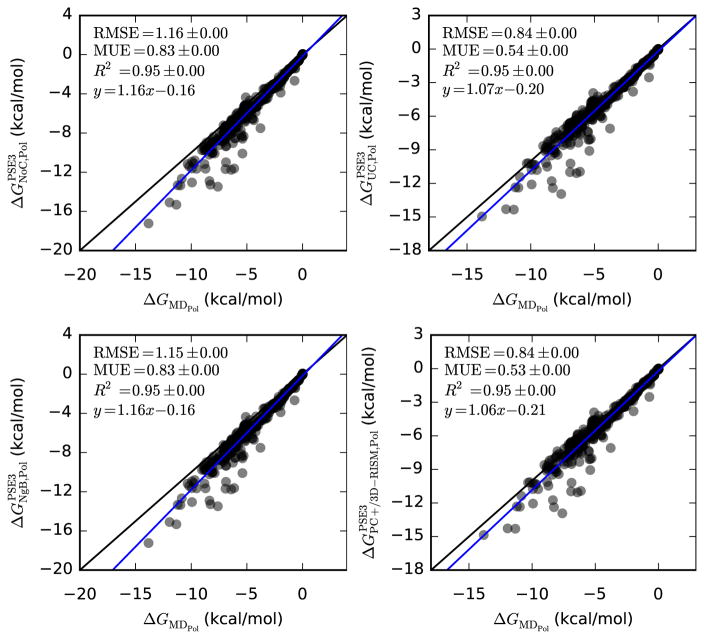
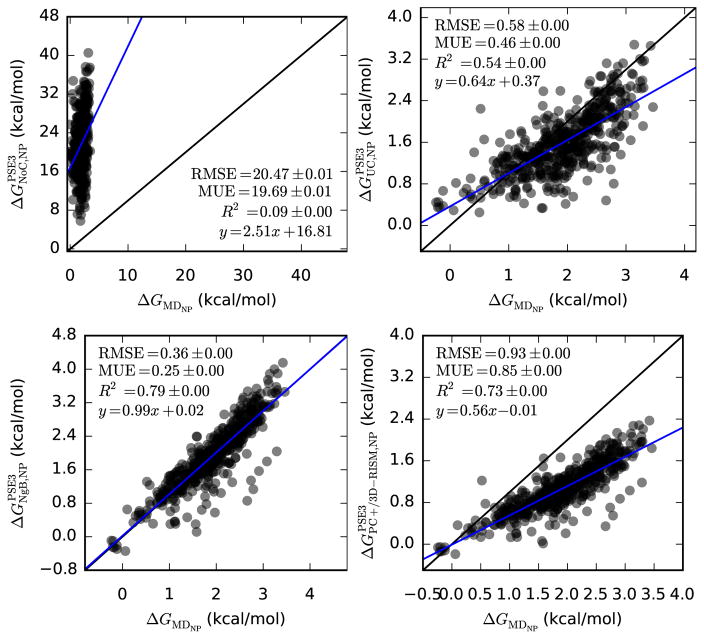
MD data also allows us to compare polar and non-polar contributions to the free energy. Previous work has suggested that the polar component calculated by 3D-RISM is in good agreement with MD [23, 44, 77] while the non-polar contribution is the primary source of error [23, 43]. Indeed, uncorrected 3D-RISM data is much better for just the polar component (see Table 8 and Figure 4) and is generally poor for the non-polar component (see Table 9 and Figure 5).
Table 8.
Bootstrap statistical comparison between predicted and molecular dynamics solvent polarization hydration free energies for neutral molecules (Mobley dataset).
| ΔGPol
| |||||
|---|---|---|---|---|---|
| Slope | y-intercept | R2 | RMSE | MUE | |
| PSE-3 | 1.16(1) | −0.16(3) | 0.9528(2) | 1.162(2) | 0.832(1) |
| UC-PSE-3 | 1.07(1) | −0.20(4) | 0.9468(3) | 0.840(2) | 0.5375(9) |
| NgB-PSE-3 | 1.16(1) | −0.16(4) | 0.9536(2) | 1.155(2) | 0.829(1) |
| PC+/3D-RISM-PSE-3 | 1.06(1) | −0.21(4) | 0.9458(3) | 0.836(2) | 0.5332(9) |
Figure 4.
Hydration free energies of solvent polarization for neutral molecules from 3D-RISM-PSE-3 vs. MD (Mobley dataset). Coloring as in Table 5.
Table 9.
Bootstrap statistical comparison between predicted and molecular dynamics non-polar hydration free energies for neutral molecules (Mobley dataset).
| ΔGNP
| |||||
|---|---|---|---|---|---|
| Slope | y-intercept | R2 | RMSE | MUE | |
| PSE-3 | 2.5(4) | 16.8(7) | 0.0949(8) | 20.473(8) | 19.693(8) |
| UC-PSE-3 | 0.64(3) | 0.37(5) | 0.542(1) | 0.5849(7) | 0.4605(5) |
| NgB-PSE-3 | 0.99(2) | 0.02(4) | 0.7932(8) | 0.3571(6) | 0.2456(4) |
| PC+/3D-RISM-PSE-3 | 0.56(2) | −0.01(3) | 0.7289(9) | 0.9321(5) | 0.8529(5) |
Figure 5.
Non-polar hydration free energies of neutral molecules from 3D-RISM-PSE-3 vs. MD (Mobley dataset). Coloring as in Table 5.
All of the corrections perform as well, as or better than uncorrected 3D-RISM for the polar SFE with the exception of UCGF with PSE-3 or HNC and NgB (see Table ??). Even with these included, R2 > 0.92 for all corrections and closures. That NgB does not show improvement is due to the nature of the correction, which only effects the non-polar contribution (see equation (A.4)). The improvement in the other corrections is due to the electrostriction effect, which accounts for the polar component of the PMV. In particular, UC-PSE-3 and PC+/3D-RISM-PSE-3 show improvement over uncorrected 3D-RISM with MUE ≈ 0.54 kcal/mol and RMSE ≈ 0.84 kcal/mol.
As previously noted, the non-polar contribution to solvation free energy predicted by 3D-RISM is extremely poor (see Table 9 and Figure 5). All corrections substantially improve the prediction of ΔGNP but the extent to which they do varies considerably. NgB performs the best across all closures with slopes and y-intercepts within error of 1.0 and 0.0 respectively. NgB also has the lowest RMSE and MUE and the highest R2. UC-PSE-3 and PC+/3D-RISM-PSE-3 do improve greatly over uncorrected 3D-RISM but do not have the predictive power of NgB-PSE-3. UC-PSE-3 has both poor slope and R2 but the limited range of the data means that the RMSE and MUE are still reasonably good. In contrast, PC+/3D-RISM-PSE-3 has an R2 only slightly smaller than NgB-PSE-3 but the slope, RMSE and MUE are all worse than UC-PSE-3. Of course, UC and PC+/3D-RISM have the same dependence on PMV but differ in how the coefficients are obtained. If UC was fit against MD data instead of experiment, we would expect UC results to be at least as good as PC+/3D-RISM in this comparison.
4.2. Hydration Energies and Entropies
4.2.1. Solvation Energies/Enthalpies
Care must be taken when comparing 3D-RISM data against solvation enthalpy and entropy from experiment. As discussed in Section 2 and Ref. [33], the temperature derivative data presented here are properly the solvation energy and entropy at constant volume. This difference will be small and is estimated to be on the order of 1 kcal/mol [33]. Since the the coefficients for UCT, UCGFT, and NgBT corrections were fit against enthalpy data, we can claim that these are models that predict enthalpy and the associated constant pressure entropy.
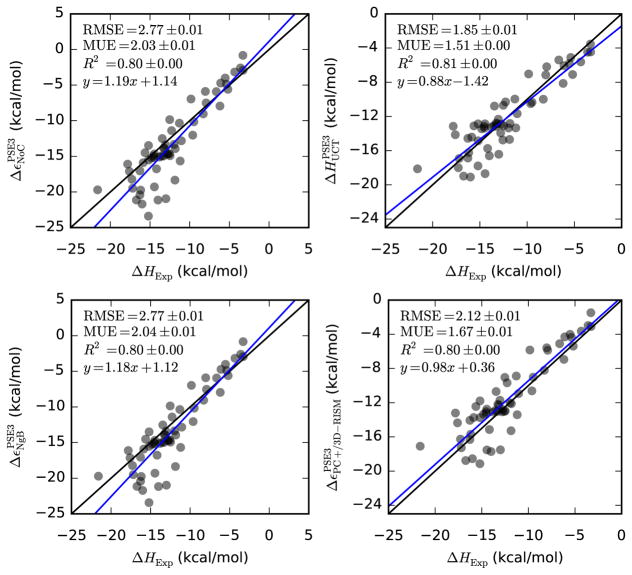
Uncorrected 3D-RISM performs reasonably well for neutral molecules with all three closures (see Table 10, Table ?? and Figure 6) and much better than for SFE. For all three closures R2 ≈ 0.80, RMSE < 2.8 kcal/mol and MUE < 2.4 kcal/mol, which is good considering that we are comparing enthalpies and energies and expect the error to be on the order of 1 kcal/mol at a minimum. NgB and NgBT provide nearly identical results with each other and with uncorrected 3D-RISM. Combined with the parameterization of γ0 and γ1 (see Table 4) it is clear that NgB has the correct temperature dependence. UC, on the other hand, has RMSE > 19 kcal/mol for all closures and requires temperature dependence to be added to both coefficients. With this temperature dependence added, UCT performs quite well and has the lowest RMSE and MUE of any correction. R2 and y-intercept from UCT are both quite close to values from no correction and NgB. PC+/3D-RISM also performs well. It has a slope and y-intercept within error of 1.0 and 0.0. R2 is identical to no correction, NgB and UCT. RMSE and MUE close to those of UCT and better than NgB. Overall, the quality of 3D-RISM’s treatment of enthalpies is similar to its treatment of the polar SFE. In both cases only small correction are needed and are made.
Table 10.
Bootstrap statistical comparison between predicted ΔH (all UC and NgB corrections) or Δε (uncorrected 3D-RISM and parameter free corrections) and ΔH from experiment for neutral molecules (Abraham and Cabani datasets).
| ΔH/Δε
| |||||
|---|---|---|---|---|---|
| Slope | y-intercept | R2 | RMSE | MUE | |
| PSE-3 | 1.19(7) | 1.1(8) | 0.799(2) | 2.77(1) | 2.028(8) |
| UCT-PSE-3 | 0.88(5) | −1.4(6) | 0.805(1) | 1.853(5) | 1.508(5) |
| NgB-PSE-3 | 1.18(7) | 1.1(8) | 0.799(2) | 2.77(1) | 2.036(8) |
| PC+/3D-RISM-PSE-3 | 0.98(6) | 0.4(7) | 0.797(2) | 2.120(6) | 1.673(6) |
Figure 6.
Hydration energies/enthalpies of neutral molecules from 3D-RISM-PSE-3 vs. experiment (Abraham and Cabani datasets). Coloring as in Table 5.
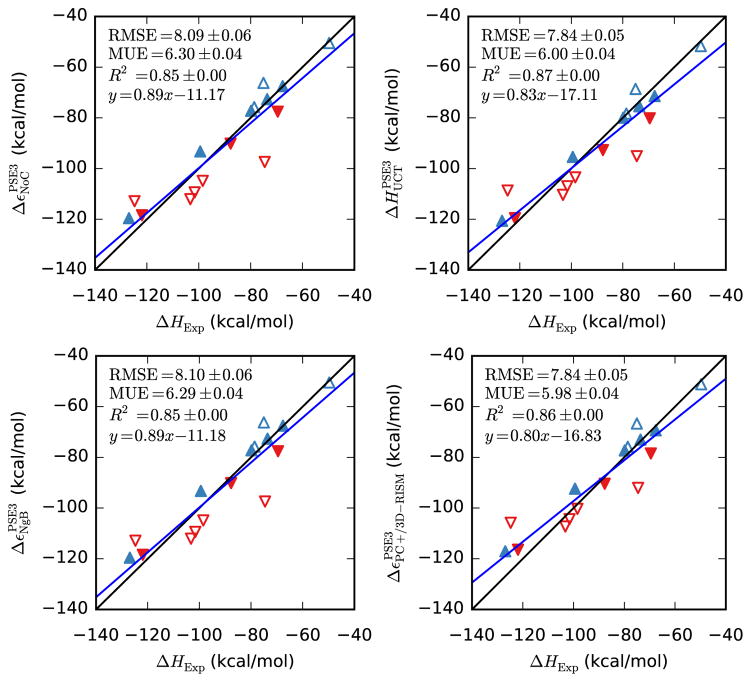
When we consider the energy/enthalpy of ionic solutes, the absolute errors are much larger, just as they were for the SFE, but the relative errors are similar to those of neutral compounds and correlation is improved. Again, there is little difference between uncorrected 3D-RISM and the corrections and NgB is nearly identical to uncorrected 3D-RISM is all metrics. Similarly, PC+/3D-RISM and UC are slightly better than NgB in terms of RMSE and MUE. The values of the RMSE, MUE and y-intercept are all larger than observed for the SFE of ionic solutes. The errors in the y-intercept are particularly large but, again, so are the statistical errors as the sample size is becoming much smaller.
4.2.2. Solvation Entropies
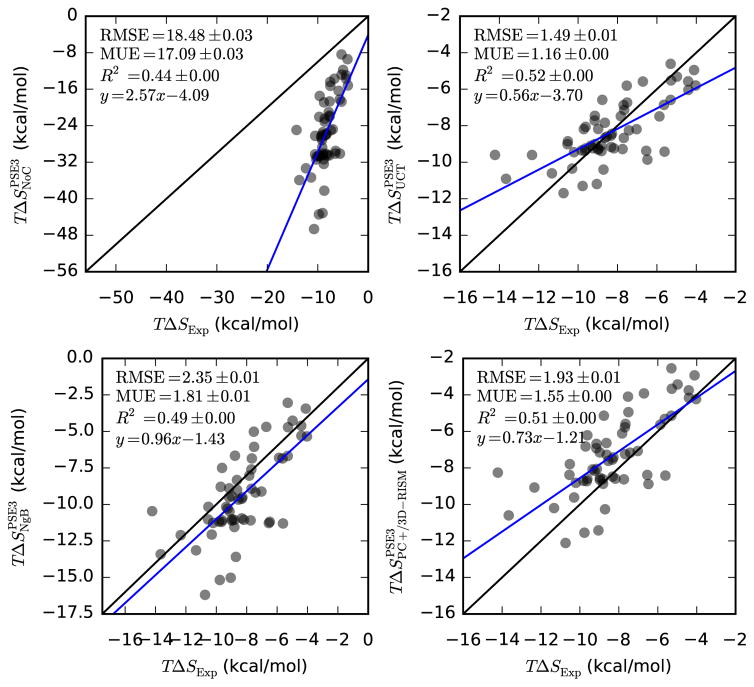
Entropies, like the non-polar SFE contributions, are poorly handled by 3D-RISM and are a large source of error (see Table 12 and Figure 8). Of the three most successful corrections, NgB has the best slope and intercept but, given the low R2, this may not be meaningful. PC+/3D-RISM and UCT both have lower errors than NgB. While the errors for UCT are only slightly larger in magnitude than those for the SFE of small neutral molecules (see Figure 1) the low R2 means that comparing relative solvation entropies may not be useful. Entropy is also the only quantity that shows a clear closure dependence, with statistics improving as the closure order is increased.
Table 12.
Bootstrap statistical comparison between predicted TΔSP (all UC and NgB corrections) or TΔSV (uncorrected 3D-RISM and parameter free corrections) and TΔSP from experiment for neutral molecules (Abraham and Cabani datasets).
|
TΔS
| |||||
|---|---|---|---|---|---|
| Slope | y-intercept | R2 | RMSE | MUE | |
| PSE-3 | 2.6(5) | −4(4) | 0.443(3) | 18.48(3) | 17.09(3) |
| UCT-PSE-3 | 0.56(8) | −3.7(7) | 0.521(3) | 1.495(5) | 1.157(4) |
| NgB-PSE-3 | 1.0(1) | −1(1) | 0.491(3) | 2.347(8) | 1.807(6) |
| PC+/3D-RISM-PSE-3 | 0.7(1) | −1.2(9) | 0.509(3) | 1.929(6) | 1.553(5) |
Figure 8.
Hydration entropies of neutral molecules from 3D-RISM-PSE-3 vs. experiment (Abraham and Cabani datasets). Coloring as in Table 5.
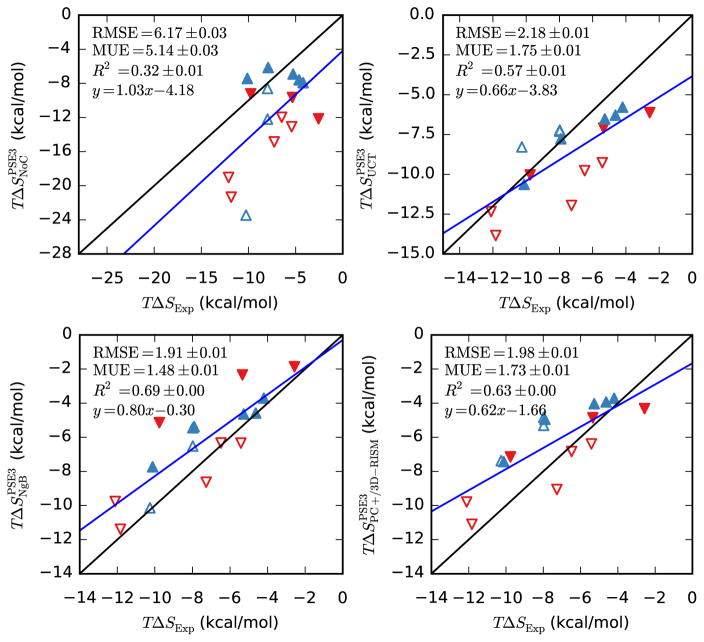
The solvation entropies of ionic solutes is quite similar to that of neutral molecules. The magnitudes of the values and errors as well as the quality of the corrections are qualitatively the same between the two data sets. The major differences for the corrections are that the R2 values are slightly higher for ionic solutes and that NgB has the lowest errors and UCT the highest instead of the other way around.
5. Conclusions
We have presented a new implementation of temperature derivatives in 3D-RISM, capable of efficiently calculating solvation energies and entropies of charged and neutral small molecules. Accuracy comparable to that of explicit solvent molecular dynamics simulations is achieved through the use of different correction methods. While a number of corrections have been proposed in the literature, we found that only UC(T) and NgB are applicable to all closures, while PC+/3D-RISM works with PSE-n closures for n ≥ 3. UC with the Gaussian fluctuation free energy functional only works with the KH closure.
The physical basis of these corrections is to mitigate the effects of the excessively high pressures predicted by the HNC-like closures used here. Due to the over-estimation of pressure, additional mechanical work is included in the 3D-RISM excess chemical potential calculation and must be subtracted off. The PMV accounts for the change in volume required to accommodate the solute. Since the leading contribution to the PMV is the van der Waals size of the solute, UCT and PC+/3D-RISM corrections primarily improve the non-polar and entropic components of the SFE. However, the PMV also depends on the charge state of the solute through the electrostriction effect. UCT and PC+/3D-RISM also improve the polar and energetic components of the SFE as a result while NgB does not. To compensate for the extra mechanical work, several expressions for pressure are available, including the bulk pressure from the compressibility and energy routes, and the contact pressure. However, only the contact pressure on the solute, as used in PC+/3D-RISM, successfully mitigates the excess mechanical work. The fact that these pressure expressions give different quantitative results is symptomatic of the larger inconsistencies in the HNC closure.
While these corrections are of practical use in calculating solvation free energies and their decomposition, they do not address the underlying deficiencies in the closures. Further improvements in 3D-RISM and related methods will require new closure approximations that avoid these inconsistencies.
Figure 3.
Hydration free energies of neutral molecules from 3D-RISM-PSE-3 vs. MD (Mobley dataset). Coloring as in Figure 1.
Figure 7.
Hydration energies/enthalpies of ions from 3D-RISM-PSE-3 vs. experiment. Coloring as in Figure 2.
Figure 9.
Hydration entropies of ions from 3D-RISM-PSE-3 vs. experiment. Coloring as in Figure 2 (Fawcett and Marcus datasets).
Table 11.
Bootstrap statistical comparison between predicted ΔH (all UC and NgB corrections) or Δε (uncorrected 3D-RISM and parameter free corrections) and ΔH from experiment for ions (Fawcett and Marcus datasets).
| ΔH/Δε
| |||||
|---|---|---|---|---|---|
| Slope | y-intercept | R2 | RMSE | MUE | |
| PSE-3 | 0.89(9) | −11(8) | 0.853(2) | 8.09(6) | 6.30(4) |
| UCT-PSE-3 | 0.83(9) | −17(9) | 0.869(2) | 7.84(5) | 6.00(4) |
| NgB-PSE-3 | 0.89(9) | −11(8) | 0.850(3) | 8.10(6) | 6.29(4) |
| PC+/3D-RISM-PSE-3 | 0.80(8) | −17(8) | 0.864(2) | 7.84(5) | 5.98(4) |
Table 13.
Bootstrap statistical comparison between predicted TΔSP (all UC and NgB corrections) or TΔSV (uncorrected 3D-RISM and parameter free corrections) and TΔSP from experiment for ions (Fawcett and Marcus datasets).
|
TΔS
| |||||
|---|---|---|---|---|---|
| Slope | y-intercept | R2 | RMSE | MUE | |
| PSE-3 | 1.0(5) | −4(3) | 0.322(6) | 6.17(3) | 5.14(3) |
| UCT-PSE-3 | 0.7(1) | −3.8(10) | 0.573(5) | 2.18(1) | 1.75(1) |
| NgB-PSE-3 | 0.8(1) | −0.3(9) | 0.686(5) | 1.91(1) | 1.48(1) |
| PC+/3D-RISM-PSE-3 | 0.6(1) | −1.7(8) | 0.626(5) | 1.984(7) | 1.733(8) |
Acknowledgments
TL thanks Daniel Borgis and Stefan Kast for useful discussions regarding the pressure in 3D-RISM and DFT calculations. This work was supported in part by NIH grant GM103297 (DAC). A.K. acknowledges support from the National Institute for Nanotechnology, National Research Council of Canada, University of Alberta, and Natural Sciences and Engineering Research Council of Canada.
Appendix A. Other Corrections
Appendix A.1. Gaussian Fluctuation Approximation
The Gaussian fluctuation approximation (GF) [47, 48] has been shown to produce better results than HNC in many [48, 78] but not all [43, 49] cases. It has the form
| (A.1) |
Applying equation (3) we have
| (A.2) |
This gives
| (A.3) |
Appendix A.2. Ng Bridge Correction
Closely related to the UC, Truchon et al. [23] proposed the following correction
| (A.4) |
where is the non-polar CDF of oxygen – calculated with the solute charges turned off – ρO is the bulk number density of oxygen and γ is an adjustable parameter. While the KH closure was originally used, here we apply the correction to any PSE-n closure, which includes KH when n = 1.
Since NgB uses only non-polar terms to correction ΔμRISM, the polar/non-polar decomposition is simply
From this we see that the correction does not change the polar component of the solvation free energy.
As with UC, we apply a linear temperature dependence to the fit parameter,
We will denote the linear temperature dependence as NgBT. Taking the temperature derivative we have
Using for equation (10) we have
Without the temperature dependence, we have
As with UC, the temperature dependence of γ does not change the fitting procedure to obtain accurate solvation free energies and only one new parameter needs to be fit against empirical enthalpies and entropies. For testing purposes, we will denote the original correction NgB and NgBT when γ1 is included.
References
- 1.Rocklin GJ, Mobley DL, Dill KA, Hünenberger PH. J Chem Phys. 2013;139:184103. doi: 10.1063/1.4826261. [DOI] [PMC free article] [PubMed] [Google Scholar]
- 2.Kaus JW, Pierce LT, Walker RC, McCammon JA. J Chem Theory Comput. 2013;9:4131–4139. doi: 10.1021/ct400340s. [DOI] [PMC free article] [PubMed] [Google Scholar]
- 3.Mikulskis P, Genheden S, Ryde U. J Chem Inf Model. 2014;54:2794–2806. doi: 10.1021/ci5004027. [DOI] [PubMed] [Google Scholar]
- 4.Wang L, Wu Y, Deng Y, Kim B, Pierce L, Krilov G, Lupyan D, Robinson S, Dahlgren MK, Greenwood J, Romero DL, Masse C, Knight JL, Steinbrecher T, Beuming T, Damm W, Harder E, Sherman W, Brewer M, Wester R, Murcko M, Frye L, Farid R, Lin T, Mobley DL, Jorgensen WL, Berne BJ, Friesner RA, Abel R. J Am Chem Soc. 2015;137:2695–2703. doi: 10.1021/ja512751q. [DOI] [PubMed] [Google Scholar]
- 5.Still WC, Tempczyk A, Hawley RC, Hendrickson T. J Am Chem Soc. 1990;112:6127–6129. [Google Scholar]
- 6.Honig B, Nicholls A. Science. 1995;268:1144–1149. doi: 10.1126/science.7761829. [DOI] [PubMed] [Google Scholar]
- 7.Baker NA, Bashford D, Case DA. Implicit Solvent Electrostatics in Biomolecular Simulation. In: Leimkuhler B, Chipot C, Elber R, Laaksonen A, Mark A, Schlick T, Schütte C, Skeel R, editors. New Algorithms for Macromolecular Simulation (Lecture Notes in Computational Science and Engineering no 49) Springer; Berlin Heidelberg: 2006. pp. 263–295. [DOI] [Google Scholar]
- 8.Roux B, Yu HA, Karplus M. J Phys Chem. 1990;94:4683–4688. [Google Scholar]
- 9.Hünenberger P, Reif M. Single-Ion Solvation: Experimental and Theoretical Approaches to Elusive Thermodynamic Quantities. Royal Society of Chemistry; 2011. [Google Scholar]
- 10.Hansen JP, McDonald IR. Theory of Simple Liquids. Academic Press; 2006. [Google Scholar]
- 11.Evans R. Adv Phys. 1979;28:143–200. [Google Scholar]
- 12.Zhao S, Ramirez R, Vuilleumier R, Borgis D. J Chem Phys. 2011;134:194102. doi: 10.1063/1.3589142. [DOI] [PubMed] [Google Scholar]
- 13.Blum L. J Chem Phys. 1972;57:1862–1869. [Google Scholar]
- 14.Ikeguchi M, Doi J. J Chem Phys. 1995;103:5011–5017. [Google Scholar]
- 15.Ishizuka R, Yoshida N. J Chem Phys. 2013;139:084119. doi: 10.1063/1.4819211. [DOI] [PubMed] [Google Scholar]
- 16.Chandler D, Andersen HC. J Chem Phys. 1972;57:1930–1937. [Google Scholar]
- 17.Hirata F, Rossky PJ, Pettitt BM. J Chem Phys. 1983;78:4133–4144. [Google Scholar]
- 18.Perkyns J, Pettitt BM. J Chem Phys. 1992;97:7656–7666. [Google Scholar]
- 19.Kovalenko A, Hirata F. J Chem Phys. 1999;110:10095–10112. [Google Scholar]
- 20.Beglov D, Roux B. J Phys Chem B. 1997;101:7821–7826. [Google Scholar]
- 21.Ratkova EL, Palmer DS, Fedorov MV. Chem Rev. 2015;115:6312–6356. doi: 10.1021/cr5000283. [DOI] [PubMed] [Google Scholar]
- 22.Palmer DS, Frolov AI, Ratkova EL, Fedorov MV. J Phys: Condens Matter. 2010;22:492101. doi: 10.1088/0953-8984/22/49/492101. [DOI] [PubMed] [Google Scholar]
- 23.Truchon JF, Pettitt BM, Labute P. J Chem Theory Comput. 2014;10:934–941. doi: 10.1021/ct4009359. [DOI] [PMC free article] [PubMed] [Google Scholar]
- 24.Sergiievskyi VP, Jeanmairet G, Levesque M, Borgis D. J Phys Chem Lett. 2014:1935–1942. doi: 10.1021/jz500428s. [DOI] [PubMed] [Google Scholar]
- 25.Misin M, Fedorov MV, Palmer DS. J Chem Phys. 2015;142:091105. doi: 10.1063/1.4914315. [DOI] [PubMed] [Google Scholar]
- 26.Chong SH, Ham S. J Chem Theory Comput. 2015;11:378–380. doi: 10.1021/ct500876x. [DOI] [PubMed] [Google Scholar]
- 27.Li B, Matveev AV, Rösch N. Comput Theor Chem. 2015;1070:143–151. [Google Scholar]
- 28.Sergiievskyi V, Jeanmairet G, Levesque M, Borgis D. J Chem Phys. 2015;143:184116. doi: 10.1063/1.4935065. [DOI] [PubMed] [Google Scholar]
- 29.Peter C, Oostenbrink C, Dorp Av, Gunsteren WFv. J Chem Phys. 2004;120:2652–2661. doi: 10.1063/1.1636153. [DOI] [PubMed] [Google Scholar]
- 30.Guillot B, Guissani Y, Bratos S. J Chem Phys. 1991;95:3643–3648. [Google Scholar]
- 31.Horinek D, Mamatkulov SI, Netz RR. J Chem Phys. 2009;130:124507. doi: 10.1063/1.3081142. [DOI] [PubMed] [Google Scholar]
- 32.Yu H, Karplus M. J Chem Phys. 1988;89:236. [Google Scholar]
- 33.Yu H, Roux B, Karplus M. J Chem Phys. 1990;92:5020. [Google Scholar]
- 34.Chong S, Hirata F. J Phys Chem B. 1997;101:3209–3220. [Google Scholar]
- 35.Yamazaki T, Blinov N, Wishart D, Kovalenko A. Biophys J. 2008;95:4540–4548. doi: 10.1529/biophysj.107.123000. [DOI] [PMC free article] [PubMed] [Google Scholar]
- 36.Yamazaki T, Kovalenko A, Murashov VV, Patey GN. J Phys Chem B. 2010;114:613–619. doi: 10.1021/jp908814t. [DOI] [PubMed] [Google Scholar]
- 37.Kovalenko A, Hirata F. J Chem Phys. 2000;112:10391–10402. [Google Scholar]
- 38.Kovalenko A. Three-dimensional rism theory for molecular liquids and solid-liquid interfaces. In: Hirata F, editor. Molecular theory of solvation. chap 4. Kluwer Academic Publishers; 2003. pp. 175–262. [Google Scholar]
- 39.Perkyns JS, Pettitt BM. Chem Phys Lett. 1992;190:626–630. [Google Scholar]
- 40.Morita T. Prog Theor Phys. 1958;20:920. [Google Scholar]
- 41.Kast SM, Kloss T. J Chem Phys. 2008;129:236101. doi: 10.1063/1.3041709. [DOI] [PubMed] [Google Scholar]
- 42.Chuev GN, Fedorov MV, Chiodo S, Russo N, Sicilia E. J Comput Chem. 2008;29:2406–2415. doi: 10.1002/jcc.20979. [DOI] [PubMed] [Google Scholar]
- 43.Genheden S, Luchko T, Gusarov S, Kovalenko A, Ryde U. J Phys Chem B. 2010;114:8505–8516. doi: 10.1021/jp101461s. [DOI] [PubMed] [Google Scholar]
- 44.Joung IS, Luchko T, Case DA. J Chem Phys. 2013;138:044103. doi: 10.1063/1.4775743. [DOI] [PMC free article] [PubMed] [Google Scholar]
- 45.Palmer DS, Frolov AI, Ratkova EL, Fedorov MV. J Phys Condens Matter. 2010;22:492101. doi: 10.1088/0953-8984/22/49/492101. [DOI] [PubMed] [Google Scholar]
- 46.Misin M, Fedorov MV, Palmer DS. J Phys Chem B. 2016 doi: 10.1021/acs.jpcb.6b05352. [DOI] [PubMed] [Google Scholar]
- 47.Chandler D, Singh Y, Richardson D. J Chem Phys. 1984;81:1975–1982. [Google Scholar]
- 48.Ichiye T, Chandler D. J Phys Chem. 1988;92:5257–5261. [Google Scholar]
- 49.Huang W, Blinov N, Kovalenko A. J Phys Chem B. 2015;119:5588–5597. doi: 10.1021/acs.jpcb.5b01291. [DOI] [PubMed] [Google Scholar]
- 50.Eu B, Rah K. J Chem Phys. 1999;111:3327–3338. [Google Scholar]
- 51.McQuarrie DA. Statistical Mechanics. University Science Books; 2000. [Google Scholar]
- 52.Rickayzen G, Augousti A. Mol Phys. 1984;52:1355–1366. [Google Scholar]
- 53.Carnie SL. J Chem Phys. 1981;74:1472. [Google Scholar]
- 54.Singer S, Chandler D. Mol Phys. 1985;55:621–625. [Google Scholar]
- 55.Springer JF, Pokrant MA, Stevens FA. J Chem Phys. 1973;58:4863. [Google Scholar]
- 56.Ng K. J Chem Phys. 1974;61:2680–2689. [Google Scholar]
- 57.Abernethy GM, Gillan MJ. Mol Phys. 1980;39:839. [Google Scholar]
- 58.Kovalenko A, Hirata F. J Chem Phys. 2000;112:10403–10417. [Google Scholar]
- 59.Kinoshita M, Hirata F. J Chem Phys. 1996;104:8807–8815. [Google Scholar]
- 60.Gusarov S, Pujari BS, Kovalenko A. J Comput Chem. 2012;33:1478–1494. doi: 10.1002/jcc.22974. [DOI] [PubMed] [Google Scholar]
- 61.Bordner AJ, Cavasotto CN, Abagyan RA. J Phys Chem B. 2002;106:11009–11015. [Google Scholar]
- 62.Mobley DL, Dill KA, Chodera JD. J Phys Chem B. 2008;112:938–946. doi: 10.1021/jp0764384. [DOI] [PMC free article] [PubMed] [Google Scholar]
- 63.Rizzo RC, Aynechi T, Case DA, Kuntz ID. J Chem Theory Comput. 2006;2:128–139. doi: 10.1021/ct050097l. [DOI] [PubMed] [Google Scholar]
- 64.Abraham MH, Whiting GS, Fuchs R, Chambers EJ. J Chem Soc, Perkin Trans 2. 1990;291 [Google Scholar]
- 65.Cabani S, Gianni P, Mollica V, Lepori L. J Solution Chem. 1981;10:563–595. [Google Scholar]
- 66.Fawcett WR. J Phys Chem B. 1999;103:11181–11185. [Google Scholar]
- 67.Marcus Y, Loewenschuss A. Annual Reports Section “C” (Physical Chemistry) 1984;81:81–135. [Google Scholar]
- 68.Marcus Y. J Chem Soc, Faraday Trans 1 F. 1987;83:339–349. [Google Scholar]
- 69.Wang J, Wolf RM, Caldwell JW, Kollman PA, Case DA. J Comput Chem. 2004;25:1157–1174. doi: 10.1002/jcc.20035. [DOI] [PubMed] [Google Scholar]
- 70.Joung IS, Cheatham TE. J Phys Chem B. 2008;112:9020–9041. doi: 10.1021/jp8001614. [DOI] [PMC free article] [PubMed] [Google Scholar]
- 71.Luchko T, Gusarov S, Roe DR, Simmerling C, Case DA, Tuszynski J, Kovalenko A. J Chem Theory Comput. 2010;6:607–624. doi: 10.1021/ct900460m. [DOI] [PMC free article] [PubMed] [Google Scholar]
- 72.Kovalenko A, Ten-no S, Hirata F. J Comput Chem. 1999;20:928–936. [Google Scholar]
- 73.Seabold S, Perktold J. Statsmodels: Econometric and statistical modeling with python. Proceedings of the 9th Python in Science Conference. 2010:57–61. [Google Scholar]
- 74.Schmid R, Miah AM, Sapunov VN. Phys Chem Chem Phys. 2000;2:97–102. [Google Scholar]
- 75.Aaqvist J. J Phys Chem. 1990;94:8021–8024. [Google Scholar]
- 76.Li J, Zhu T, Hawkins GD, Winget P, Liotard DA, Cramer CJ, Truhlar DG. Theor Chem Acc. 1999;103:9–63. [Google Scholar]
- 77.Luchko T, Gusarov S, Roe DR, Simmerling C, Case DA, Tuszynski J, Kovalenko A. J Chem Theory Comput. 2010;6:607–624. doi: 10.1021/ct900460m. [DOI] [PMC free article] [PubMed] [Google Scholar]
- 78.Lee PH, Maggiora GM. J Phys Chem. 1993;97:10175–10185. [Google Scholar]


