

ABSTRACT
Concerns have been raised that in-feed chlortetracycline (CTC) may increase antimicrobial resistance (AMR), specifically tetracycline-resistant (TETr) Escherichia coli and third-generation cephalosporin-resistant (3GCr) E. coli. We evaluated the impact of a 5-day in-feed CTC prophylaxis on animal health, TETr E. coli, and 3GCr E. coli. A control group of cattle (n = 150) received no CTC, while a CTC group (n = 150) received in-feed CTC (10 mg/lb of body weight/day) from the 5th to the 9th day after feedlot arrival. Over 25% (38/150) of the animals in the control group developed illnesses requiring therapeutic treatment with antimicrobials critically important to human medicine. Only two animals (1.3%) in the CTC group required such treatments. Fecal swab and pen surface occurrences of generic E. coli (isolated on media that did not contain antimicrobials of interest and were not isolated based on any specific resistance), TETr E. coli, and 3GCr E. coli were determined on five sampling occasions: arrival at the feedlot, 5 days posttreatment (5 dpt), 27 dpt, 75 dpt, and 117 dpt. On 5 dpt, TETr E. coli concentrations were higher for the CTC group than the control group (P < 0.01). On 27 dpt, 75 dpt, and 117 dpt, TETr E. coli concentrations did not differ between groups. 3GCr E. coli occurrences did not differ between control and CTC groups on any sampling occasion. For both groups, generic, TETr, and 3GCr E. coli occurrences were highest on 75 dpt and 117 dpt, suggesting that factors other than in-feed CTC contributed more significantly to antimicrobial-resistant E. coli occurrence.
IMPORTANCE The occurrence of human bacterial infections resistant to antimicrobial therapy has been increasing. It has been postulated that antimicrobial resistance was inevitable, but the life span of the antimicrobial era has been prematurely compromised due to the misuse of antimicrobials in clinical and agricultural practices. Direct evidence relating the use of antimicrobials in livestock production to diminished human health outcomes due to antimicrobial resistance is lacking, and the U.S. Food and Drug Administration has taken an approach to maximize therapeutic efficacy and minimize the selection of resistant microorganisms through judicious use of antimicrobials. This study demonstrated that prophylactic in-feed treatment of chlortetracycline administered for 5 days to calves entering feedlots is judicious, as this therapy reduced animal morbidity, reduced the use of antimicrobials more critical to human health, and had no long-term impact on the occurrence of antimicrobial-resistant E. coli.
INTRODUCTION
In-feed and in-water uses of medically important antimicrobials for the control and prevention of diseases have become controversial, because it is argued that they unnecessarily expose healthy animals to medically important antimicrobials and possibly increase the spread of antimicrobial resistance (AMR) (1–3). Restricting the use of medically important antimicrobials in food animal production has been suggested as a means to reduce AMR (1, 3–5). Conversely, studies have reported only small quantitative risks of human-pathogenic bacteria acquiring AMR due the use of antimicrobials in food animal production (6–9). By the end of 2016, in-feed and in-water applications of medically important antimicrobials for growth promotion purposes will be banned in the United States (10). Henceforth, the U.S. Food and Drug Administration (FDA) will require a Veterinary Feed Directive for all in-feed and in-water applications of medically important antimicrobials (11). Regardless, concerns remain that restricting the prophylactic in-feed and in-water uses of medically important antimicrobials may negatively affect animal welfare, increase therapeutic veterinary uses of antimicrobials of higher importance to human medicine, and increase zoonotic pathogen load and transmission (12).
Beef cattle are susceptible to bovine respiratory disease (BRD) during weaning and transitioning into feedlots (13, 14). In-feed chlortetracycline (CTC) is an option for the management of BRD currently employed at U.S. cattle feedlots (15, 16). CTC, tetracycline (TET), and oxytetracycline compose the naturally occurring first-generation tetracycline antimicrobial class (here referred to as tetracyclines). In 2014, tetracyclines, considered important to human medicine, were the largest portion of antimicrobials sold in the United States for use in food-producing animals (17, 18).
TET resistance in Escherichia coli is commonly associated with the presence of either tet(A) or tet(B) genes (19, 20). The third-generation cephalosporin (3GC) class of antimicrobials is considered critically important to human medicine (18). 3GC resistance in E. coli can be conferred by blaCMY-2 harbored by IncA/C plasmids, which also contain tet(A) (21). Thus, it is possible that in-feed CTC use in feedlot cattle may coselect and thereby increase the occurrence of 3GC resistance (22). The objective of this study was to evaluate the effect of a one-time 5-day in-feed CTC prophylaxis on animal health (morbidity and body weight gain), occurrence of tetracycline-resistant (TETr) E. coli, and occurrence of 3GC-resistant (3GCr) E. coli over a 4-month follow-up period.
MATERIALS AND METHODS
Experimental design.
Three hundred weaned calves (150 steers and 150 heifers, born between 3 August 2014 and 30 September 2014) from the U.S. Meat Animal Research Center (USMARC) cow-calf production system were used for this trial. Calves arrived at the USMARC feedlot on 9 February 2015. Calves (blocked on birth date, arrival body weight, and sex) were randomly assigned to two groups (150 calves/treatment group). On 14 February 2015, 150 calves (5 pens with 30 calves/pen) received CTC-medicated feed (Aureomycin, chlortetracycline complex equivalent to 10 mg/lb of body weight/day of chlortetracycline; Zoetis, Kalamazoo, MI) (CTC group) for five consecutive days (last CTC-medicated feed was distributed on 18 February 2015). The remaining 150 calves were used as a control (5 pens with 30 calves/pen) and received feed without CTC throughout the experiment (control group). Empty pens separated the groups from each other and from nonstudy animals. Three empty pens were included in this study (empty group). The calves were fed standard diets typical of feedlot operations, according to the feedlot feeding protocol (see Table S1 in the supplemental material). Body weights were measured upon arrival and subsequently during sampling occasions. Common watering troughs were shared between adjacent pens in the same treatment group. Animals were monitored by cattle operations staff and received normal veterinary care as required. Animals that required any therapeutic antimicrobial treatment were removed from the experiment. The U.S. Meat Animal Research Center Institutional Animal Care and Use Committee approved this experiment (USMARC IACUC no. 3040-42000-014-07).
Sample collection and processing.
Fecal swabs, pen surface material, feed, and water samples were collected on five occasions: at feedlot arrival (arrival, 9 February 2015), 5 days posttreatment (5 dpt, 23 February 2015), 27 days posttreatment (27 dpt, 17 March 2015), 75 days posttreatment (75 dpt, 4 May 2015), and 117 days posttreatment (117 dpt, 15 June 2015). Fecal swabs were collected directly from the rectum using a foam-tipped swab (VWR International, Buffalo Grove, IL). Swabs were placed into 15-ml conical tubes containing 5 ml of tryptic soy broth with phosphate buffer (TSB-PO4; 30 g of TSB, 2.31 g of KH2PO4, and 12.54 g of K2HPO4 per liter; Becton Dickinson, Sparks, MD). Each pen was divided into similarly sized quadrants. In each quadrant, the pen surface was sampled by using a gloved hand to place handfuls of material from the pen surface (i.e., avoiding obvious fecal pats and no digging) into a sterile bag from multiple locations within the quadrant until approximately 25 g was obtained. Thus, four samples per pen were collected from all pens, including the three empty pens. One water trough sample from each trough (4 for CTC group and 3 for control group) was collected by wetting a sterile sponge (Whirl-Pak; Nasco, Fort Atkinson, WI) in the trough, sponging the interior sides of the trough, including the water line, and then placing the sponge into a sterile bag. In addition, plastic bags were used to collect one fresh feed sample per pen immediately after feed was dispensed from the truck into the feed bunk, prior to contact by any animals. All samples were transported to the laboratory and were processed on the same day.
Fecal swabs were homogenized by vortexing for 30 s, after which a 1-ml aliquot was removed for enumeration. The remaining fecal suspension was enriched at 42°C for 8 h and then held at 4°C until secondary enrichments were performed the following day. Water trough sponge samples were homogenized by hand massaging the sample bags for 15 s, and a 1-ml aliquot was removed for enumeration. Homogenized water trough sponge samples were combined with 80 ml of TSB-PO4 and then incubated at 25°C for 2 h, 42°C for 6 h, and held at 4°C until secondary enrichments were performed the following day. For pen surface materials and feed samples, 10 g of the samples was transferred to filter barrier bags, and 90 ml of TSB-PO4 was added. From each sample suspension, a 1-ml aliquot was removed and used for enumeration. The remaining pen surface and feed sample suspensions were then enriched at 25°C for 2 h, 42°C for 6 h, and held at 4°C until secondary enrichments were performed the following day.
Enumeration and detection of generic, 3GCr, and TETr E. coli.
Generic (isolated on media that did not contain antimicrobials of interest and were not isolated based on any specific resistance), 3GCr, and TETr E. coli bacteria were each enumerated and detected as previously described (23, 24). Briefly, 50 μl of the enumeration aliquot or an appropriate dilution of the enumeration aliquot was spirally plated using Autoplate 4000 (Spiral Biotech, Norwood, MA) onto CHROMagar E. coli (DRG International, Mountainside, NJ) with no supplemental antimicrobials (CEC), CEC supplemented with 2 mg/liter cefotaxime (CEC + CTX), or CEC supplemented with 32 mg/liter tetracycline (CEC + TET). Antimicrobials were obtained from Sigma-Aldrich Corp., St. Louis, MO, and the antimicrobial concentrations were based on previous reports (19, 23, 24). Tetracycline was used in agar medium at 32 mg/liter, rather than the 16 mg/liter resistance breakpoint used by the National Antimicrobial Resistance Monitoring System (25), as in our experience, 16 mg/liter tetracycline in agar medium results in large numbers of false-positive colonies. Agar plates were incubated at 37°C for 24 h. Blue colonies were considered presumptive E. coli colonies and were enumerated with an automated colony counter (ProtoCOL 3; Synbiosis, Frederick, MD) (19, 23, 24).
Secondary enrichments were prepared by inoculating 0.5 ml of the primary enrichment cultures into 2.5 ml of MacConkey broth (Becton Dickinson, Sparks, MD) with no supplemental antimicrobials (MCB), 2.5 ml of MCB supplemented with 2.4 mg/liter cefotaxime (MCB + CTX), or 2.5 ml of MCB supplemented with 38.4 mg/liter tetracycline (MCB + TET), as previously described (19, 23, 24). After incubation at 42°C for 18 h, MCB, MCB + CTX, and MCB + TET secondary enrichment cultures were streaked on CEC, CEC + CTX, and CEC + TET agar plates, respectively, and incubated at 37°C for 18 h to detect generic, 3GCr, and TETr E. coli, respectively. From each plate, up to two presumptive colonies were inoculated into TSB and incubated overnight at 37°C. Colony lysates were prepared from overnight enrichment cultures using BAX DNA buffer (DuPont Qualicon, Inc., Wilmington, DE), according to the manufacturer's instructions. The colony lysates were used to confirm presumptive E. coli by using multiplex PCR targeting lacY, lacZ, cyd, and uidA genes (26).
Statistical analysis.
The effect of CTC prophylaxis on body weight was evaluated by multilevel mixed-effects linear regression with a maximum likelihood estimation method in which treatment and sampling date were modeled as fixed effects, while repeated measures of animals over time and pen were modeled as random effects. The impact of CTC prophylaxis on the morbidity of the animals was assessed by survival analysis with Cox proportional hazards regression model, and hazard ratio (HR) was calculated to compare the hazard of morbidity between the CTC and control groups (27). Times to event of morbidity (in days) were recorded as they occurred and later used in the survival analysis. End of the study was considered the last day of the follow-up period.
In order to analyze the data sets, zero values were replaced using the following criteria. The convention was to assign concentration values to samples that were prevalence positive (above the lower limit of detection [LLOD] for the prevalence assay) but enumeration negative (below the lower limit of enumeration [LLOE] for the enumeration assay). For samples that fell into this category, the midpoint between detection limits for each sample type was used to fill the zero values. Samples that were below the LLOD for the prevalence assay were assigned a value 1 log less than the LLOD for the prevalence assay for each sample type.
Fecal swab sample enumeration plate counts were converted to log10 CFU per swab values. For fecal swab samples, the LLOE was 2.00 log10 CFU/swab, and the theoretical LLOD was 0.00 log10 CFU/swab. Fecal swab samples with no E. coli colonies on enumeration plates but with E. coli colonies on prevalence plates were judged prevalence positive and enumeration negative (PP-EN) and were assigned a concentration of 1.00 log10 CFU/swab, because these samples were assumed to have concentrations between 0.00 and 2.00 log10 CFU/swab. Fecal swab samples with no E. coli colonies on enumeration and prevalence plates were judged prevalence negative (PN) and were assigned a concentration of −1.00 log10 CFU/swab, because these samples were assumed to have concentrations of <0.00 log10 CFU/swab.
Pen surface sample and feed sample enumeration plate counts were converted to log10 CFU per gram of sample values. For pen surface and feed samples, the LLOE was 2.30 log10 CFU/g, and the LLOD was −1.00 log10 CFU/g. Pen surface and feed PP and EN samples were assigned a concentration of 0.65 log10 CFU/g, since these samples were assumed to have concentrations between −1.00 and 2.30 log10 CFU/g. Pen surface and feed PN samples were assigned a concentration of −2.00 log10 CFU/g, since these samples were assumed to have concentrations of less than −1.00 log10 CFU/g.
Each water trough sponge sample was assumed to contain 20 ml of liquid. Water trough sample enumeration plate counts were converted to log10 CFU per milliliter of water values. For water trough samples, the LLOE was 1.30 log10 CFU/ml, and the LLOD was −1.30 log10 CFU/ml. Water trough PP-EN samples were assigned a concentration of 0.00 log10 CFU/ml, since these samples were assumed to have concentrations between −1.30 and 1.30 log10 CFU/ml. Water trough PN samples were assigned a concentration of −2.30 log10 CFU/ml, since these samples were assumed to have concentrations of less than −1.30 log10 CFU/ml.
For each sampling occasion, pen-level generic, TETr, and 3GCr E. coli mean and 95% confidence intervals were determined for fecal swab and pen surface sample concentrations from multilevel mixed-effects linear regression models, as described above. For each sampling occasion, pen-level generic, TETr, and 3GCr E. coli fecal swab and pen surface mean prevalences (%) were determined from multilevel mixed-effects logistic regression models. Multiple comparisons were adjusted for by Bonferroni method. In this experiment, our experimental unit was pen, as CTC was given in the feed. Our unit of analysis was individual samples (fecal swabs, pen surface, and feed or water samples) for the concentration data or E. coli colony for the prevalence data. All statistical analyses were conducted in STATA 13 (StataCorp LP, College Station, TX). P values less than 5% or 95% confidence intervals were used to make inferences.
RESULTS
Description of animal characteristics.
At arrival, mean body weight, age, and prior antimicrobial treatments did not significantly (P > 0.05) differ between the two treatment groups (Table 1). Out of the 12 calves that received antimicrobial treatments prior to the study, the most common (9/12) antimicrobial administered was ceftiofur sodium (Naxcel; Zoetis).
TABLE 1.
Animal characteristics at feedlot arrival
| Variable | Control group | CTC group | P value |
|---|---|---|---|
| No. of animals | 150 | 150 | |
| No. of females | 60 | 90 | 0.001a |
| No. that received prior antimicrobial treatment | 8 | 4 | 0.234a |
| Oxytetracycline | 0 | 1 | |
| Oxytetracycline and tildipirosin | 1 | 0 | |
| Ceftiofur sodium | 6 | 3 | |
| Florfenicol | 1 | 0 | |
| Body wt (mean ± SE) (kg) | 181.3 ± 2.3 | 180.9 ± 2.3 | 0.893b |
| Age (mean ± SE) (mo) | 5.6 ± 0.0 | 5.5 ± 0.0 | 0.678b |
P values are based on likelihood ratio test comparing the proportions between the two groups.
P values are based on two sample t test comparing the mean values between the two groups.
Mean body weight, morbidity, and therapeutic antimicrobials administered.
Mean body weights did not significantly differ (P > 0.05) between the treatment groups across all sampling occasions (see Fig. S1 in the supplemental material). Cumulative morbidities were 38 and 2 animals in the control and CTC groups, respectively, and survival analysis showed that cattle in the control group were 28 times more likely to become sick than those in the CTC group (HR, 27.9; 95% confidence interval [CI], 6.7 to 116.5; P < 0.001) (Fig. 1). Pneumonia (37/40 animals) was the most common diagnosis, and tildipirosin (a macrolide) was the most common (38/40 animals) therapeutic antimicrobial treatment given (see Table S2 in the supplemental material).
FIG 1.

Kaplan-Meier survival plot for the evaluation of the effect of chlortetracycline (CTC) prophylaxis on cattle morbidity. Solid line represents the CTC group. Dashed line represents the control group.
Fecal swab occurrences of generic, TETr, and 3GCr E. coli.
Arrival fecal swab generic E. coli concentrations did not differ (P = 0.98) between the control (4.73 log10 CFU/swab) and CTC (4.81 log10 CFU/swab; Fig. 2A) groups. Similarly, arrival fecal swab TETr E. coli concentrations did not differ (P = 0.76) between the control (3.12 log10 CFU/swab) and CTC (3.34 log10 CFU/swab) groups (Fig. 2B). At 5 dpt, CTC group fecal swab generic E. coli (4.70 log10 CFU/swab) and TETr E. coli (4.25 log10 CFU/swab) concentrations were higher (P < 0.01) than their respective control group concentrations (generic E. coli, 3.51 log10 CFU/swab; TETr E. coli, 1.86 log10 CFU/swab). The control group 5 dpt fecal swab generic and TETr E. coli concentrations were lower (P < 0.01) than the arrival concentrations. Conversely, the CTC group 5 dpt fecal swab generic E. coli concentration did not differ (P = 0.99) from the arrival concentration, while the 5 dpt TETr E. coli concentration was higher (P < 0.01) than that during arrival. At 27 dpt, fecal swab generic E. coli concentrations did not differ (P = 0.93) between groups, nor did concentrations differ from their respective arrival concentrations (control group, P = 1.00; CTC group, P = 0.69). Similarly, 27 dpt fecal swab TETr E. coli concentrations did not differ between groups (P = 0.99) and did not differ (control group, P = 0.35; CTC group, P = 0.79) from their respective arrival concentrations (Fig. 2A and B).
FIG 2.
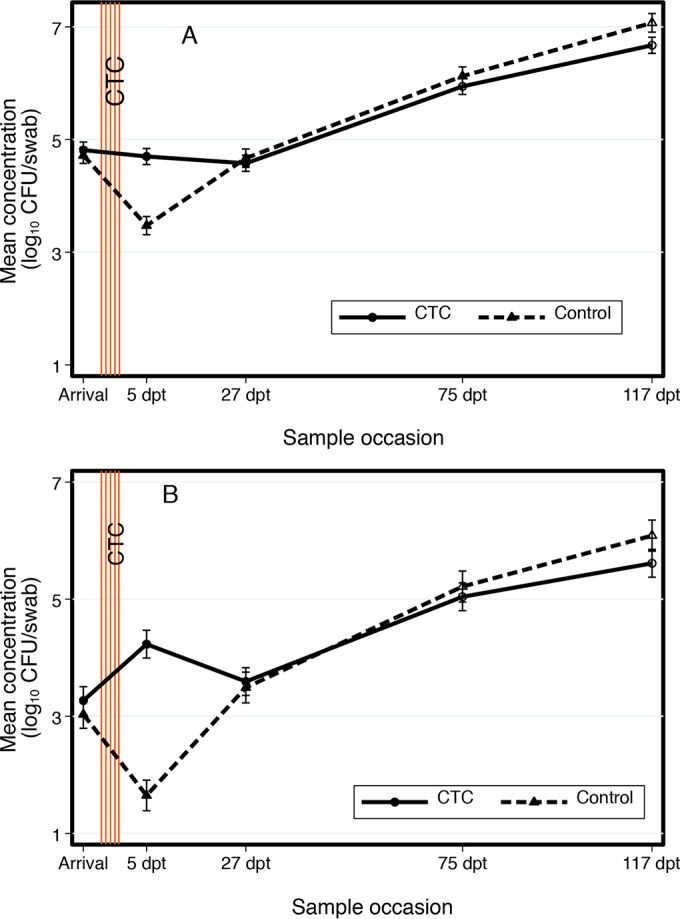
Pen-level fecal swab concentrations of generic (A) and tetracycline-resistant (B) E. coli. Solid line represents the CTC group. Dashed line represents the control group. Error bars represent 95% confidence intervals for the mean concentrations.
For both groups, 75 dpt fecal swab generic E. coli concentrations (control group, 6.13 log10 CFU/swab; CTC group, 5.94 log10 CFU/swab) increased compared to earlier sampling occasions (P < 0.05) but did not differ from each other (P = 0.63). Likewise, 75 dpt fecal swab TETr E. coli concentrations (control group, 5.22 log10 CFU/swab; CTC group, 5.04 log10 CFU/swab) were higher than earlier sampling occasions (P < 0.05) but did not differ from each other (P = 0.90). At 117 dpt, the control group fecal swab concentration of generic E. coli was higher (P = 0.01) than that of the CTC group concentration, but the TETr E. coli concentration did not differ (P > 0.05) between groups. Both generic E. coli and TETr E. coli concentrations were higher (P < 0.05) than their respective earlier sampling occasions (Fig. 2).
For 3GCr E. coli, fecal swab prevalences (%) were analyzed, because enumerable concentrations (≥2.00 log10 CFU/swab) were present in only 0.1% (2 of 1,352 swabs) of the fecal swabs (data not shown). Fecal swab 3GCr E. coli prevalences did not differ (P ≥ 0.90) between the control and CTC groups during any sampling occasion (Fig. 3). For both groups, fecal swab 3GCr E. coli prevalences on 75 dpt and 117 dpt were >70% and were higher (P < 0.01) than those during arrival, 5 dpt, and 27 dpt (<10%).
FIG 3.

Pen-level fecal swab prevalences of third-generation cephalosporin-resistant E. coli. Solid line represents the CTC group. Dashed line represents the control group. Error bars represent 95% confidence intervals for the mean concentrations.
Pen surface occurrences of generic, TETr, and 3GCr E. coli.
Arrival pen surface generic E. coli concentrations in the control (1.14 log10 CFU/g) and CTC (1.32 log10 CFU/g) groups did not differ (P = 0.97, Fig. 4A). Arrival pen surface TETr E. coli concentrations in the control (1.29 log10 CFU/g) and CTC (1.24 log10 CFU/g) groups did not differ (P = 1.00, Fig. 4B). At 5 dpt, pen surface generic E. coli concentrations for the control (2.53 log10 CFU/g) and CTC (3.47 log10 CFU/g) groups did not differ (P = 0.13) from each other but were higher (P < 0.05) than their respective arrival concentrations (Fig. 4A). At 5 dpt, the CTC group pen surface TETr E. coli concentration (3.23 log10 CFU/g) was higher (P < 0.01) than the control group concentration (1.56 log10 CFU/g; Fig. 4B). The CTC group 5 dpt TETr E. coli concentration was (P < 0.01) higher than its arrival concentration, while the control group 5 dpt TETr E. coli concentration did not differ (P = 1.00) from its arrival concentration (Fig. 4B).
FIG 4.

Pen-level pen surface concentrations of generic (A) and tetracycline-resistant (B) E. coli. Solid line represents the CTC pens. Dashed line represents the control pens. Short dashed line represents empty pens. Error bars represent 95% confidence intervals for the mean concentrations.
Control and CTC group pen surface generic E. coli concentrations on 27 dpt, 75 dpt, and 117 dpt ranged from 5.04 to 6.62 log10 CFU/g and did not differ (P ≥ 0.49) from each other within a sampling occasion (Fig. 4A). However, these generic E. coli concentrations were higher (P ≤ 0.01) than their respective arrival and 5 dpt concentrations. Similarly, control and CTC group pen surface TETr E. coli concentrations on 27 dpt, 75 dpt, and 117 dpt ranged from 4.75 to 5.71 log10 CFU/g and did not differ (P ≥ 0.06) from each other within a sampling occasion, but they were higher (P < 0.01) than their respective arrival and 5 dpt concentrations (Fig. 4B).
Arrival empty group pen surface generic E. coli (1.53 log10 CFU/g) and TETr E. coli (1.24 log10 CFU/g) concentrations did not differ (P ≥ 0.85) from their respective concentrations for the control and CTC groups (Fig. 4A). On all subsequent sampling occasions, empty pen surface generic E. coli concentrations ranged from 1.45 to 2.03 log10 CFU/g, while TETr E. coli concentrations ranged from 0.65 to 1.32 log10 CFU/g (Fig. 4). None of these empty pen group concentrations differed (P > 0.05) from their respective empty pen group arrival concentrations. On 5 dpt, empty group pen surface generic E. coli and TETr E. coli concentrations did not differ (P ≥ 0.58) from their respective control group concentrations but were lower (P = 0.02) than their respective CTC group concentrations. On 27 dpt, 75 dpt, and 117 dpt, generic and TETr E. coli concentrations from pen surface samples in the empty pens were lower (P < 0.01) than their respective control and CTC group pen surface concentrations (Fig. 4).
3GCr E. coli pen surface prevalences were analyzed because only 1.2% (3 of 260 samples) of the pen surface samples had enumerable (≥2.30 log10 CFU/g) 3GCr E. coli concentrations (data not shown). Control and CTC group pen surface 3GCr E. coli prevalences did not differ (P ≥ 0.18) on any sampling occasion (Fig. 5). Pen surface 3GCr E. coli prevalences did not differ (P ≥ 0.18) between control (60%), CTC (30%), and empty (58%) group pens at arrival. On 75 dpt and 117 dpt, 3GCr E. coli prevalences in the control and CTC group pens were higher (P ≤ 0.01) than in empty pens (Fig. 5).
FIG 5.

Pen-level pen surface prevalences of third-generation cephalosporin-resistant E. coli. Solid line represents the CTC group. Dashed line represents the control group. Short dashed line represents empty pens. Error bars represent 95% confidence intervals for the mean concentrations.
Occurrences of generic, TETr, and 3GCr E. coli in feed and water troughs.
At arrival, 5 dpt, and 27 dpt feed generic E. coli concentrations ranged from 2.53 to 3.62 log10 CFU/g (see Table S3 in the supplemental material). Notably, for both groups, the feed generic E. coli concentrations on 75 dpt and 117 dpt were higher, between 5.01 and 5.13 log10 CFU/g. Within a sampling occasion, similar feed generic E. coli concentrations were present in the two groups except on 27 dpt. However, this difference is due to a single prevalence-positive enumeration-negative sample in the CTC group (see Table S3). Feed TETr E. coli concentrations at arrival, 5 dpt, and 27 dpt ranged from 0.98 to 1.91 log10 CFU/g. For both groups, feed TETr E. coli concentrations on 75 dpt and 117 dpt were between 3.79 and 3.88 log10 CFU/g, higher than those on their preceding sampling occasions. 3GCr E. coli was not detected in feed during arrival, 5 dpt, 27 dpt, and 75 dpt sampling occasions. Interestingly, on the 117 dpt sampling occasion, 3GCr E. coli was prevalent in 100% of the feed samples (see Table S3).
At arrival, 5 dpt, and 27 dpt, water trough generic E. coli concentrations ranged from −0.33 to 0.45 log10 CFU/ml (see Table S4 in the supplemental material). On 75 dpt and 117 dpt, water trough generic E. coli concentrations were higher than those on their preceding sampling occasions, ranging from 1.83 to 3.01 log10 CFU/ml. Similarly, at arrival, 5 dpt, and 27 dpt, water trough TETr E. coli concentrations ranged from −0.77 to 0.00 log10 CFU/ml, while on 75 dpt and 117 dpt, TETr E. coli concentrations were higher, ranging from 0.59 to 1.81 log10 CFU/ml. 3GCr E. coli was not enumerable from any water trough sample. 3GCr E. coli was not detected in water trough samples during sampling occasions at arrival, 5 dpt, and 27 dpt. 3GCr E. coli was prevalent in 2 of 7 water trough samples from 75 dpt and 5 of 7 water trough samples from 117 dpt (see Table S4).
DISCUSSION
To our knowledge, two experimental studies have previously investigated the impact of in-feed CTC applications at beef cattle feedlots on fecal TETr E. coli levels. Studies published in 2008 by Platt et al. (28) and in 2013 by Kanwar et al. (22) found that in-feed CTC increased fecal TETr E. coli detection in the short term. Similarly, in the current study, the TETr E. coli concentration from the fecal swab samples at 5 dpt for the CTC group was 2.39 log10 CFU/swab higher than the control group concentration (Fig. 2B). We found that the 5 dpt CTC group fecal swab generic E. coli concentration was significantly (P < 0.01) higher than the 5 dpt control group concentration. A graph of fecal swab concentrations (Fig. 2B) clearly demonstrates that in-feed CTC administration increased the fecal swab TETr E. coli concentration immediately after treatment but that this concentration did not differ from the control group concentration by 27 dpt. Figure 2 also indicates that the fecal swab TETr E. coli concentration increase that occurred between arrival and 5 dpt was responsible for the CTC group 5 dpt fecal swab generic E. coli concentration remaining the same as the arrival concentration (Fig. 2A).
Platt et al. (28) reported a transient reduction in the prevalence of fecal 3GCr E. coli following in-feed CTC treatment, while Kanwar et al. (22) reported increased 3GCr E. coli occurrence when a veterinary 3GC, ceftiofur, was administered followed by in-feed CTC administration. In contrast to both studies, we found that fecal swab 3GCr E. coli prevalences did not differ significantly (P ≥ 0.90) between groups on any sampling occasion (Fig. 3). More importantly, our study provides substantial original evidence that factors other than in-feed CTC treatment had a greater impact on TETr and 3GCr E. coli shed by feedlot cattle. For both groups, 75 dpt and 117 dpt fecal swab TETr E. coli concentrations were significantly higher than the 5 dpt CTC group concentration (Fig. 2). Similarly, 75 dpt and 117 dpt 3GCr E. coli fecal swab prevalences (>70%) were significantly higher than arrival, 5 dpt, and 27 dpt prevalences (<10%, Fig. 3) in both groups.
Concerns also have been raised that in-feed CTC could increase the occurrence of antimicrobial resistance in pen surface soil, possibly reinoculating cattle with resistant bacteria or increasing the occurrence of antimicrobial resistance in manure, which may impact crops or the environment (29–32). To our knowledge, the impact of in-feed CTC on beef cattle feedlot pen surface generic, TETr, and 3GCr E. coli occurrences has not been reported. We conclude that factors other than in-feed CTC administration had a greater impact on pen surface TETr E. coli. While the CTC group 5 dpt pen surface TETr E. coli concentration was significantly higher (P < 0.01) than the 5 dpt control group concentration, 27 dpt, 75 dpt, and 117 dpt pen surface TETr E. coli concentrations for both control and CTC groups were all significantly higher than the 5 dpt CTC group pen surface TETr E. coli concentration (Fig. 4). Graphing each group's pen surface generic and TETr E. coli concentrations (Fig. 4) led us to conclude that the deposition of manure (feces and urine) in occupied pens (control and CTC groups) was the principal factor contributing to the increase in TETr E. coli concentrations compared to the empty pens. We note that for all three groups, TETr E. coli concentrations were proportional to the generic E. coli concentrations (Fig. 4). We postulate that the temporal increase in E. coli concentrations in occupied pens was due to the deposited E. coli populations themselves, increased nutrients from the deposited manure, or a combination of these factors. These findings and postulations are consistent with recent studies that found antimicrobial-resistant bacteria and antimicrobial resistance genes increased in soils from pens holding cattle that had not received antibiotics and soils fertilized with manure from dairy cattle that had not received antibiotics (30, 33).
We can only speculate on the factors driving the observed increases in TETr and 3GCr E. coli occurrence as sampling occasions progressed. Generic, TETr, and 3GCr E. coli occurrences in feed may be a factor because as sampling occasions progressed, generic, TETr, and 3GCr E. coli occurrences in the feed samples also increased (see Table S3 in the supplemental material). A similar temporal increase in generic, TETr, and 3GCr E. coli occurrences was observed in water trough samples as well (see Table S4 in the supplemental material). We note that the feed and water trough samplings were limited (10 feed samples and seven water trough samples were obtained at each sampling occasion). We also note that E. coli is known to be present in feed and that E. coli on the cattle head and in the oral cavity could contaminate water troughs (34–37). Furthermore, we also noted that the ration fed to study animals at times included the antimicrobials tylosin and monensin (see Table S1 in the supplemental material); however, the presence of these antimicrobials in feed should not impact E. coli due to the intrinsic resistance of E. coli to these antimicrobials (38–41). Other factors potentially impacting the occurrences of E. coli include ambient temperature and season (42–44). Clearly, confident attribution of antimicrobial-resistant E. coli occurrences to specific factors requires additional study.
Morbidities, mostly due to respiratory diseases, were 28 times more likely for control group cattle than the CTC group cattle (Fig. 1; see also Table S2 in the supplemental material). Associating economic losses due to morbidity was beyond the scope of the study, but bovine respiratory disease morbidities can inflict significant economic losses on producers and processors (14). We note that 39 of 40 morbid cattle were treated with therapeutic antimicrobials (ceftiofur, enrofloxacin, tildipirosin, or tulathromycin) from antimicrobial classes (3GCs, fluoroquinolones, and macrolides) categorized as “highest priority critically important antimicrobials” by the World Health Organization (WHO), while CTC is placed in a lower classification, “highly important” (18). A comparison of the AMR impacts of in-feed CTC prophylaxis to therapeutic treatments with highest priority critically important antimicrobials was beyond the scope of this study, and we are not aware of any published studies directly addressing this specific topic. Regardless, research is needed to address this gap, because therapeutic doses of some critically important antimicrobials have been theorized to contribute to antimicrobial resistance more than in-feed CTC (30, 45).
In summary, we found that CTC administered in-feed for 5-days to feedlot beef cattle (i) reduced morbidity, (ii) reduced the therapeutic use of highest priority critically important antimicrobials, (iii) temporarily increased fecal TETr E. coli concentration, (iv) temporarily increased pen surface TETr E. coli concentration, (v) did not impact long-term fecal TETr E. coli concentration, (vi) did not impact long-term pen surface TETr E. coli concentration, (vii) did not impact fecal 3GCr E. coli prevalence, and (viii) did not impact pen surface 3GCr E. coli prevalence. We also found that regardless of in-feed CTC exposure, generic, TETr, and 3GCr E. coli occurrences were highest during the last two sampling occasions, 75 and 117 days after in-feed CTC administration ceased. We conclude that other undefined factors contributed more significantly to TETr and 3GCr E. coli occurrence than the use of in-feed CTC.
Supplementary Material
ACKNOWLEDGMENTS
We thank Trent Ahlers, Kerry Brader, Julie Dyer, Frank Reno, and Alberto Alvarado for their technical support and Jody Gallagher for her secretarial support.
We declare no competing financial interests. Names are necessary to report factually on available data; however, the USDA neither guarantees nor warrants the standard of the product, and the use of the name by USDA implies no approval of the product to the exclusion of others that may also be suitable.
Funding Statement
This research received no specific grant from any funding agency in the public, commercial, or not-for-profit sectors.
Footnotes
Supplemental material for this article may be found at http://dx.doi.org/10.1128/AEM.01928-16.
REFERENCES
- 1.Phillips I, Casewell M, Cox T, De Groot B, Friis C, Jones R, Nightingale C, Preston R, Waddell J. 2004. Does the use of antibiotics in food animals pose a risk to human health? A critical review of published data. J Antimicrob Chemother 53:28–52. doi: 10.1093/jac/dkg483. [DOI] [PubMed] [Google Scholar]
- 2.Thanner S, Drissner D, Walsh F. 2016. Antimicrobial resistance in agriculture. mBio 7(2):e02227-15. doi: 10.1128/mBio.02227-15. [DOI] [PMC free article] [PubMed] [Google Scholar]
- 3.Wittum TE. 2012. The challenge of regulating agricultural ceftiofur use to slow the emergence of resistance to extended-spectrum cephalosporins. Appl Environ Microbiol 78:7819–7821. doi: 10.1128/AEM.01967-12. [DOI] [PMC free article] [PubMed] [Google Scholar]
- 4.Marshall BM, Levy SB. 2011. Food animals and antimicrobials: impacts on human health. Clin Microbiol Rev 24:718–733. doi: 10.1128/CMR.00002-11. [DOI] [PMC free article] [PubMed] [Google Scholar]
- 5.Singer RS, Williams-Nguyen J. 2014. Human health impacts of antibiotic use in agriculture: a push for improved causal inference. Curr Opin Microbiol 19:1–8. doi: 10.1016/j.mib.2014.05.014. [DOI] [PubMed] [Google Scholar]
- 6.Cox LA Jr, Popken DA. 2010. Assessing potential human health hazards and benefits from subtherapeutic antibiotics in the United States: tetracyclines as a case study. Risk Anal 30:432–457. doi: 10.1111/j.1539-6924.2009.01340.x. [DOI] [PubMed] [Google Scholar]
- 7.Cox LA Jr, Popken DA. 2014. Quantitative assessment of human MRSA risks from swine. Risk Anal 34:1639–1650. doi: 10.1111/risa.12255. [DOI] [PubMed] [Google Scholar]
- 8.Hurd HS, Doores S, Hayes D, Mathew A, Maurer J, Silley P, Singer RS, Jones RN. 2004. Public health consequences of macrolide use in food animals: a deterministic risk assessment. J Food Prot 67:980–992. [DOI] [PubMed] [Google Scholar]
- 9.Hurd HS, Vaughn MB, Holtkamp D, Dickson J, Warnick L. 2010. Quantitative risk from fluoroquinolone-resistant Salmonella and Campylobacter due to treatment of dairy heifers with enrofloxacin for bovine respiratory disease. Foodborne Pathog Dis 7:1305–1322. doi: 10.1089/fpd.2010.0550. [DOI] [PubMed] [Google Scholar]
- 10.U.S. FDA. 2012. Guidance for industry #209. The judicious use of medically important antimicrobial drugs in food-producing animals. U.S. Food and Drug Administration, U.S. Department of Health and Human Services, Center for Veterinary Medicine, Rockville, MD: http://www.fda.gov/downloads/animalveterinary/guidancecomplianceenforcement/guidanceforindustry/ucm216936.pdf. [Google Scholar]
- 11.U.S. FDA. 2013. Guidance for industry #213. New animal drugs and new animal drug combination products administered in or on medicated feed or drinking water of food-producing animals: recommendations for drug sponsors for voluntarily aligning product use conditions with GFI #209. U.S. Food and Drug Administration, U.S. Department of Health and Human Services, Center for Veterinary Medicine, Rockville, MD: http://www.fda.gov/downloads/AnimalVeterinary/GuidanceComplianceEnforcement/GuidanceforIndustry/UCM299624.pdf. [Google Scholar]
- 12.Cox LA Jr, Ricci PF. 2008. Causal regulations vs. political will: why human zoonotic infections increase despite precautionary bans on animal antibiotics. Environ Int 34:459–475. doi: 10.1016/j.envint.2007.10.010. [DOI] [PubMed] [Google Scholar]
- 13.Apley M. 2014. The clinical syndrome of BRD: what it is and what it is not. Anim Health Res Rev 15:135–137. doi: 10.1017/S1466252314000152. [DOI] [PubMed] [Google Scholar]
- 14.Snowder GD, Van Vleck LD, Cundiff LV, Bennett GL, Koohmaraie M, Dikeman ME. 2007. Bovine respiratory disease in feedlot cattle: phenotypic, environmental, and genetic correlations with growth, carcass, and longissimus muscle palatability traits. J Anim Sci 85:1885–1892. doi: 10.2527/jas.2007-0008. [DOI] [PubMed] [Google Scholar]
- 15.Ives SE, Richeson JT. 2015. Use of antimicrobial metaphylaxis for the control of bovine respiratory disease in high-risk cattle. Vet Clin North Am Food Anim Pract 31:341–350. doi: 10.1016/j.cvfa.2015.05.008. [DOI] [PubMed] [Google Scholar]
- 16.USDA. 2013. Feedlot 2011: part IV: health and health management on U.S. feedlots with a capacity of 1,000 or more head. United States Department of Agriculture, Animal and Plant Health Inspection Service, Veterinary Services, National Animal Health Monitoring System, Fort Collins, CO: https://www.aphis.usda.gov/animal_health/nahms/feedlot/downloads/feedlot2011/Feed11_dr_PartIV.pdf. [Google Scholar]
- 17.FDA. 2015. Summary report on antimicrobials sold or distributed in 2014 for use in food-producing animals. Center for Veterinary Medicine, U.S. Food and Drug Administration, Department of Health and Human Services, Rockville, MD: http://www.fda.gov/AnimalVeterinary/NewsEvents/CVMUpdates/ucm476256.htm. [Google Scholar]
- 18.WHO. 2012. Critically important antimicrobials for human medicine, 3rd revision 2011 WHO Advisory Group on Integrated Surveillance of Antimicrobial Resisatnce (AGISAR), World Health Organization (WHO), Geneva, Switzerland: http://apps.who.int/iris/bitstream/10665/77376/1/9789241504485_eng.pdf. [Google Scholar]
- 19.Agga GE, Arthur TM, Schmidt JW. 2016. Antimicrobial-resistant fecal bacteria from ceftiofur-treated and non-antimicrobial-treated co-mingled beef cows at a cow-calf operation. Microb Drug Resist doi: 10.1089/mdr.2015.0259. [DOI] [PubMed] [Google Scholar]
- 20.Agga GE, Scott HM, Amachawadi RG, Nagaraja TG, Vinasco J, Bai J, Norby B, Renter DG, Dritz SS, Nelssen JL, Tokach MD. 2014. Effects of chlortetracycline and copper supplementation on antimicrobial resistance of fecal Escherichia coli from weaned pigs. Prev Vet Med 114:231–246. doi: 10.1016/j.prevetmed.2014.02.010. [DOI] [PubMed] [Google Scholar]
- 21.Call DR, Singer RS, Meng D, Broschat SL, Orfe LH, Anderson JM, Herndon DR, Kappmeyer LS, Daniels JB, Besser TE. 2010. blaCMY-2-positive IncA/C plasmids from Escherichia coli and Salmonella enterica are a distinct component of a larger lineage of plasmids. Antimicrob Agents Chemother 54:590–596. doi: 10.1128/AAC.00055-09. [DOI] [PMC free article] [PubMed] [Google Scholar]
- 22.Kanwar N, Scott HM, Norby B, Loneragan GH, Vinasco J, McGowan M, Cottell JL, Chengappa MM, Bai J, Boerlin P. 2013. Effects of ceftiofur and chlortetracycline treatment strategies on antimicrobial susceptibility and on tet(A), tet(B), and blaCMY-2 resistance genes among E coli isolated from the feces of feedlot cattle. PLoS One 8:e80575. doi: 10.1371/journal.pone.0080575. [DOI] [PMC free article] [PubMed] [Google Scholar]
- 23.Agga GE, Arthur TM, Durso LM, Harhay DM, Schmidt JW. 2015. Antimicrobial-resistant bacterial populations and antimicrobial resistance genes obtained from environments impacted by livestock and municipal waste. PLoS One 10:e0132586. doi: 10.1371/journal.pone.0132586. [DOI] [PMC free article] [PubMed] [Google Scholar]
- 24.Schmidt JW, Agga GE, Bosilevac JM, Brichta-Harhay DM, Shackelford SD, Wang R, Wheeler TL, Arthur TM. 2015. Occurrence of antimicrobial-resistant Escherichia coli and Salmonella enterica in the beef cattle production and processing continuum. Appl Environ Microbiol 81:713–725. doi: 10.1128/AEM.03079-14. [DOI] [PMC free article] [PubMed] [Google Scholar]
- 25.FDA. 2013. 2012 retail meat report. National Antimicrobial Resistance Monitoring System, U.S. Department of Health and Human Services, U.S. Food and Drug Administration, Rockville, MD. [Google Scholar]
- 26.Horakova K, Mlejnkova H, Mlejnek P. 2008. Specific detection of Escherichia coli isolated from water samples using polymerase chain reaction targeting four genes: cytochrome bd complex, lactose permease, beta-d-glucuronidase, and beta-d-galactosidase. J Appl Microbiol 105:970–976. doi: 10.1111/j.1365-2672.2008.03838.x. [DOI] [PubMed] [Google Scholar]
- 27.Hosmer DW Jr, Lemeshow S, May S. 2008. Applied survival analysis: regression modeling of time to event data, 2nd ed. Wiley & Sons, Hoboken, NJ. [Google Scholar]
- 28.Platt TM, Loneragan GH, Scott HM, Norby B, Thomson DU, Brown MS, Ives SE, Brashears MM. 2008. Antimicrobial susceptibility of enteric bacteria recovered from feedlot cattle administered chlortetracycline in feed. Am J Vet Res 69:988–996. doi: 10.2460/ajvr.69.8.988. [DOI] [PubMed] [Google Scholar]
- 29.Durso LM, Cook KL. 2014. Impacts of antibiotic use in agriculture: what are the benefits and risks? Curr Opin Microbiol 19:37–44. doi: 10.1016/j.mib.2014.05.019. [DOI] [PubMed] [Google Scholar]
- 30.Liu J, Zhao Z, Orfe L, Subbiah M, Call DR. 2016. Soil-borne reservoirs of antibiotic-resistant bacteria are established following therapeutic treatment of dairy calves. Environ Microbiol 18:557–564. doi: 10.1111/1462-2920.13097. [DOI] [PubMed] [Google Scholar]
- 31.Subbiah M, Shah DH, Besser TE, Ullman JL, Call DR. 2012. Urine from treated cattle drives selection for cephalosporin resistant Escherichia coli in soil. PLoS One 7:e48919. doi: 10.1371/journal.pone.0048919. [DOI] [PMC free article] [PubMed] [Google Scholar]
- 32.Wichmann F, Udikovic-Kolic N, Andrew S, Handelsman J. 2014. Diverse antibiotic resistance genes in dairy cow manure. mBio 5(2):e01017-13. doi: 10.1128/mBio.01017-13. [DOI] [PMC free article] [PubMed] [Google Scholar]
- 33.Udikovic-Kolic N, Wichmann F, Broderick NA, Handelsman J. 2014. Bloom of resident antibiotic-resistant bacteria in soil following manure fertilization. Proc Natl Acad Sci U S A 111:15202–15207. doi: 10.1073/pnas.1409836111. [DOI] [PMC free article] [PubMed] [Google Scholar]
- 34.Crump JA, Griffin PM, Angulo FJ. 2002. Bacterial contamination of animal feed and its relationship to human foodborne illness. Clin Infect Dis 35:859–865. doi: 10.1086/342885. [DOI] [PubMed] [Google Scholar]
- 35.Ghosh A, Zurek L. 2015. Fresh steam-flaked corn in cattle feedlots is an important site for fecal coliform contamination by house flies. J Food Prot 78:567–572. doi: 10.4315/0362-028X.JFP-14-429. [DOI] [PubMed] [Google Scholar]
- 36.Keen JE, Laegreid WW, Chitko-McKown CG, Durso LM, Bono JL. 2010. Distribution of Shiga-toxigenic Escherichia coli O157 in the gastrointestinal tract of naturally O157-shedding cattle at necropsy. Appl Environ Microbiol 76:5278–5281. doi: 10.1128/AEM.00400-10. [DOI] [PMC free article] [PubMed] [Google Scholar]
- 37.Sapkota AR, Lefferts LY, McKenzie S, Walker P. 2007. What do we feed to food-production animals? A review of animal feed ingredients and their potential impacts on human health. Environ Health Perspect 115:663–670. [DOI] [PMC free article] [PubMed] [Google Scholar]
- 38.Mao JC, Putterman M. 1968. Accumulation in gram-postive and Gram-negative bacteria as a mechanism of resistance to erythromycin. J Bacteriol 95:1111–1117. [DOI] [PMC free article] [PubMed] [Google Scholar]
- 39.Ridgway F, Ryden R. 1966. Resistance studies of Salmonella Typhimurium in chicks on a tylosin feed. J Comp Pathol 76:23–30. doi: 10.1016/0021-9975(66)90044-2. [DOI] [PubMed] [Google Scholar]
- 40.Vaara M. 1992. Agents that increase the permeability of the outer membrane. Microbiol Rev 56:395–411. [DOI] [PMC free article] [PubMed] [Google Scholar]
- 41.Vaara M. 1993. Outer membrane permeability barrier to azithromycin, clarithromycin, and roxithromycin in Gram-negative enteric bacteria. Antimicrob Agents Chemother 37:354–356. doi: 10.1128/AAC.37.2.354. [DOI] [PMC free article] [PubMed] [Google Scholar]
- 42.Barkocy-Gallagher GA, Arthur TM, Rivera-Betancourt M, Nou X, Shackelford SD, Wheeler TL, Koohmaraie M. 2003. Seasonal prevalence of Shiga toxin-producing Escherichia coli, including O157:H7 and non-O157 serotypes, and Salmonella in commercial beef processing plants. J Food Prot 66:1978–1986. [DOI] [PubMed] [Google Scholar]
- 43.Elder RO, Keen JE, Siragusa GR, Barkocy-Gallagher GA, Koohmaraie M, Laegreid WW. 2000. Correlation of enterohemorrhagic Escherichia coli O157 prevalence in feces, hides, and carcasses of beef cattle during processing. Proc Natl Acad Sci U S A 97:2999–3003. doi: 10.1073/pnas.97.7.2999. [DOI] [PMC free article] [PubMed] [Google Scholar]
- 44.van Elsas JD, Semenov AV, Costa R, Trevors JT. 2011. Survival of Escherichia coli in the environment: fundamental and public health aspects. ISME J 5:173–183. doi: 10.1038/ismej.2010.80. [DOI] [PMC free article] [PubMed] [Google Scholar]
- 45.Subbiah M, Top EM, Shah DH, Call DR. 2011. Selection pressure required for long-term persistence of blaCMY-2-positive IncA/C plasmids. Appl Environ Microbiol 77:4486–4493. doi: 10.1128/AEM.02788-10. [DOI] [PMC free article] [PubMed] [Google Scholar]
Associated Data
This section collects any data citations, data availability statements, or supplementary materials included in this article.