

 This work is licensed under a
 Summary
Glucagon stimulates hepatic glucose production by activating specific glucagon receptors in the liver, which in turn increase hepatic glycogenolysis as well as gluconeogenesis and ureagenesis from amino acids. Conversely, glucagon secretion is regulated by concentrations of glucose and amino acids. Disruption of glucagon signaling in rodents results in grossly elevated circulating glucagon levels but no hypoglycemia. Here, we describe a patient carrying a homozygous G to A substitution in the invariant AG dinucleotide found in a 3′ mRNA splice junction of the glucagon receptor gene. Loss of the splice site acceptor consensus sequence results in the deletion of 70 nucleotides encoded by exon 9, which introduces a frame shift and an early termination signal in the receptor mRNA sequence. The mutated receptor neither bound 125I-labeled glucagon nor induced cAMP production upon stimulation with up to 1 µM glucagon. Despite the mutation, the only obvious pathophysiological trait was hyperglucagonemia, hyperaminoacidemia and massive hyperplasia of the pancreatic α-cells assessed by histology. Our case supports the notion of a hepato–pancreatic feedback system, which upon disruption leads to hyperglucagonemia and α-cell hyperplasia, as well as elevated plasma amino acid levels. Together with the glucagon-induced hypoaminoacidemia in glucagonoma patients, our case supports recent suggestions that amino acids may provide the feedback link between the liver and the pancreatic α-cells.
Learning points:
Loss of function of the glucagon receptor may not necessarily lead to the dysregulation of glucose homeostasis.
Loss of function of the glucagon receptor causes hyperaminoacidemia, hyperglucagonemia and α-cell hyperplasia and sometimes other pancreatic abnormalities.
A hepato–pancreatic feedback regulation of the α-cells, possibly involving amino acids, may exist in humans.
Background
We present a patient who, despite having many-fold (~100) elevated glucagon levels, showed no apparent manifestations of a gluco-regulatory defect, nor any symptoms of a glucagonoma syndrome. The patient’s glucagon was fully processed and biologically active, as verified by HPLC analysis and an in vitro glucagon bio-assay respectively, but sequence analysis of the glucagon receptor gene revealed a splice site mutation, resulting in a non-functional receptor. Normally, glucagon secretion is thought to account for about 2/3 of hepatic glucose production in humans (1), but this patient, who was essentially a homozygous glucagon receptor gene knockout, nevertheless maintained normal glucose homeostasis.
Case presentation
A 51-year-old male (170 cm, 70 kg) presented with chronic epigastric pains that radiated through the back. A computerized tomography (CT) scan showed an enlargement of the head of the pancreas, with a heterogeneous mass of 4 cm in diameter. A proximal pancreatoduodenectomy was performed with a presumed diagnosis of pancreatic cancer. However, no tumor was found in the resected portion of the pancreatic head (4.5 × 6 cm), but fibrosis was observed (Fig. 1A and B). Pancreatic histology revealed the presence of many enlarged islets and diffuse hyperplasia of α-cells (Fig. 1C, D and E).
Figure 1.
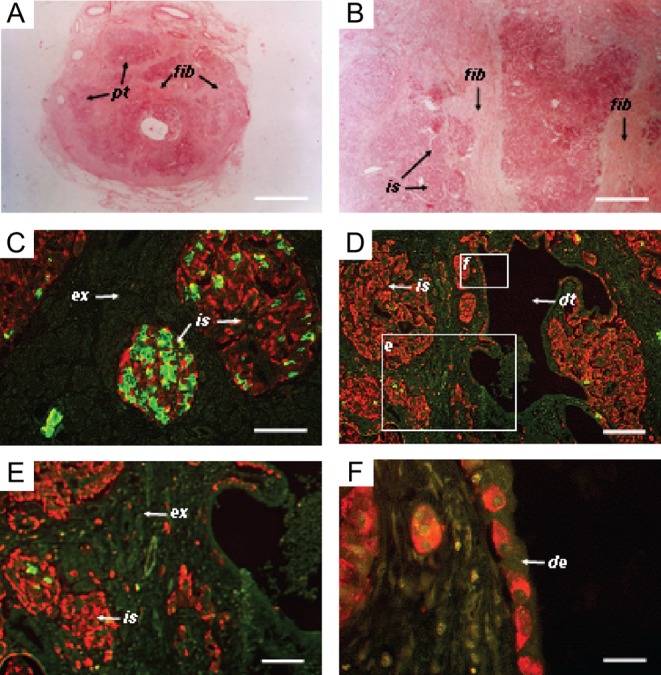
Photomicrographs of tissue sections from a biopsy of the patient’s pancreas. (A and B) Tissue sections stained with eosin, revealing the presence of diffuse fibrosis. (C and D) Immunostaining for insulin (green) and glucagon (red). Glucagon staining cells in islets, exocrine tissue and ductal epithelium. The boxed areas have been enlarged in panels E and F as indicated. (E) Further magnification of endocrine and exocrine pancreatic tissue, showing extra-islet glucagon staining cells (red). (F) Further magnification of ductal epithelium lined with cells staining for glucagon. Pt, pancreatic tissue; is, islet; ex, exocrine tissue; fib, fibrotic tissue; dt, duct; de, ductal epithelium. The bars represent 6 mm in A, 100 µm in B, C and D, 200 µm in E and 80 µm in F.
Investigation
Six months after surgery, a physical examination indicated no abnormalities (including a CT scan) despite the presence of extremely high plasma glucagon levels. Total pancreatectomy was considered, but not performed because the patient showed no signs of a glucagonoma syndrome (2). Further investigations were performed: plasma glucose and glycated hemoglobin (HbA1c) levels were normal (4.6 mM and 4.6%/27 mmol/mol respectively), but plasma amino acid levels were increased, particularly those of alanine (978 µmol/L – normal range, 250–400 µmol/L). Fasting insulin, C-peptide and catecholamine levels were within the normal range (Table 1), but glucagon levels were highly elevated (>3200 pg/mL, normal range 10–100 pg/mL). Blood glucose levels were unchanged in response to a 15-min glucagon infusion, and the patient responded normally to a 75 g oral glucose tolerance test (Table 1). Analysis of the patient’s plasma by high performance liquid chromatography (HPLC) and specific radioimmunoassays directed toward distinct immunogenic regions of the glucagon molecule (Fig. 2A, B and C) revealed a single component co-eluting with glucagon calibrators, indicating no defect in proglucagon processing (3). cAMP production by a baby hamster kidney (BHK) cell line expressing the cloned human glucagon receptor was 17-fold higher after stimulation with patient plasma than with plasma from healthy subjects (Fig. 2D). Comparing RNA extracted from a liver biopsy from the patient and a normal human liver biopsy revealed a defect in the glucagon receptor gene, with a difference of approximately 70 base pairs within exons 7–10 (Fig. 3A). Subsequently, a sequence analysis (of PCR-amplified genomic DNA) identified a substitution of the guanidine (G) residue by adenine (A) in the invariant AG dinucleotide of the acceptor splice site of intron 8 (Fig. 3B, C and D), resulting in the skipping of exon 9, which codes for part of the second extracellular loop and part of the fifth transmembrane domain. This deletion leads to a shift in the reading frame, resulting in missense translation of the sequence encoded by exons 10–13, and introduction of a stop codon after amino acid 327.
Table 1.
Biochemical characteristics obtained by Arginine test, Glucose infusion test, Oral Glucose Tolerance Test and fasting levels of hormones.
| Arginine test | |||||
| Time (min) | −15 | 0 | 15 | 30 | 60 |
| Insulin (U/L) | 8 | 9 | 11 | 8 | 9 |
| C-peptide (nM) | 0.3 | 0.3 | 0.4 | 0.4 | 0.3 |
| Glucagon (pg/mL) | >3200 | >3200 | >3200 | >3200 | >3200 |
| Plasma glucose (mM) | 4.7 | 4.5 | 3.8 | 4.2 | |
| Glucagon infusion test | |||||
| Time (min) | 0 | 5 | 10 | 15 | |
| Insulin (U/L) | 6 | 7 | 5 | 5 | |
| C-peptide (nM) | 0.2 | 0.1 | 0.1 | 0.1 | |
| Plasma glucose (mM) | 4.1 | 4.3 | 4.3 | 4.0 | |
| Oral glucose tolerance test | |||||
| Time (min) | 0 | 30 | 90 | 30 | 120 |
| Insulin (U/L) | 8 | 35 | 43 | 18 | 12 |
| C-peptide (nM) | 0.4 | 1.7 | 2.8 | 1.4 | 0.8 |
| Glucagon (pg/mL) | >3200 | >3200 | >3200 | >3200 | >3200 |
| Plasma glucose (mM) | 4.8 | 7.5 | 7.4 | 5.8 | 4.4 |
| Fasting levels of other hormones | |||||
| Epinephrine (pg/mL) | 22 | ||||
| Norepinephrine (pg/mL) | 80 | ||||
Figure 2.

Post-translational processing of proglucagon. HPLC profiles of the patient’s plasma; asterisks indicate the glucagon calibration point. (A, B and C) Immunoreactive glucagon in the HPLC fractions was measured by radioimmunoassays using a ‘side-viewing’ antibody, which recognizes all peptides containing the glucagon sequence as well as antibodies directed against the mature, fully processed terminals of glucagon (C-terminal and N-terminal). (D) Accumulation of cAMP in baby hamster kidney (BHK) cells expressing cloned human glucagon receptors. Cells were stimulated with normal human plasma, patient plasma or charcoal-extracted normal human plasma supplemented with 1 nM glucagon. Shown are means and standard deviations of quadruple determinations.
Figure 3.

Glucagon receptor gene transcripts in patient and normal liver. (A) Multiplex PCR analysis of cDNA from the patient and from normal human liver using a primer set, which leads to amplification of a 343 bp fragment including sequences encoded within exons 7–10. (B) Sequence analysis of cloned glucagon receptor cDNA from the patient and from normal human liver verifying the deletion of exon 9. Sequence analysis of the intron 8/exon 9 splice junction. (C) Autoradiogram comparing the sequence of the non-coding strand across the splice junction of exon 9 in cloned glucagon receptor genomic DNA from the patient with the corresponding sequence obtained from cloned wild-type human glucagon receptor genomic DNA. (D) Schematic diagram of the human glucagon receptor gene structure showing the position of the invariant AG dinucleotide in intron 8 and the G → A substitution.
Examination of liver membrane preparations from the patient showed that this mutation resulted in loss of receptor signaling, with no binding of 125I-glucagon (Fig. 4A) or cAMP production in response to glucagon concentrations as high as 1 µM (Fig. 4B). In contrast, normal human liver membrane preparations specifically bound 125I-labeled glucagon and displayed glucagon-stimulated cAMP production at concentrations as low as 1 pM, with 3-fold increases being observed at 1 µM. Finally, COS-7 cells were transiently transfected with cDNA of either the cloned human glucagon receptor or the mutated receptor. In short, the receptor binding and stimulation of cAMP production were comparable to those observed in control liver membranes or those from the patient respectively (Fig. 4C and D).
Figure 4.

Glucagon receptor function in plasma membranes isolated from normal human and patient liver (A and B) and in COS-7 cells expressing the wild-type or mutant glucagon receptor (C and D). (A) Binding of 125I-labeled glucagon with (non-specific binding) and without (B0: total binding) addition of 1 µM unlabeled glucagon after incubation with aliquots of membranes containing 50 µg protein for 90 min. Shown are means and standard deviations of three determinations. (B) Accumulation of cAMP after incubation for 90 min with 1 µM glucagon, forskolin or epinephrine. The values presented are means and standard deviations of four determinations. (C) Competition binding of 125I-glucagon with (NSB) and without (B0) the addition of 1 µM unlabeled glucagon and (D) accumulation of cAMP using COS-7 cells expressing the cloned wild-type human glucagon receptor (wt-GR) or the mutant receptors in which the 70 base pairs encoded by exon 9 have been deleted (Δ70-GR).
Treatment
The only prescribed medication was pancreatic enzymes.
Outcome and follow-up
The patient was followed up for about 4 years after surgery, but then the contact was lost.
Discussion
We describe a patient carrying a G-to-A substitution at position −1 in the acceptor splice site of intron 8 in the glucagon receptor gene, which resulted in the loss of exon 9 and a complete loss of function of the glucagon receptor. In agreement with these observed structural disarrangements, studies with the patient’s liver cell membranes and with cells transfected with the mutated receptor confirmed that this mutation results in a receptor that is unable to bind glucagon or signal in response to glucagon in terms of cAMP accumulation. It is of special interest that the primary observable clinical consequence of this lack of functional glucagon receptor expression was the dramatic α-cell hyperplasia (presenting as an abdominal swelling). Our HPLC studies indicate that the α-cell hyperplasia resulted in hypersecretion of not only the normal pancreatic products of proglucagon, as evidenced by the high concentrations of both glucagon and GLP-1 (1–36 amide), but also a large increase in the concentrations of fully processed bioactive GLP-1 7–36 amide (320 pmol/L) and GLP-2 (113 pmol/L) (data not shown), which are normally produced in the L-cells located in the gut. The mechanism behind this increased intestinal expression of proglucagon products remains to be determined, but would suggest expression of intestinal-type prohormone convertases in the hyperplastic tissue. Cases of glucagon receptor mutations have previously been reported (4, 5) (also termed the Mahvash disease), but without the characterization of secreted glucagon-like peptides and plasma amino acids. Our case is unique in that dysplastic islets or neuroendocrine tumors, found in other cases, are not seen in our patient; rather, fibrosis was found.
The α-cell hyperplasia of our patient was associated with the loss of glucagon signaling. A similar hyperplasia is observed in mice with genetic deletion of the glucagon receptor gene (6), and recent clinical studies with potent glucagon receptor antagonists also show pronounced dose-dependent hyperglucagonemia (7). The signal leading to α-cell hyperplasia has remained enigmatic, but mouse genetic studies suggested that the hyperplasia is due to a liver-derived factor (8). A possible feedback regulation of α-cells by amino acids was recently reported by Solloway et al. who also demonstrated that hyperaminoacidemia causes α-cell hyperplasia (9). Interestingly, our patient also had hyperaminoacidemia, particularly pronounced for glucogenic amino acids. Thus, a feedback circuit between the liver and the α-cells with glucagon and amino acids as signals seems to exist: glucagon profoundly influences amino acid turnover in the liver resulting in severe hypoaminoacidemia in glucagonoma patients (3), whereas a lack of glucagon signaling causes rising amino acid levels, which increase glucagon secretion and eventually lead to α-cell hyperplasia.
In conclusion, we identified a patient with non-functional glucagon receptors due to a point mutation in the glucagon receptor gene resulting in an mRNA splicing defect. Massive hyperplasia of glucagon-producing pancreatic α-cells as well as hyperglucagonemia developed as a result of the absence of functional glucagon receptors. This finding suggests that very potent growth/differentiation signals (potentially amino acids) can be activated in response to the lack of glucagon signaling and suggest that glucagon secretion constitutes one of the links in a feedback circuitry between the liver and the pancreas.
Declaration of interest
The authors declare that there is no conflict of interest that could be perceived as prejudicing the impartiality of the research reported.
Funding
NNF Center for Basic Metabolic Research, University of Copenhagen.
Patient consent
The patient was lost to follow-up 4 years after surgery and hence could not be contacted for consent.
Author contribution statement
E L, L H, R W G, J C, C F D, O D M, F Y, P M, J J H and E N contributed substantially to the concept and design of the study; E L, L H, N J W A, R W G, J C, C F D, O D M, F Y, P M, J J H and E N contributed substantially to the analysis and interpretation of the data; E L, N W A and L H drafted the manuscript; E N and J J H critically revised the manuscript for important intellectual content. All authors have provided approval of the final version to be published. E N and J J H are responsible for the integrity of the work as a whole.
Acknowledgements
The expert technical assistance provided by Ane Bøjet Baunsgaard and Erna Engholm Pedersen is gratefully acknowledged. The authors would also like to thank Drs Wayne Kindsvogel and Si Lok at Zymogenetics Inc. (Seattle) for providing the human glucagon receptor cDNA and genomic clones. The human liver tissue used for control purposes was provided by the Anatomic Gift Foundation, 13948 Baltimore Avenue, Laurel, MD 20707. Finally, the many insightful comments regarding this manuscript from Dr Nils Billestrup are much appreciated.
The paper is dedicated to the memory of Prof Roger Assan.
References
- 1.Ramnanan CJ, Edgerton DS, Kraft G, Cherrington AD. 2011. Physiologic action of glucagon on liver glucose metabolism. Diabetes, Obesity and Metabolism 13 118–125. ( 10.1111/j.1463-1326.2011.01454.x) [DOI] [PMC free article] [PubMed] [Google Scholar]
- 2.Wewer Albrechtsen NJ, Challis B, Damjanov I, Holst JJ. 2016. Do glucagonomas always produce glucagon? Bosnian Journal of basic Medical Sciences 16 1–7. ( 10.17305/bjbms.2015.794) [DOI] [PMC free article] [PubMed] [Google Scholar]
- 3.Challis BG, Albrechtsen NJW, Bansiya V, Burling K, Barker P, Hartmann B, Gribble F, O’Rahilly S, Holst JJ, Simpson HL. 2015. Heterogeneity of glucagonomas due to differential processing of proglucagon-derived peptides. Endocrinology, Diabetes and Metabolism Case Reports 2015 150105 ( 10.1530/edm-15-0105) [DOI] [PMC free article] [PubMed] [Google Scholar]
- 4.Yu R, Wawrowsky K, Zhou C. 2011. A natural inactivating mutant of human glucagon receptor exhibits multiple abnormalities in processing and signaling. Endocrinología y Nutrición 58 258–266. ( 10.1016/j.endonu.2011.04.002) [DOI] [PubMed] [Google Scholar]
- 5.Ro C, Chai W, Yu VE, Yu R. 2013. Pancreatic neuroendocrine tumors: biology, diagnosis,and treatment. Chinese Journal of Cancer 32 312–324. ( 10.5732/cjc.012.10295) [DOI] [PMC free article] [PubMed] [Google Scholar]
- 6.Gelling RW, Du XQ, Dichmann DS, Rømer J, Huang H, Cui L, Obici S, Tang B, Holst JJ, Fledelius C, et al. 2003. Lower blood glucose, hyperglucagonemia, and pancreatic α cell hyperplasia in glucagon receptor knockout mice. PNAS 100 1438–1443. ( 10.1073/pnas.0237106100) [DOI] [PMC free article] [PubMed] [Google Scholar]
- 7.Kazda CM, Garhyan P, Kelly RP, Shi C, Lim CN, Fu H, Landschulz WH, Deeg MA. 2016. A randomized, double-blind, placebo-controlled phase 2 study of the glucagon receptor antagonist LY2409021 in patients with type 2 diabetes. Diabetes Care 39 1241–1249. ( 10.2337/dc15-1643) [DOI] [PubMed] [Google Scholar]
- 8.Longuet C, Robledo AM, Dean ED, Dai C, Ali S, McGuinness I, de Chavez V, Vuguin PM, Charron MJ, Powers AC, et al. 2012. Liver-specific disruption of the murine glucagon receptor produces α-cell hyperplasia: evidence for a circulating α-cell growth factor. Diabetes 62 1196–1205. ( 10.2337/db11-1605) [DOI] [PMC free article] [PubMed] [Google Scholar]
- 9.Solloway Mark J, Madjidi A, Gu C, Eastham-Anderson J, Clarke Holly J, Kljavin N, Zavala-Solorio J, Kates L, Friedman B, Brauer M, et al. 2015. Glucagon couples hepatic amino acid catabolism to mTOR-dependent regulation of α-cell mass. Cell Reports 12 495–510. ( 10.1016/j.celrep.2015.06.034) [DOI] [PubMed] [Google Scholar]