Abstract
Liposomal amphotericin B (LAmB) is widely used in the treatment of invasive fungal disease (IFD) in adults and children. There are relatively limited pharmacokinetic (PK) data to inform optimal dosing in children that achieves systemic drug exposures comparable to those of adults. Our objective was to describe the pharmacokinetics of LAmB in children aged 1 to 17 years with suspected or documented IFD. Thirty-five children were treated with LAmB at doses of 2.5 to 10 mg kg−1 daily. Samples were taken at baseline and at 0.5- to 2.0-h intervals for 24 h after receipt of the first dose (n = 35 patients) and on the final day of therapy (n = 25 patients). LAmB was measured using high-performance liquid chromatography (HPLC). The relationship between drug exposure and development of toxicity was explored. An evolution in PK was observed during the course of therapy, resulting in a proportion of patients (n = 13) having significantly higher maximum serum concentrations (Cmax) and areas under the concentration-time curve from 0 to 24 h (AUC0–24) later in the course of therapy, without evidence of drug accumulation (trough plasma concentration accumulation ratio of <1.2). The fit of a 2-compartment model incorporating weight and an exponential decay function describing volume of distribution best described the data. There was a statistically significant relationship between mean AUC0–24 and probability of nephrotoxicity (odds ratio, 2.37; 95% confidence interval, 1.84 to 3.22; P = 0.004). LAmB exhibits nonlinear pharmacokinetics. A third of children appear to experience a time-dependent change in PK, which is not explained by weight, maturation, or observed clinical factors.
INTRODUCTION
The small unilamellar liposomal formulation of amphotericin B (LAmB; AmBisome) is widely used for the treatment of invasive fungal disease (IFD) in adults and children. This compound has been available for over 2 decades and is a first-line agent in the treatment of serious opportunistic diseases that include invasive aspergillosis, invasive candidiasis, cryptococcal meningoencephalitis, and mucormycosis (1–4).
Despite extensive clinical experience, many of the details relating to the underlying pharmacological properties of LAmB remain unclear. A limited number of data sets and population pharmacokinetic (PK) models have been reported for LAmB (5–7). These analyses were based on data gathered from patients receiving relatively low doses and exclusively sampled early in the course of therapy. There are very limited data reporting the PK of LAmB in pediatric populations.
A better understanding of the pharmacological properties of LAmB remains a priority and would enable optimal dosing, particularly for special populations, such as infants and children. Doses ranging from 2.5 to 10 mg kg−1 per day were studied, and each patient was intensively sampled. The individual PK profiles for a subpopulation of participants (n = 25) were compared at the commencement and end of therapy.
MATERIALS AND METHODS
Patients and antifungal regimen.
This study was designed as a prospective, multicenter, open-label phase II clinical trial. Study protocol approval was obtained from the Ethics Committees of the National Cancer Institute (Bethesda, MD, USA), Children's National Medical Center (Washington, DC, USA), and Georgetown University Medical Center (Washington, DC, USA). Informed consent was obtained prior to enrollment in each case. A total of 35 children with a diagnosis of confirmed or suspected IFD were enrolled. Patients received LAmB infused over 1 h at doses of 2.5, 5.0, 7.5, or 10.0 mg kg−1 daily (n = 9, 13, 8, and 8, respectively). Two patients received LAmB as treatment for more than one discrete clinical episode requiring antifungal therapy. Patients undergoing multiple discrete episodes were assigned the same identification number on each occasion and were handled using the dosing reset function in Pmetrics.
LAmB (AmBisome; Gilead Sciences, Inc., Foster City, California) was supplied as a lyophilized powder and stored at 2 to 8°C until use. Powder (50 mg) was reconstituted with 12.5 ml of sterile water to a concentration of 4 mg−1 ml and then further diluted in 5% dextrose. Reconstituted drug was used within 6 h.
Pharmacokinetic sampling.
PK samples were obtained on the first and last days of therapy. The first day of LAmB administration was defined as day one. Heparinized whole-blood samples (0.6 to 1 ml) were collected by peripheral intravenous catheter. Samples were obtained prior to administration and at 0.5- to 2.0-h intervals for 24 h following the start of each infusion. A total of 7 to 12 samples were obtained per patient within each sampling period (total sampling blood volumes of <3 ml/kg of body weight within 24 h). Sampling was repeated in 16 patients on the last day of therapy (12 to 41 days) using the same sampling schedule. Plasma fractions were separated by centrifugation at 1,500 × g for 10 min at 4°C and stored at −80°C until analysis.
Concentrations of LAmB in plasma were determined by a high-performance liquid chromatographic assay (8). Briefly, total active drug and internal standard, 3-nitrophenol, were extracted in methanol and separated by reversed-phase chromatography. The separation was performed isocratically using a Supelcosil ABZ+Plus analytical column (3-μm particle size; 150 mm by 4.6 mm internal diameter; Supelco, Bellefonte, Pennsylvania), coupled to a Keystone C18 guard column (3-μm particle size; 7.5 mm by 4.6 mm; Western Analytical, Murrieta, California). The mobile phase, consisting of 10 mM sodium acetate buffer, including 10 mM EDTA (pH 3.6) and acetonitrile (650:350, vol/vol), was delivered at a flow rate of 1.0 ml/min using a Spectra-Physics model 250 pump (Thermo Separations, San Jose, California). UV absorbency peaks were detected at a wavelength of 406 nm using a Waters model 440 UV-visible detector (Waters Corp., Milford, Massachusetts). Two overlapping standard curves were used: 0.05 to 20 μg/ml and 0.5 to 200 μg/ml. The assay was linear over a range of 0.05 to 20 and 0.5 to 200 μg/ml (r2 > 0.995). Intra- and interday coefficients of variation were 9.5 and 7.0% as well as 5.4 and 6.0%, respectively, and the limit of quantification was 0.05 μg/ml. The average recovery was 90.5% at the concentrations of quality control samples with a standard deviation (SD) of 6.2%.
Population pharmacokinetic modeling.
For population pharmacokinetic modeling, data were analyzed using a nonparametric methodology within the program Pmetrics (version 1.2.6; University of Southern California, Los Angeles, CA) (9). The observed data were weighted using the inverse of the estimated assay variance.
Structural models were constructed and used to fit patient data. One-, two-, and three-compartment models with zero-order drug input into the central compartment and both first-order and nonlinear (Michaelis-Menten) elimination from the central compartment were explored. A proportion of patients had concentration-time profiles that indicated an intraindividual change in PK during the course of therapy (n = 13; 52%). Affected individuals demonstrated a marked increase in excursion of drug concentrations from Cmax to trough plasma concentration (Cmin) and a disproportionate increase in AUC0–24 (Fig. 1). This change was not associated with rising trough concentrations, suggesting the phenomenon did not result from drug accumulation resulting from conventional nonlinear (Michaelis-Menten) kinetics (accumulation ration [AR] of <1.2). Inspection of the data suggested the clearance of drug was the same in both sampling periods. Hence, the following structural model that allowed the volume of distribution (V) to change with time was explored. In this model, volume contracted with time and was described using an exponential decay function. Clearance (CL) was scaled according to weight using a standard 0.75 power function. The following differential equations describe the final model:
| (1) |
| (2) |
| (3) |
where X(1) and X(2) represent the total (bound and free) amount of LAmB (in milligrams) in the central (c) and peripheral (p) compartments, respectively. R(1), Kcp, and Kpc represent the rate of infusion into the central compartment (in milligrams per hour) and first-order intercompartmental rate constants, respectively. CL is normalized according to data for a 70-kg individual and allometrically scaled. The volume of the central compartment (Vc) is described by an exponential decay function in which initial volume (Vin) reduced over time according to a rate constant to a final volume (Vfin).
FIG 1.
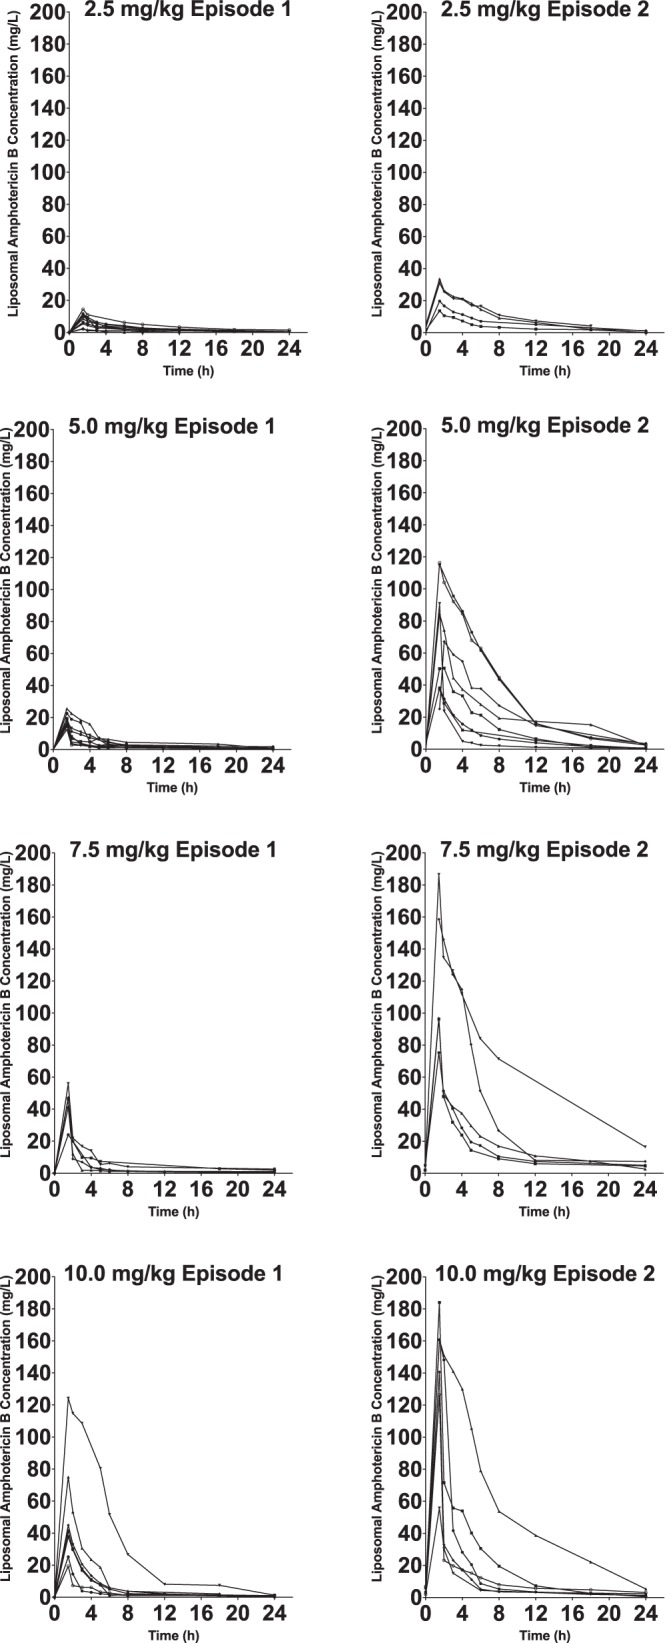
Concentration-time profiles for each patient on day one of therapy (n = 35) and at completion of therapy (n = 25). Closed circles are the raw pharmacokinetic data from each patient.
The goodness-of-fit of each model to the data was assessed by visual inspection of the observed-predicted values and following linear regression of the observed-predicted values both before and after the Bayesian step. The coefficient of determination (r2) and the slope and intercept of each regression were calculated. Statistical comparison of models was based on likelihood ratio, in which twice the likelihood difference was evaluated against a χ2 distribution with an appropriate number of degrees of freedom. In addition, predictive performance was assessed according to weighted-mean errors (a measure of bias) and bias-adjusted weighted-mean-squared errors (a measure of precision).
The final selected model was validated using a nonparametric bootstrap resampling technique. Three hundred bootstrap data sets were constructed based on random sampling with replacement using ADAPT 5. Measures of central tendency and dispersion and the 95% confidence interval (CI) for each parameter value were calculated and compared with estimates from original data. The selected structural model was then implemented within the simulation module of ADAPT 5 (10). Bayesian estimates of the PK parameters for each patient were used to calculate simulated peak plasma concentration (Cmax), trough plasma concentration (Cmin), and area under the concentration time curve over 24 h (AUC0–24) at defined therapeutic time points.
Potential relationships between measures of drug exposure (Cmax, Cmin, absolute LAmB dosage, weight-adjusted dosage, AUC0–24, and mean AUC0–24) and toxicity were explored. Toxicity was defined as changes from baseline values at commencement of therapy with the following parameters: nephrotoxicity as an increase in serum creatinine (SCr) of ≥0.5 mg/dl or doubling of baseline value, hypokalemia as a fall in potassium of ≤3.0 mmol/liter or ≥50% from baseline, anemia as a hemoglobin of ≤8.0 g/dl, and hepatotoxicity as a rise in bilirubin by ≥1.5 mg/dl or aspartate transaminase or alanine aminotransfersase ≥3 times above baseline. A conservative definition was used to define changes in biological parameters in order to overcome variability in sampling between patients; the pretreatment value was subtracted from the highest measurement observed for each patient during the treatment course.
RESULTS
The patient demographics of the study cohort are summarized in Table 1. The mean ± SD weight was 26.9 ± 14.0 kg with a range of 8.8 to 67.5 kg. There was wide variability in the duration of therapy: the mean ± SD was 11.9 ± 9.41 days of therapy with a range of 1 to 41 days. The most common underlying diagnosis was hematological malignancy (n = 21). Nine patients had undergone allogeneic hematopoietic stem cell transplantation (HSCT), and 23 received concomitant antineoplastic chemotherapy. The majority of patients received LAmB as empirical therapy for suspected invasive fungal infection (IFI) (n = 31). Seven patients received treatment for confirmed IFI. There were two cases of invasive aspergillosis due to Aspergillus fumigatus and a further case that developed during treatment with LAmB that was classified as a breakthrough infection. Three patients had invasive candidiasis: one central-line infection and one severe oesophagitis due to Candida albicans and one case of candidemia caused by Candida parapsilosis. There was a single case of cryptococcal meningoencephalitis complicating HIV infection. Clinical success was defined according to clinical, radiological, and mycological responses during the study period plus relapse-free survival at 2 months after the end of therapy. Clinical success was reported in 76% of probable (n = 29) and 43% (n = 3) of proven fungal infections.
TABLE 1.
Patient demographics of cohorts undergoing sampling on day one of therapy and at steady state
| Demographic | Value(s) |
|
|---|---|---|
| Day one (n = 35) | Steady state (n = 25) | |
| Age (mean ± SD, range; yr) | 8.7 ± 4.6 (1–17) | 10.5 ± 6.6 (1–17) |
| Gender (male:female) | 22:13 | 15:10 |
| Weight (mean ± SD, range; kg) | 26.9 ± 14.0 (8.8–67.5) | 25.4 ± 16.2 (11.2–67.5) |
| Duration of therapy (mean ± SD, range; days) | 11.9 ± 19.4 (1–41) | 15.5 ± 11.3 (9.5–41) |
| Underlying diagnosis (no. of patients) | ||
| Hematopoietic stem cell transplant | ||
| Leukemia | 6 | 5 |
| Sickle cell disease | 1 | 1 |
| Aplastic anemia | 1 | 0 |
| Chemotherapy | ||
| Leukemia | 8 | 5 |
| Lymphoma | 7 | 5 |
| Solid tumor | 7 | 4 |
| HIV | 4 | 4 |
| Chronic granulomatous disease | 1 | 1 |
| Clinical syndrome (no. of patients) | ||
| Established infection | 6 | 6 |
| Empirical treatment | 29 | 19 |
| Pathogen (no. of patients) | ||
| Candida albicans | 2 | 2 |
| Candida parapsilosis | 1 | 1 |
| Aspergillus fumigatus | 3 | 3 |
| Cryptosporidium | 1 | 1 |
| Clinical response (no. of patients) | ||
| Success | 29 | 21 |
| Failure | 8 | 4 |
| Breakthrough | 1 | 0 |
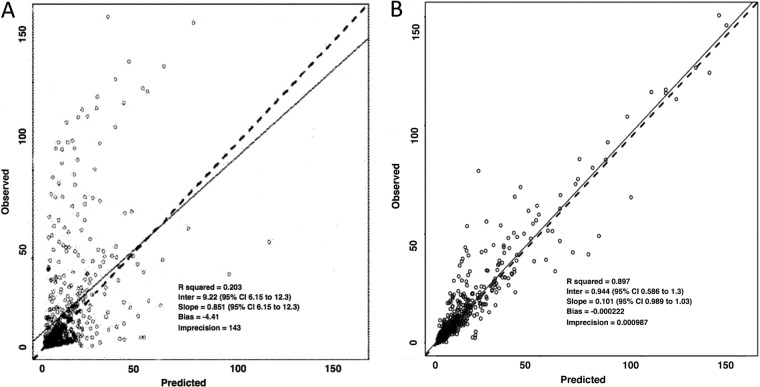
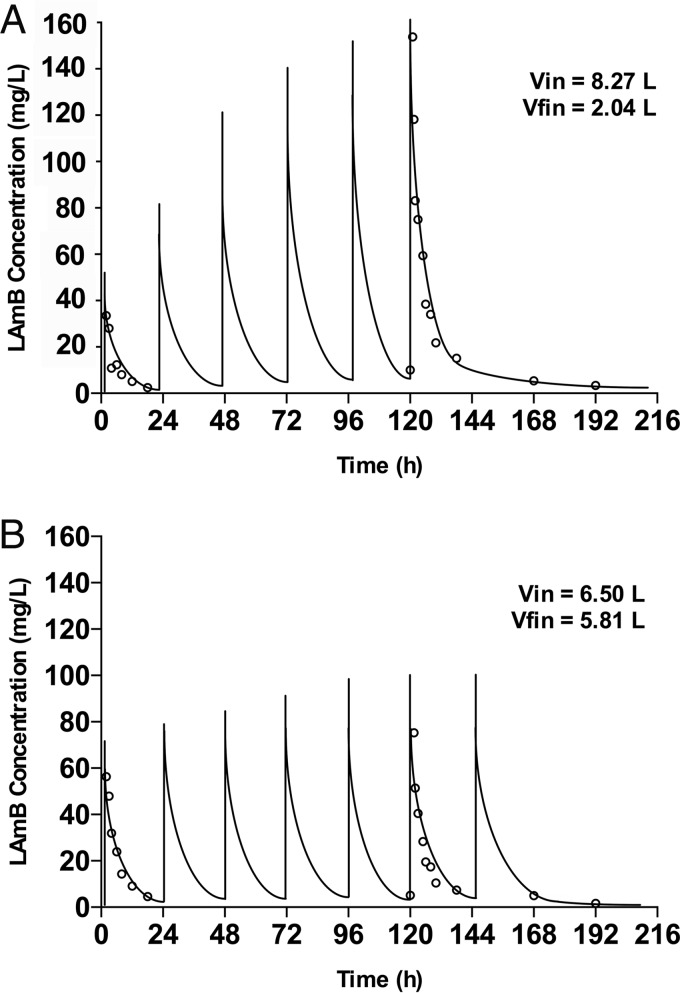
The Bayesian estimates for clearance obtained from standard two-compartment models for each patient were plotted against weight. A relationship between the log10-transformed estimates was apparent. The performance of models incorporating an allometric power function was therefore investigated using a scaling exponent fixed at 0.75. No significant relationship was found between Bayesian estimates for volume of distribution (V) and weight. Differences in clinical factors that might be predicted to alter the PK of LAmB were explored. No significant differences were identified in liver function, serum albumin, white blood cell (WBC) count, total protein concentrations, and use of parenteral nutrition and concomitant steroids. A relatively poor fit of standard model structures was apparent (for example, the performance of a standard two-compartment model) (Fig. 2). Conventional compartmental model structures failed to account for the widening excursion of drug concentrations observed in a portion of patients. The parameter estimates for the base and final model are summarized in Table 2. The fit of the selected model incorporating a function describing contraction in V was satisfactory (r2 = 0.90) and compared favorably to a standard 2-compartment model. The final model consisted of eight support points. Measures of bias and precision were acceptable (Fig. 2). The bootstrap mean and 95% CI values for parameters closely approximated the estimates obtained from the final model (Table 3), indicating that the parameter estimates from the final model were robust. Both the mean and median parameter values resulted in comparable intercepts, slopes, and overall r2 values. The log-likelihood value for the final model was significantly better (more positive) than for the standard 2-compartment model (χ2 = 48.95; P value of <0.001). Figure 3 shows the simulated concentration-time profiles and raw data for two examples of patients that exhibited time-dependent and time-independent changes in PK profiles.
FIG 2.
Scatter plots showing observed versus predicted values for population pharmacokinetic models after the Bayesian step with a standard 2-compartment model (A) and selected model (B). Open circles, dashed lines, and solid lines represent individual observed-predicted data points, line of identity, and the linear regression of observed-predicted values, respectively.
TABLE 2.
Parameter estimates for the final 2-compartment pharmacokinetic model
| Parameter and modela | Vin (liter) | Vfin (liter) | Kcp (h−1) | Kpc (h−1) | K (h−1) | CL (liter h−1 70 kg−1) |
|---|---|---|---|---|---|---|
| Base | ||||||
| Mean | 4.543 | NAb | 0.28 | 0.888 | NA | 0.488 |
| Median | 4.095 | NA | 0.184 | 0.254 | NA | 0.545 |
| SD | 3.44 | NA | 0.252 | 0.387 | NA | 0.29 |
| Error (CV) | 75.72 | NA | 90.025 | 43.581 | NA | 59.426 |
| Selected | ||||||
| Mean | 10.654 | 2.326 | 0.21 | 0.057 | 0.303 | 0.67 |
| Median | 7.998 | 2.986 | 0.178 | 0.033 | 0.027 | 0.665 |
| SD | 1.523 | 0.978 | 0.130 | 0.01 | 0.094 | 0.239 |
| Error (CV) | 14.295 | 42.064 | 61.905 | 17.544 | 31.023 | 35.672 |
CV, coefficient of variation.
NA, not applicable.
TABLE 3.
Bootstrap estimates of the selected pharmacokinetic model
| Parameter | Bootstrap |
Final model |
||
|---|---|---|---|---|
| Mean estimate | 95% CI | Mean estimate | 95% CI | |
| Vin (liter) | 10.677 | 10.646–10.87 | 10.654 | 10.67–10.87 |
| Vfin (liter) | 2.345 | 2.181–3.023 | 2.326 | 2.162–3.01 |
| Kcp (h−1) | 0.311 | 0.127–0.42 | 0.210 | 0.108–0.388 |
| Kpc (h−1) | 0.057 | 0.043–0.061 | 0.057 | 0.043–0.061 |
| K (h−1) | 0.303 | 0.21–0.355 | 0.302 | 0.21–0.351 |
| CL (liter h−1 70 kg−1) | 0.675 | 0.555–0.781 | 0.670 | 0.548–0.797 |
FIG 3.
Concentration-time profiles for two patients receiving LAmB (10 mg kg−1). Initial (Vin) and final (Vfin) estimates for volume of distribution (V) are shown. Open circles and solid lines represent the raw data and simulated concentration-time profiles for each patient, respectively. Patient A exhibits evolving PK with a contraction in the V, while patient B exhibits stable V.
Dose-exposure relationships were further explored. No correlation between absolute dose and exposure (Cmax, Cmin, or AUC0–24) was observed, an expected finding given the significant variability in weight within the study population. Significant relationships between dose per unit of weight and exposure were observed. Plots of dose-normalized Cmax and AUC0–24 suggest nonlinearity (Fig. 4), although a dosing threshold associated with a discrete change in exposure was not observed.
FIG 4.
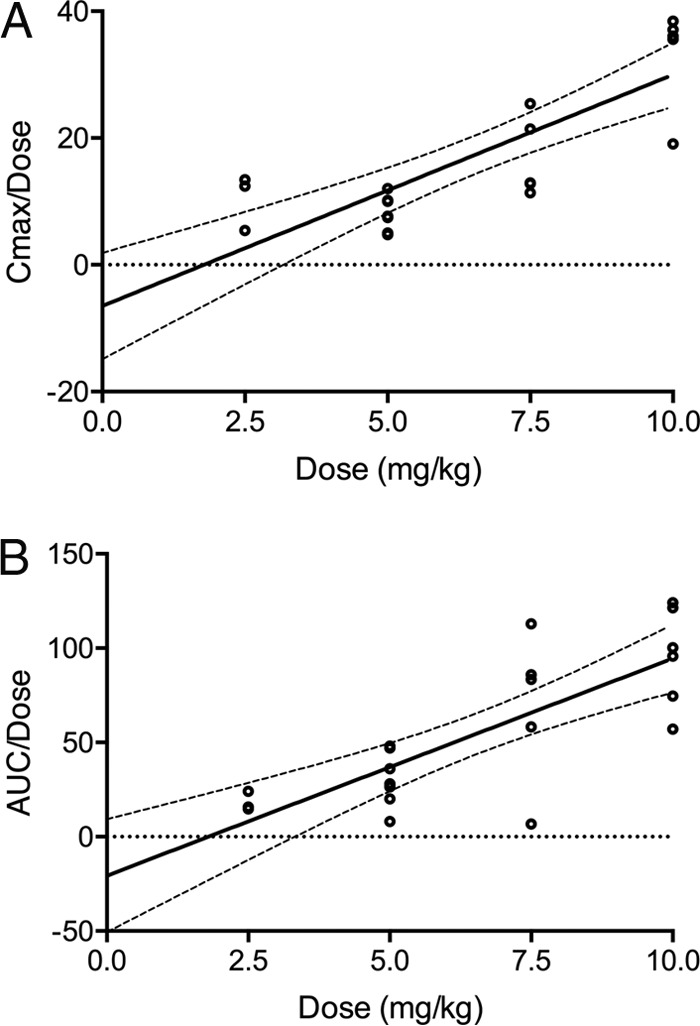
Comparisons of dose-normalized Cmax (A) and AUC0–24 (B) at steady state with respect to dose per unit of weight. Solid and dashed lines represent linear regression and 95% confidence intervals, respectively.
Transient renal impairment and hypokalemia were common, occurring in 46% (n = 16) and 23% (n = 8) of patients, respectively. A significant correlation between steady-state exposure (AUC0–24) and change in serum creatinine (ΔSCr) was observed (r = 0.594, P = 0.015) (Fig. 5). A statistically significant relationship existed between mean AUC0–24 and probability of developing nephrotoxicity (odds ratio, 2.37; 95% CI, 1.84 to 3.22; P = 0.004). There was insufficient clinical information to explore the impact of other potential determinants of renal impairment (for example, disease severity and concomitant nephrotoxic drugs) in this study cohort. No significant correlations were found between LAmB exposure (in terms of absolute dose, weight-adjusted dose, AUC0–24, or mean AUC0–24) and other toxicity measures, including hypokalemia, anemia, and hepatotoxicity.
FIG 5.
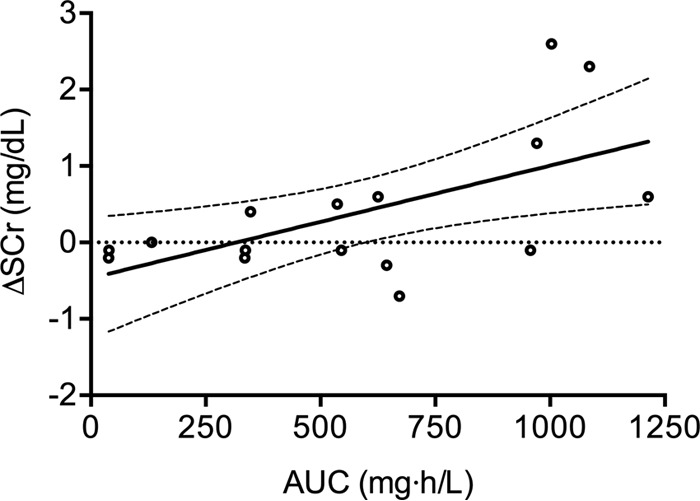
Relationship between Bayesian estimates of AUC0–24 at steady state with respect to change in serum creatinine. Solid and dashed lines represent linear regression and 95% confidence intervals, respectively.
DISCUSSION
Liposomal amphotericin B is used extensively for the treatment of IFD. Doses of 3 to 6 mg kg−1 are approved in the U.S and the European Union in both adults and children. These doses are not based on an in-depth knowledge of the pharmacology of the drug but rather result from preclinical in vivo studies and clinical trials that have attempted to identify regimens that appear safe and effective. There continues to be considerable uncertainty regarding the lowest effective dose of LAmB that achieves adequate antifungal effect. As a result, doses of 1 to 15 mg kg−1 have been studied in a range of clinical settings, including empirical therapy, invasive aspergillosis, invasive candidiasis, and cryptococcal meningoencephalitis (11–14).
Phase I/II clinical studies of LAmB in children and adults have highlighted variable, dose-dependent PK. Children and adults receiving LAmB at conservative daily doses of 1 to 3 mg kg−1 exhibit linear PK that are described by standard two- or three-compartment models with first-order elimination (5, 6, 7). Limited data suggest nonlinearity at higher doses. Walsh et al. observed time-dependent nonlinear PK and an apparent paradoxical dose-dependent exposure plateau in adults receiving daily doses of 7.5 to 15 mg kg−1 (3). The data from pediatric patients in this study similarly suggests that a proportion of patients exhibit time-dependent nonlinear PK. When the concentration-time profiles of patients exhibiting nonlinear PK are examined, a significant excursion in Cmin-Cmin is observed, a change not associated with a proportional increase in half-life that would be expected with classical nonlinear (Michaelis-Menten) clearance but rather appears to reflect a contraction in the volume of distribution during the course of therapy. Whereas the limited data from adults has suggested a paradoxical dose-dependent reduction in exposure at doses of >7.5 mg kg−1, in children higher doses appear to be associated with an increased probability of nonlinearity. The reason for this difference is unclear and warrants further study.
High-density lipoprotein (HDL)-mediated opsonization of lipid formulations of amphotericin B within plasma has been shown to drive uptake into mononuclear phagocytes and deposition within the liver and spleen (15–18). Hong et al. reported a negative correlation between Bayesian estimates of volume of distribution and the fraction of HDL-associated LAmB in 21 children and adolescents receiving LAmB at daily doses of 0.8 to 6 mg kg−1. We hypothesize that variable HDL saturation and/or phagocyte uptake are the pathophysiological processes driving the interindividual variability observed in this study. However, many patients in this small clinical cohort exhibited significant fluctuations in hematological parameters such as WBC count over the course of antifungal therapy, primarily due to underlying hemato-oncological diagnoses, and we were not able to further characterize relationships between specific hematological parameters and volume contraction. Other significant data, such as plasma HDL concentrations, were not quantified in this study. This is an interesting hypothesis that warrants further study in experimental models and/or as part of larger clinical trials. LAmB is generally well tolerated with a significantly improved toxicity profile compared to conventional amphotericin B deoxycholate (14). Doses of LAmB as high as 15 mg kg−1 daily have been reportedly well tolerated in adults (3). A number of studies, including one large randomized control trial, have, however, described dose-dependent toxicity with significantly higher rates of renal impairment and hypokalemia at doses at or above 10 mg kg−1 daily (1). In this study, a significant proportion of patients developed transient renal impairment and/or hypokalemia during the course of treatment. In view of the limited data available, significant interindividual variability, and lack of obvious inflection point in this relationship, further analysis to define exposure thresholds was not possible. The correlation between drug exposure and ΔSCr observed here suggests, however, that clinical vigilance and assiduous monitoring of renal function is required to minimize the probability of toxicity associated with LAmB.
Taken together, these data suggest that a significant proportion of pediatric patients receiving LAmB at daily doses of >5.0 mg kg−1 exhibit nonlinear PK with significantly higher peak concentrations and overall drug exposure. This phenomenon was not predicted by clinical covariates quantified in this study. Therapeutic drug monitoring (TDM) thus is likely to be of value in identifying this subpopulation in order to prevent toxicity. Effective implementation of TDM would require a more detailed understand of exposure-toxicity relationships and data describing disease severity in children with proven or probable IFD in order to define target exposure thresholds.
ACKNOWLEDGMENTS
W.W.H. has acted as a consultant for and received research support from Merck, Pfizer Inc., Astellas, Gilead Sciences, and F2G. T.J.W. receives research grants for experimental and clinical antimicrobial pharmacotherapeutics from Astellas, Novartis, Merck/Cubist, Pfizer, and Theravance. He has served as a consultant to Astellas, Merck/Cubist, Contrafect, Novartis, Pfizer, and Methylgene. A.H.G. has received research grants from Gilead and Merck, Sharp & Dohme, and Pfizer; is a consultant to Astellas, Basilea, Gilead, Merck, and Sharp & Dohme; and served at the speakers' bureaus of Astellas, Basilea, Gilead, Merck, Sharp & Dohme, Pfizer, Schering-Plough, and Zeneus/Cephalon. J.M.L., G.A., N.S., A.S., I.B., C.G., L.V.W., and P.F.J. have no conflicts of interest to declare.
We received funding from Astellas Pharma US, Inc.
REFERENCES
- 1.Cornely OA, Maertens J, Bresnik M, Ebrahimi R, Ullmann AJ, Bouza E, Heussel CP, Lortholary O, Rieger C, Boehme A, Aoun M, Horst HA, Thiebaut A, Ruhnke M, Reichert D, Vianelli N, Krause SW, Olavarria E, Herbrecht R, AmBiLoad Trial Study Group. 2007. Liposomal amphotericin B as initial therapy for invasive mold infection: a randomized trial comparing a high-loading dose regimen with standard dosing (AmBiLoad trial). Clin Infect Dis 44:1289–1297. doi: 10.1086/514341. [DOI] [PubMed] [Google Scholar]
- 2.Ellis M, Spence D, de Pauw B, Meunier F, Marinus A, Collette L, Sylvester R, Meis J, Boogaerts M, Selleslag D, Krcmery V, von Sinner W, MacDonald P, Doyen C, Vandercam B. 1998. An EORTC international multicenter randomized trial (EORTC number 19923) comparing two dosages of liposomal amphotericin B for treatment of invasive aspergillosis. Clin Infect Dis 27:1406–1412. [DOI] [PubMed] [Google Scholar]
- 3.Walsh TJ, Goodman JL, Pappas P, Bekersky I, Buell DN, Roden M, Barrett J, Anaissie EJ. 2001. Safety, tolerance, and pharmacokinetics of high-dose liposomal amphotericin B (AmBisome) in patients infected with Aspergillus species and other filamentous fungi: maximum tolerated dose study. Antimicrob Agents Chemother 45:3487–3496. doi: 10.1128/AAC.45.12.3487-3496.2001. [DOI] [PMC free article] [PubMed] [Google Scholar]
- 4.Shoham S, Magill SS, Merz WG, Gonzalez C, Seibel N, Buchanan WL, Knudsen TA, Sarkisova TA, Walsh TJ. 2010. Primary treatment of zygomycosis with liposomal amphotericin B: analysis of 28 cases. Med Mycol 48:511–517. doi: 10.3109/13693780903311944. [DOI] [PubMed] [Google Scholar]
- 5.Hong Y, Shaw PJ, Nath CE, Yadav SP, Stephen KR, Earl JW, McLachlan AJ. 2006. Population pharmacokinetics of liposomal amphotericin B in pediatric patients with malignant diseases. Antimicrob Agents Chemother 50:935–942. doi: 10.1128/AAC.50.3.935-942.2006. [DOI] [PMC free article] [PubMed] [Google Scholar]
- 6.Hope WW, Goodwin J, Felton TW, Ellis M, Stevens DA. 2012. Population pharmacokinetics of conventional and intermittent dosing of liposomal amphotericin B in adults: a first critical step for rational design of innovative regimens. Antimicrob Agents Chemother 56:5303–5308. doi: 10.1128/AAC.00933-12. [DOI] [PMC free article] [PubMed] [Google Scholar]
- 7.Wurthwein G, Young C, Lanvers-Kaminsky C, Hempel G, Trame MN, Schwerdtfeger R, Ostermann H, Heinz WJ, Cornely OA, Kolve H, Boos J, Silling G, Groll AH. 2012. Population pharmacokinetics of liposomal amphotericin B and caspofungin in allogeneic hematopoietic stem cell recipients. Antimicrob Agents Chemother 56:536–543. doi: 10.1128/AAC.00265-11. [DOI] [PMC free article] [PubMed] [Google Scholar]
- 8.Alak A, Moy S, Bekersky I. 1996. A high-performance liquid chromatographic assay for the determination of amphotericin B serum concentrations after the administration of AmBisome, a liposomal amphotericin B formulation. Ther Drug Monit 18:604–609. [DOI] [PubMed] [Google Scholar]
- 9.Neely MN, van Guilder MG, Yamada WM, Schumitzky A, Jelliffe RW. 2012. Accurate detection of outliers and subpopulations with Pmetrics, a nonparametric and parametric pharmacometric modeling and simulation package for R. Ther Drug Monit 34:467–476. doi: 10.1097/FTD.0b013e31825c4ba6. [DOI] [PMC free article] [PubMed] [Google Scholar]
- 10.D'Argenio DZ, Schumitzky A, Wang X. 2009. ADAPT 5 user's guide: pharmacokinetic/pharmacodynamic systems analysis software. Biomedical Simulations Resource, Los Angeles, CA. [Google Scholar]
- 11.Hamill RJ, Sobel JD, El-Sadr W, Johnson PC, Graybill JR, Javaly K, Barker DE. 2010. Comparison of 2 doses of liposomal amphotericin B and conventional amphotericin B deoxycholate for treatment of AIDS-associated acute cryptococcal meningitis: a randomized, double-blind clinical trial of efficacy and safety. Clin Infect Dis 51:225–232. doi: 10.1086/653606. [DOI] [PubMed] [Google Scholar]
- 12.Hope WW, Castagnola E, Groll AH, Roilides E, Akova M, Arendrup MC, Arikan-Akdagli S, Bassetti M, Bille J, Cornely OA, Cuenca-Estrella M, Donnelly JP, Garbino J, Herbrecht R, Jensen HE, Kullberg BJ, Lass-Florl C, Lortholary O, Meersseman W, Petrikkos G, Richardson MD, Verweij PE, Viscoli C, Ullmann AJ, ESCMID Fungal Infection Study Group. 2012. ESCMID* guideline for the diagnosis and management of Candida diseases 2012: prevention and management of invasive infections in neonates and children caused by Candida spp. Clin Microbiol Infect 18(Suppl 7):S38–S52. doi: 10.1111/1469-0691.12040. [DOI] [PubMed] [Google Scholar]
- 13.Walsh TJ, Anaissie EJ, Denning DW, Herbrecht R, Kontoyiannis DP, Marr KA, Morrison VA, Segal BH, Steinbach WJ, Stevens DA, van Burik JA, Wingard JR, Patterson TF, Infectious Diseases Society of America. 2008. Treatment of aspergillosis: clinical practice guidelines of the Infectious Diseases Society of America. Clin Infect Dis 46:327–360. doi: 10.1086/525258. [DOI] [PubMed] [Google Scholar]
- 14.Walsh TJ, Finberg RW, Arndt C, Hiemenz J, Schwartz C, Bodensteiner D, Pappas P, Seibel N, Greenberg RN, Dummer S, Schuster M, Holcenberg JS. 1999. Liposomal amphotericin B for empirical therapy in patients with persistent fever and neutropenia. National Institute of Allergy and Infectious Diseases Mycoses Study Group. N Engl J Med 340:764–771. [DOI] [PubMed] [Google Scholar]
- 15.Wasan KM, Grossie VB Jr, Lopez-Berestein G. 1994. Concentrations in serum and distribution in tissue of free and liposomal amphotericin B in rats during continuous intralipid infusion. Antimicrob Agents Chemother 38:2224–2226. [DOI] [PMC free article] [PubMed] [Google Scholar]
- 16.Wasan KM, Kennedy AL, Cassidy SM, Ramaswamy M, Holtorf L, Chou JW, Pritchard PH. 1998. Pharmacokinetics, distribution in serum lipoproteins and tissues, and renal toxicities of amphotericin B and amphotericin B lipid complex in a hypercholesterolemic rabbit model: single-dose studies. Antimicrob Agents Chemother 42:3146–3152. [DOI] [PMC free article] [PubMed] [Google Scholar]
- 17.Wasan KM, Morton RE, Rosenblum MG, Lopez-Berestein G. 1994. Decreased toxicity of liposomal amphotericin B due to association of amphotericin B with high-density lipoproteins: role of lipid transfer protein. J Pharm Sci 83:1006–1010. [DOI] [PubMed] [Google Scholar]
- 18.Wasan KM, Rosenblum MG, Cheung L, Lopez-Berestein G. 1994. Influence of lipoproteins on renal cytotoxicity and antifungal activity of amphotericin B. Antimicrob Agents Chemother 38:223–227. [DOI] [PMC free article] [PubMed] [Google Scholar]


