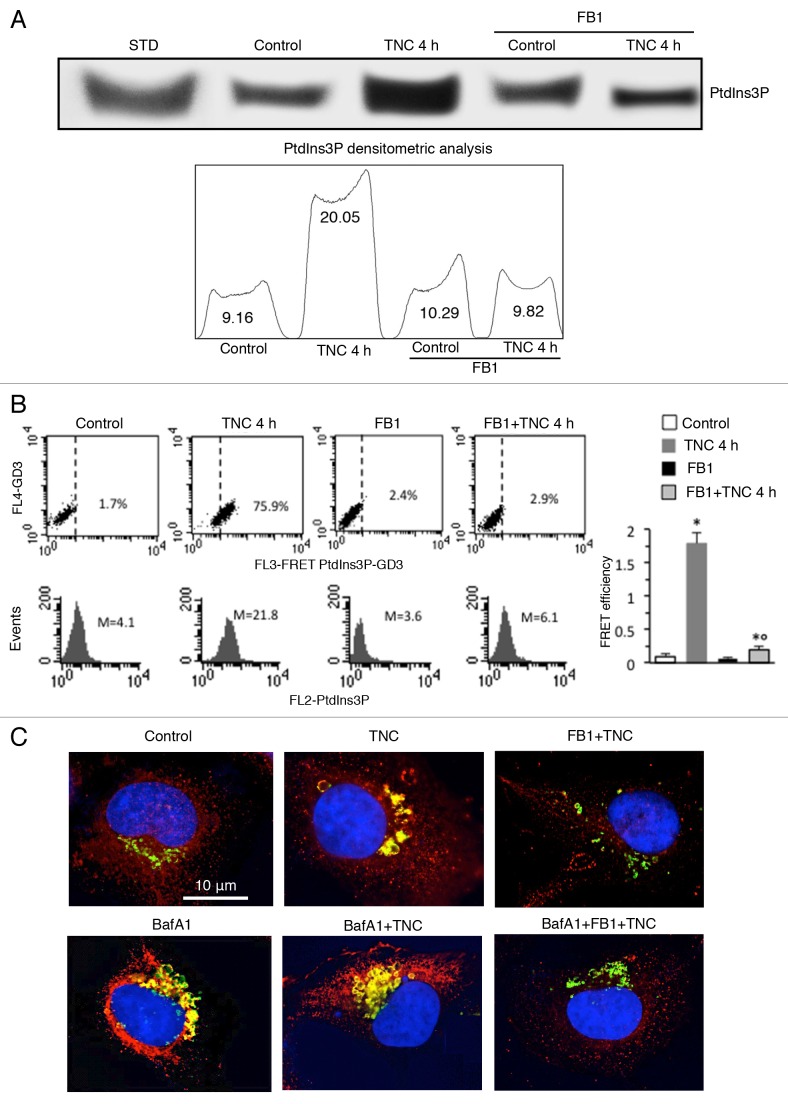
Figure 3. Involvement of GD3 in the autophagic machinery. (A) Human fibroblasts, untreated or treated with TNC (5 µM for 4 h at 37 °C), in the presence or in the absence of pretreatment with FB1, were subjected to phosphoinositides extraction. The extracts were run on HPTLC aluminum-backed silica gel and were analyzed for the presence of PtdIns3P, using an anti-PtdIns3P Mab. Densitometric scanning analysis of PtdIns3P levels was performed by MAC OS X using NIH Image 1.62 software. (B) Flow cytometry analysis of GD3-PtdIns3P association by FRET technique in: control cells (first panel), cells treated with FB1 (second panel) or TNC 4 h in the absence (third panel) or in the presence (fourth panel) of FB1. Numbers indicate the percentage of FL3-positive events obtained in one experiment representative of 4. In the bottom row is shown PtdIns3P intracellular amount in the corresponding sample and was quantitatively expressed by the median fluorescence intensity. Bar graph shows the evaluation of FE, according to the Riemann algorithm, of GD3-PtdIns3P association. Results represent the mean ± SD from 3 independent experiments. Statistical analyses indicated that: i) GD3-PtdIns3P association was significantly higher in cells treated 4 h with TNC than in control cells and that ii) cell pretreatment with FB1 significantly prevents TNC-induced associations. *P < 0.01 vs. control; °P < 0.01 vs. TNC 4 h. (C) IVM analysis after cell staining for GD3 and LC3-II in control cells (first picture) and in cells treated with TNC in the absence (second picture) or presence (third picture) of FB1 and challenged (bottom row) or not (upper row) with BafA1. Yellow fluorescence observed in the merge picture indicates GD3-LC3-II colocalization.

An official website of the United States government
Here's how you know
Official websites use .gov
A
.gov website belongs to an official
government organization in the United States.
Secure .gov websites use HTTPS
A lock (
) or https:// means you've safely
connected to the .gov website. Share sensitive
information only on official, secure websites.
