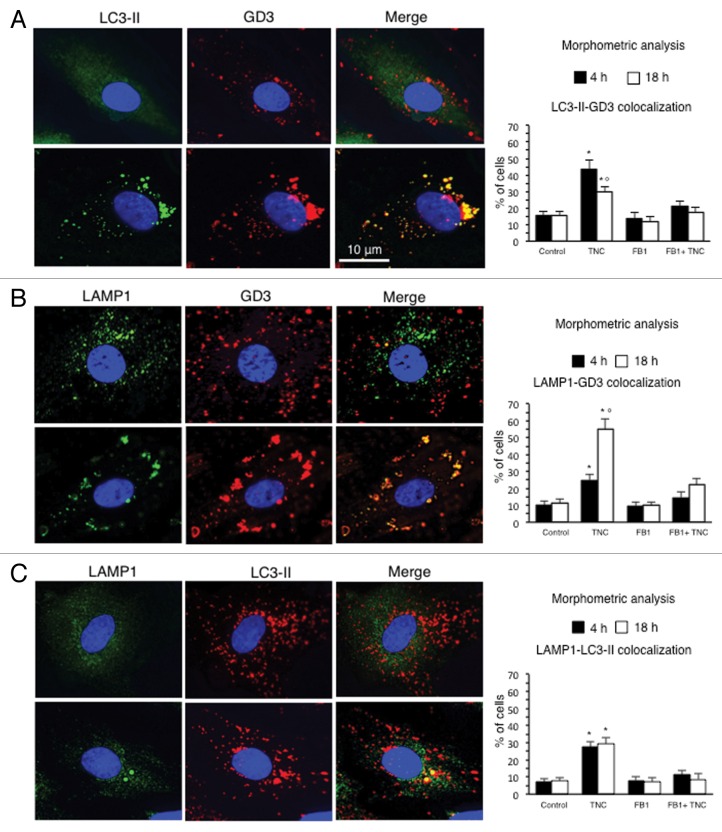
Figure 4. GD3 intracellular localization during the autophagic process. IVM analysis after cell staining for (A) GD3 and LC3-II, (B) GD3 and LAMP1 and (C) LC3-II and LAMP1 in control cells (upper row) and in cells treated with TNC (bottom row). Yellow fluorescence observed in the merge picture in TNC-treated cells indicates GD3-LC3-II, GD3-LAMP1 or LC3-II-LAMP1 colocalization. Bar graphs, showing morphometric analysis, evaluate GD3-LC3-II, GD3-LAMP1 and LC3-II-LAMP1 colocalization. In ordinate the percentage of cells in which we observed yellow fluorescence is shown. Data are reported as mean ± SD of the results obtained in 3 independent experiments. *P < 0.01 vs. control; °P < 0.01 vs. TNC 4 h.

An official website of the United States government
Here's how you know
Official websites use .gov
A
.gov website belongs to an official
government organization in the United States.
Secure .gov websites use HTTPS
A lock (
) or https:// means you've safely
connected to the .gov website. Share sensitive
information only on official, secure websites.
