

Abstract
Introduction
Many adult women have resident urinary bacteria (urinary microbiome/microbiota). In adult women affected by urinary urgency incontinence (UUI), the etiologic and/or therapeutic role of the urinary microbiome/microbiota remains unknown.
Hypothesis
Microbiome/microbiota characteristics will relate to clinically relevant treatment response to oral UUI medication.
Methods
Adult women initiating oral medication treatment for UUI and a comparator group of unaffected women were recruited in a tertiary care health care system. All participants provided baseline clinical data and urine. Women with UUI were given 5mg solifenacin with potential dose escalation to 10mg for inadequate UUI symptoms control at 4 weeks. Additional data and urine samples were collected from women with UUI at 4 and 12 weeks. The samples were assessed by 16S rRNA gene sequencing and enhanced quantitative urine culturing. The primary outcome was treatment response as measured by the validated Patient Global Symptom Control (PGSC) questionnaire. Clinically relevant UUI symptom control was defined as a 4 or 5 score on the PGSC.
Results
The diversity and composition of the urinary microbiome/microbiota of women with and without UUI differed at baseline. Women with UUI had more bacteria and a more diverse microbiome/microbiota. The clinical response to solifenacin in UUI participants was related to baseline microbiome/microbiota, with responders more likely to have fewer bacteria and a less diverse community at baseline. Non-responders had a more diverse community that often included bacteria not typically found in responders.
Conclusions
Knowledge of an individual’s urinary microbiome/microbiota may help refine UUI treatment. Complementary tools, DNA sequencing and expanded urine culture, provide information about bacteria that appear related to UUI incontinence status and UUI treatment response in this population of adult women.
Keywords: Urinary incontinence, clinical microbiology, solifenacin
Brief Summary
Adult womens’ individual urinary microbiome/microbiota differ based on presence of UUI. The microbiota relate to UUI treatment response in women treated with oral UUI medication.
INTRODUCTION
Many adult women undergo treatment for urinary urgency incontinence (UUI), often with oral anticholinergic medication, such as solifenacin [1]. This medication class targets M3 muscarinic receptors to decrease smooth muscle contraction, relieving UUI symptoms of urgency, frequency and urgency incontinence [1]. Although solifenacin decreases urgency episodes in approximately 60% of treated patients, symptoms may persist [2–4] with approximately 40% of treated patients reporting bothersome symptoms [5]. Clinicians recognize this lack of response, although the cause remains unclear and studies into the biologic basis for persistent symptoms are lacking. Many UUI-affected patients are considered to have idiopathic etiology; however, this view pre-dates emerging evidence of resident urinary bacterial communities (urinary microbiota), recently reviewed [6–8]. DNA sequencing and expanded urine culture techniques have demonstrated that adult urine is not sterile [9–16,6] and UUI-affected women have different resident bacterial compositions than non-UUI control populations [11].
In this prospective cohort of adult women with UUI, we compared baseline urinary microbiota of women with UUI to those of non-affected controls. For UUI-affected women subsequently undergoing clinically indicated UUI treatment with solifenacin, we also determined urinary microbiota profiles throughout 12 weeks of treatment, using additional longitudinal samples collected at 4 and 12 weeks. We hypothesized that the microbiome/microbiota (e.g. diversity, overall community structure, and/or specific organisms) would differ between women with and without UUI and between those that responded to solifenacin and those that did not. Two complementary bacterial assessments, sequencing and expanded quantitative urine cultures (EQUC) [10], were used to overcome the insensitivity of standard urine cultures. EQUC was not initially available; however, once this technique was available, it was applied to all remaining samples.
METHODS
Study Design and Population
This 12-week open label study began following Institutional Review Board approval. Participants gave verbal and written research consent for chart abstraction and urine collection with analysis for research purposes. Between August 2012 and July 2014, two cohorts of adult women were recruited at a tertiary health care setting, Loyola University Medical Center. Potential participants were screened for eligibility using the long version of the validated symptom questionnaire, the Pelvic Floor Distress Inventory (PFDI) [17,18]. Women seeking UUI treatment were recruited from a specialty Female Pelvic Medicine and Reconstructive Surgery center. Comparison controls screened negative for UUI using the PFDI and were recruited from women’s health practices within Loyola’s system. These controls were derived from a population of gynecologic patients; those who underwent surgical procedures had a variety of benign gynecologic conditions, most commonly abnormal uterine bleeding confirmed to be of a benign nature. Enrolled participants also completed the overactive bladder questionnaire (OAB-Q) [19]. Exclusion criteria for both cohorts included current urinary tract infection (UTI) (based on urine dipstick), history of recurrent UTI, antibiotic exposure in the past four weeks for any reason, immunologic deficiency, neurological disease known to affect the lower urinary tract, pelvic malignancy or radiation, untreated symptomatic pelvic organ prolapse (POP) greater than POP-Q Stage II (vaginal protrusion more than one centimeter outside of the vaginal hymen) or pregnancy.
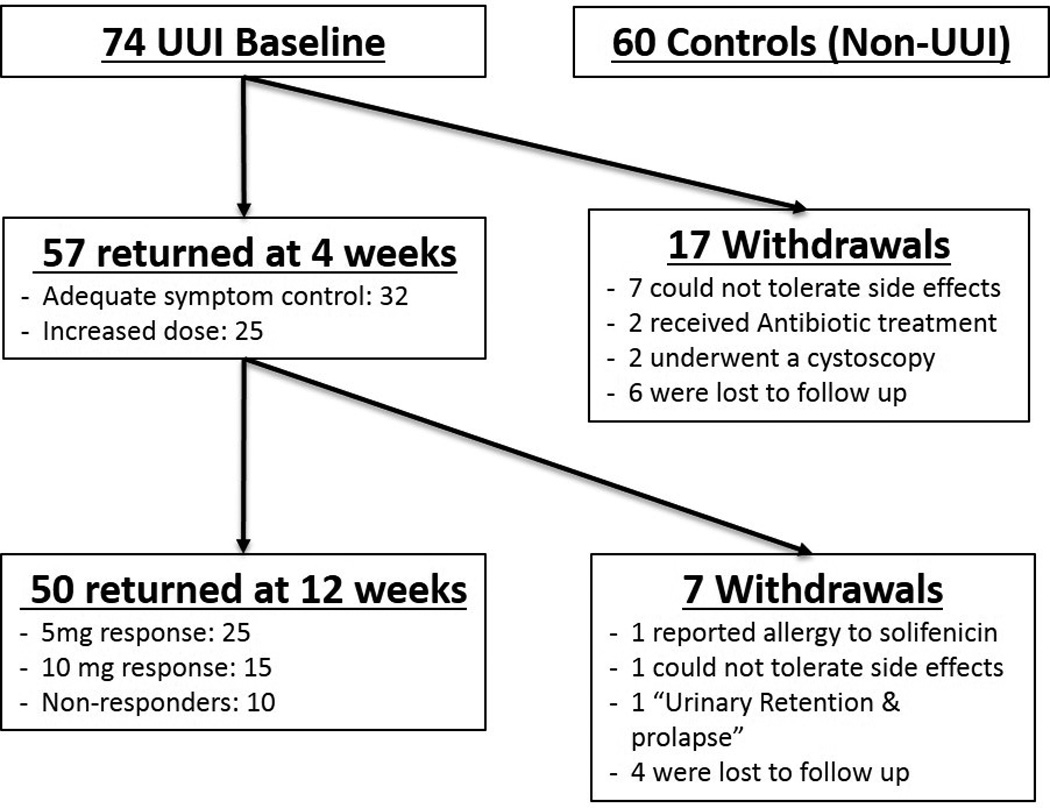
Control participants, without overactive bladder symptoms, provided a single catheterized urine sample for research purposes as well as clinical and questionnaire data. As part of normal clinical care, UUI-affected participants provided a catheterized urine sample prior to UUI treatment with solifenacin, which was provided at no cost for 12 weeks. Participants with UUI also agreed to provide 2 additional catheterized urine samples at 4 and 12 weeks during UUI treatment for longitudinal analysis. The primary outcome was treatment response at 12 weeks. Treatment response was assessed (at 4 and 12 weeks) using the validated Patient Global Symptom Control (PGSC) questionnaire [20], which consists of a single question that addresses improvement following treatment. Scores of 4 or 5 were defined as “response”. PGSC scores ≤3 were considered “non-response”; these participants were offered a dosage increase to 10mg at 4 weeks. Women whose PGSC score ≥4 continued the solifenacin 5mg dose for 8 more weeks until primary outcome assessment at 12 weeks. Thus, definitions for 3 response groups were determined a priori: non-responders, 5mg responders and 10mg responders. Participants who were intolerant of the medication could withdraw at any point during the study. The research team assessed adverse events at normally scheduled visits, and at other intervals during participant-initiated contact. Figure 1 shows the flow of UUI-affected study participants. The primary outcome was symptomatic response, based on PGSC score, at 12 weeks.
Figure 1. Flow of Study Participants.
Sample Collection and Analysis
Urine was collected aseptically via transurethral catheter and a portion placed in a BD Vacutainer Plus C&S preservative tube for culture. Urine culture was performed as described [10] (E-Methods 1). A separate aliquot for sequencing was placed at 4°C for ≤4 h following collection; 10% AssayAssure (Sierra Molecular; Incline Village, NV) was added before storage at −80°C. Our protocols for DNA extraction, library construction, 16S rRNA sequencing and bioinformatics analysis have been described [11]. All genomic samples were processed in duplicate and analysis was performed using mothur software [21]. Relative abundance was calculated by generating the percent of total classified reads for each individual. All samples were processed in duplicate and the percent reads of replicates were averaged for downstream analysis, which included urotype identification and statistical analysis. Urotypes were determined as described [11]. Briefly, a culture urotype is determined by the dominant (>50%) identified organisms within a given sample. A sequencing urotype is determined by first clustering sequences using a dendrogram and grouping based on similarity; this usually correlates with dominance (>50%) of one organism. Those communities without a dominant organism were classified as “Diverse” urotype. Dendrograms were calculated using Bray Curtis dissimilarity between samples, and the complete method was used for hierarchical clustering via R software, version 2.15.1 [22]. To measure the diversity (richness and evenness of species within a sample), the alpha diversity (inverse Simpson’s index) was calculated using mothur software [21].
Protocol for the Expanded Quantitative Urine Culture (EQUC)
For standard urine culture, 0.001 mL of urine was spread quantitatively onto 5% sheep blood (BAP) and MacConkey agars (BD BBL™ Prepared Plated Media), then incubated aerobically (35°C for 24 hours). Any amount of each separate morphologic colony type was identified and counted using a detection level of 1,000 colony forming units (CFU)/mL (represented by 1 colony of growth on either plate). “No growth” was reported when no growth was observed, indicating no growth of bacteria at lowest dilution, i.e., 1:1000.
The expanded quantitative urine culture (EQUC) technique uses 0.1 mL of urine spread quantitatively onto BAP, Chocolate and Colistin, Naladixic Acid (CNA) agars (BD BBL™ Prepared Plated Media), then incubated in 5% CO2 (35°C for 48 hours). A second set of BAPs were inoculated with 0.1 mL of urine and incubated in room atmosphere at 35°C and 30°C for 48 hours, respectively. In addition, 0.1 mL of urine was inoculated onto each of two CDC Anaerobe 5% sheep blood agar (ABAP) plates (BD BBL™ Prepared Plated Media), and incubated in either a Campy gas mixture (5% O2, 10% CO2, 85% N) or in anaerobic conditions at 35°C for 48 hours. The detection level was 10 CFU/mL, represented by 1 colony of growth on any of the plates. Finally, to detect any bacterial species that may be present at quantities lower than 10 CFU/mL, 1.0 mL of urine was placed in Thioglycollate Medium (BD BBL™ Prepared Tubed Media) and incubated aerobically at 35°C for 5 days. If growth was visually detected, the Thioglycollate Medium was mixed and a few drops were plated on BAP and ABAP agars for isolation, and incubated aerobically and anaerobically (35°C for 48 hours). Each morphologically distinct colony type was isolated on a different plate of the same media to prepare a pure culture that was used for organism identification. Matrix-Assisted Laser Desorption Ionization Time of Flight Mass Spectrometry (MALDI-TOF MS) with the MALDI Biotyper 3.0 software (Bruker Daltonics, Billerica, MA) was used to identify the bacterial isolates [10]. To determine the false-negative rate, the following equation was used: the number of EQUC positive but standard negative samples divided by the total number of EQUC positive samples. To determine the culture diversity within a population, a species accumulation curve was generated. Species accumulation curves illustrate the number of unique species cultured and identified (using EQUC) with each new patient sampled. When the curve plateaus, it indicates that the community is fully sampled and few, if any, new species will be identified. Therefore, it also measures the overall diversity of the population by total number of unique species isolated.
Statistical Analyses
Standard statistical methods were used to compare participant demographics and symptom data between UUI patients and controls. Continuous variables are reported as means and standard deviations (SD) or medians and interquartile ranges (IQR) and categorical variables are reported as frequencies and percentages. Collection of the primary outcomes at 12 weeks was necessary for assignment to UUI response groups; therefore, participants who did not provide data through 12 weeks were not included in analyses involving response to solifenacin. Fisher’s exact and Kruskal-Wallis tests were used to compare demographic and culture (e.g., abundance and diversity) information among UUI response groups. For cultured organisms, abundance was measured using total CFU/ml; for sequencing, abundance was measured using percent classified reads or classified organisms. Post-hoc pairwise comparisons were made using Wilcoxon Rank sum tests for continuous variables with significant overall p-values. A kappa statistic was estimated to determine agreement between urotype classification from samples with both EQUC and sequencing. All statistical analyses were conducted using SPSS software version 19 or SAS software v9.4 (SAS Institute, Cary, NC). Significance was assessed at an alpha level of 0.05. Results were not adjusted for multiple-comparisons since the analyses are considered descriptive.
RESULTS
Population Description Over the Course of the Study
Figure 1 displays the flow of UUI subjects through the 12-week follow-up period. The study investigators withdrew participants who had received antibiotics for unrelated clinical indications (2) and subjects who underwent a cystoscopy for clinical indications (2). An additional 17 participants withdrew by the 4-week visit: 7 due to side effects and 6 lost to follow up. Of the participants who provided UUI symptom response data at 4 weeks, 56% (32/57) reported adequate symptom control; all of the remaining 25 accepted dose escalation (10mg daily).
Comparison of Baseline UUI to Controls
At baseline, participants included 74 UUI-affected women and 60 controls. The cohorts were similar with respect to race/ethnicity, diabetes, and smoking (Table 1). Participants with UUI were more likely to suffer from hypertension [35% versus 18%, p=0.02] and coronary artery disease [12% versus 2%, p=0.02]. The UUI population also was older [61.5 years (SD:11.5) versus 49 (SD:14.7), p<0.001], heavier [BMI 32.7 (SD:8.4) versus 28 (SD:5.5), p<0.001], and more likely to be estrogen-negative (post-menopausal and not on hormone replacement therapy) [88% versus 43%, p-value<0.001]. As expected, UUI symptoms were significantly worse in UUI-than non-UUI participants.
Table 1. Participant Demographics and Symptom Scores.
Comparison of baseline demographics between cohorts and response groups. Independent t-tests and Chi-square tests used unless otherwise indicated. Fisher’s Exact Test due to small, expected cell counts unless otherwise indicated.
| Baseline | Baseline: 3 Response Groups | ||||||
|---|---|---|---|---|---|---|---|
| UUI (N=74) |
Non-UUI Control (N=60) |
p-value | 5mg Responder (N=25) |
10mg Responder (N=15) |
Non- Responder (N=10) |
p-value | |
| Demographics | |||||||
| Age (years) [Mean (Standard Deviation)] |
61.5 (SD:11.5) |
49 (SD:14.7) |
<0.001a | 60 (SD:12.4) |
63 (SD:13.5) |
67 (SD:9) |
0.36b |
| Body Mass Index (kg/m2) [Mean (Standard Deviation)] |
32.7 (SD:8.4) |
28 (SD:5.5) |
<0.001a | 31 (SD:7.6) |
30 (SD:7) |
34 (SD:9) |
0.41b |
| Race/Ethnicity* | |||||||
| Non Hispanic Caucasian | 56 (77%) | 43 (72%) | 0.70 | 17 (68%) | 12 (80%) | 9 (90%) | 0.70 |
| Hispanic Caucasian | 5 (7%) | 4 (7%) | 3 (12%) | 2 (13%) | 0 (0%) | ||
| African-American | 13 (18%) | 12 (20%) | 5 (20%) | 1 (7%) | 1 (10%) | ||
| Asian | 0 (0%) | 1 (2%) | 0 (0%) | 0 (0%) | 0 (0%) | ||
| Marital Status | |||||||
| Married | 38 (51%) | 37 (62%) | 0.01 | 15 (60%) | 8 (53%) | 5 (50%) | 0.71 |
| Separated | 3 (4%) | 1 (2%) | 1 (4%) | 0 (0%) | 0 (0%) | ||
| Divorced | 9 (12%) | 6 (10%) | 1 (4%) | 3 (20%) | 3 (30%) | ||
| Widowed | 14 (19%) | 1 (2%) | 4 (16%) | 2 (13%) | 1 (10%) | ||
| Single | 10 (14%) | 15 (25%) | 4 (16%) | 2 (13%) | 1 (10%) | ||
| Estrogen Status** | |||||||
| Estrogen Positive | 7 (9%) | 32 (53%) | <0.001 | 4 (16%) | 2 (13%) | 0 (0%) | 0.68 |
| Estrogen Negative | 65 (88%) | 26 (43%) | 20 (80%) | 13 (87%) | 10 (100%) | ||
| Unsure | 2 (3%) | 2 (2%) | 1 (4%) | 0 (0%) | 0 (0%) | ||
| Smoking | 6 (8%) | 4 (7%) | 0.51 | 1 (4%) | 1 (7%) | 0 (0%) | 0.99 |
| Diabetes | 7 (9%) | 2 (3%) | 0.14 | 2 (8%) | 1 (7%) | 1 (10%) | 0.99 |
| Hypertension | 26 (35%) | 11 (18%) | 0.02 | 9 (36%) | 5 (33%) | 7 (70%) | 0.13 |
| Coronary Artery Disease | 9 (12%) | 1 (2%) | 0.02 | 2 (8%) | 2 (13%) | 1 (10%) | 0.84 |
| Prior Treatment for OAB | 37 (50%) | 0 (0%) | <0.001 | 13 (52%) | 11 (73%) | 6 (60%) | 0.45 |
| Vaginal Parity [Median (IQR)] | 2 (0–2.5) | 2 (1–3) | 0.02c | 2 (2–3) | 2 (0–3) | 2 (0–5) | 0.88c |
| Baseline Symptoms [Median (IQR)] | |||||||
| Symptom Score d | 70 (55–85) | 0 (0–5) | <0.001c | 62 (42–88) | 75 (65–85) | 69 (55–78) | 0.61c |
| HRQL d | 52 (33–75) | 100 (98–100) | <0.001c | 68 (50–76) | 59 (36–87) | 50 (31–70) | 0.43c |
| UDI e | 110 (61–-143) | 8 (3–17) | <0.001c | 93 (55–131) | 95 (52–120) | 98 (80–149) | 0.63c |
| POPDI e | 70 (30–105) | 14 (0–42) | <0.001c | 68 (42–129) | 40 (8–70) | 70 (8–101) | 0.11c |
| CRADI e | 66 (34–112) | 17 (2–56) | <0.001c | 68 (44–120) | 43 (11–81) | 75 (20–89) | 0.43c |
| 12 Week Symptoms [Median (IQR)] | |||||||
| Symptom S,core d | 18 (8–33) | 18 (5–28) | 54 (18–63) | 0.01c | |||
| HRQL d | 93 (86–99) | 94 (88–99) | 70 (61–86) | 0.008c | |||
| UDI e | 22 (14–59) | 46 (8–64) | 95 (58–113) | 0.01c | |||
| POPDI e | 32 (17–68) | 13 (4–19) | 54 (32–93) | 0.002c | |||
| CRADI e | 24 (7–89) | 18 (8–39) | 53 (32–68) | 0.08c | |||
Student’s T-Test
One-Way ANOVA
Wilcoxon rank sum test
Symptom Score and Health Related Quality of Life Score (HRQL), Based on OAB questionnaire
Urinary Distress Inventory (UDI), Pelvic Organ Prolapse Distress Inventory (POPDI), Colorectal-Anal Distress Inventory (CRADI), based on Pelvic Floor Disease Inventory
Self reported by participant
Estrogen status is defined as negative if the patient is post-menopausal and not on hormone replacement therapy. Estrogen positive is anyone pre-menopausal and/or on hormone replacement therapy.
We detected the presence of bacterial DNA in a similar proportion of urine samples for each cohort (Controls: 43%, N=26/60, UUI: 50%, N=37/74, p=0.44 Table 2A). Table 2A and E-Table 2 display the assigned sequence urotypes. In both groups, the majority of samples were dominated by Lactobacillus [Controls (61.5%, N=16/26), UUI (40.5%, N=15/37), p=0.13]. Alpha diversity (measured by the inverse Simpson index) of classified sequences between UUI and control was similar (p=0.76).
Table 2.
Urotype Proportions
| 2A: Urotypes proportions of the total sequenced and cultured samples by dominant organisms. | ||||
|---|---|---|---|---|
| UUI: Baseline Samples | ||||
| Sequencing (N=74) | Culture (N=59) | |||
| Undetermined* | 50% (37/74) | Of the 74 samples collected, 59 were cultured with EQUC |
Undetermined* | 15.3% (9/59) |
| Total Sequenced | 50% (37/74) | Total Cultured | 84.7% (50/59) | |
|
Identified Sequence Urotypes |
Identified Culture Urotypes |
|||
| Lactobacillus | 40.5% (15/37) | Lactobacillus | 22% (11/50) | |
| Diverse | 21.6% (8/37) | Diverse | 32% (16/50) | |
| Gardnerella | 21.6% (8/37) | Gardnerella | 8% (4/50) | |
|
Enterobacteriaceae and Sneathia both Represent 5.4% (2/37) |
Streptococcus | 18% (9/50) | ||
| Enterobacteriaceae | 8% (4/50) | |||
|
Staphylococcus and Enterococcus both representd 2.7% (1/37) |
Staphylococcus, Actinobaculum Alloscardovia, Bifidobacterium, Candida Enterobacteriaceae/Bacillus each represent 2% (1/50) |
|||
| UUI: 12 week Samples | ||||
|---|---|---|---|---|
| Sequencing (N=50) | Culture (N=44) | |||
| Undetermined* | 52.1% (25/48**) | Of the 50 samples collected, 44 were cultured with EQUC |
Undetermined* | 13.6% (6/44) |
| Total Sequenced | 47.9% (23/48**) | Total Cultured | 86.4% (38/44) | |
|
Identified Sequence Urotypes |
Identified Culture Urotypes |
|||
| Lactobacillus | 47.8% (11/23) | Lactobacillus | 31.6% (12/38) | |
| Gardnerella | 26.1% (6/23) | Diverse | 18.4% (7/38) | |
| Diverse | 13% (3/23) | Streptococcus | 13.2% (5/38) | |
| Enterobacteriaceae | 8.7% (2/23) | Gardnerella | 7.9% (3/38) | |
| Aerococcus | 4.3% (1/23) | Enterobacteriaceae | 13.2% (5/38) | |
|
Aerocuccus, Bifidobacterium Corynebacterium, Lactobacillus/Gardnerella each represent 2.6% (1/38) | ||||
|
Streptocuccus/Actinomyces represent 5.3% (2/38) | ||||
| Control | ||||
|---|---|---|---|---|
| Sequencing (N=60) | Culture (N=52) | |||
| Undetermined* | 56.7% (34/60) | Of the 60 samples collected, 52 were cultured with EQUC |
Undetermined* | 36.5% (19/52) |
| Total Sequenced | 43.3% (26/60) | Total Cultured | 63.5% (33/52) | |
|
Identified Sequence Urotypes |
Identified Culture Urotypes |
|||
| Lactobacillus | 61.5% (16/26) | Lactobacillus | 45.5% (15/33) | |
| Gardnerella | 15.4% (4/26) | Diverse, Gardnerella, Staphylococcus, Streptococcus, Enterococcus, Streptococcus/Bifidobacterium, and Enterobacteriaceae each represent 6% (2/33) |
||
| Diverse | 15.4% (4/26) |
|||
| Enterobacteriaceae and Atopobium both represent 3.8% (1/26) | ||||
|
Alloscardovia, Candida, Micrococcus, and Unknown organisms each represent 3% (1/33) |
||||
Undetermined urotype means the bacterial load in the sample was below the detectable threshold by either sampling method.
50 patients returned for the 12-week visit, however, only 48 were sequenced due to unclear specimen labeling. These two samples were processed by
A large subset of baseline samples was processed by EQUC (UUI N=59/74, control N=52/60). A greater proportion of UUI-affected women had cultivatable bacteria in their urine compared to control women (84.7% versus 63.5%, p=0.01). The groups differed in proportion of cultured samples characterized by dominant organisms (culture urotypes) (Table 2A): Lactobacillus [Controls (45.5%, N=15/33) versus UUI (22%, N=11/50) p=0.03], and diverse [Controls (6%, N=2/33) versus UUI (32%, 16/50) p=0.006 Table 2A]. Relative to controls, UUI-affected women had significantly more diversity in unique cultivatable organisms, as assessed by the number of unique cultivatable organisms per cohort (UUI= 80, Controls= 36, Figure 2), significantly more cultured bacterial isolates per participant, as measured by the median [UUI (3) versus Controls (1), p<0.001, Figure 2 inset] and significantly more cultivatable bacteria, as measured by median number of CFU per mL per urine specimen [UUI: 340 CFU (IQR: 50–1710) versus Controls: 20 CFU (IQR: 0–305), p=0.002].
Figure 2. Diversity of cultivatable bacteria is distinct between cohorts and response groups at baseline.
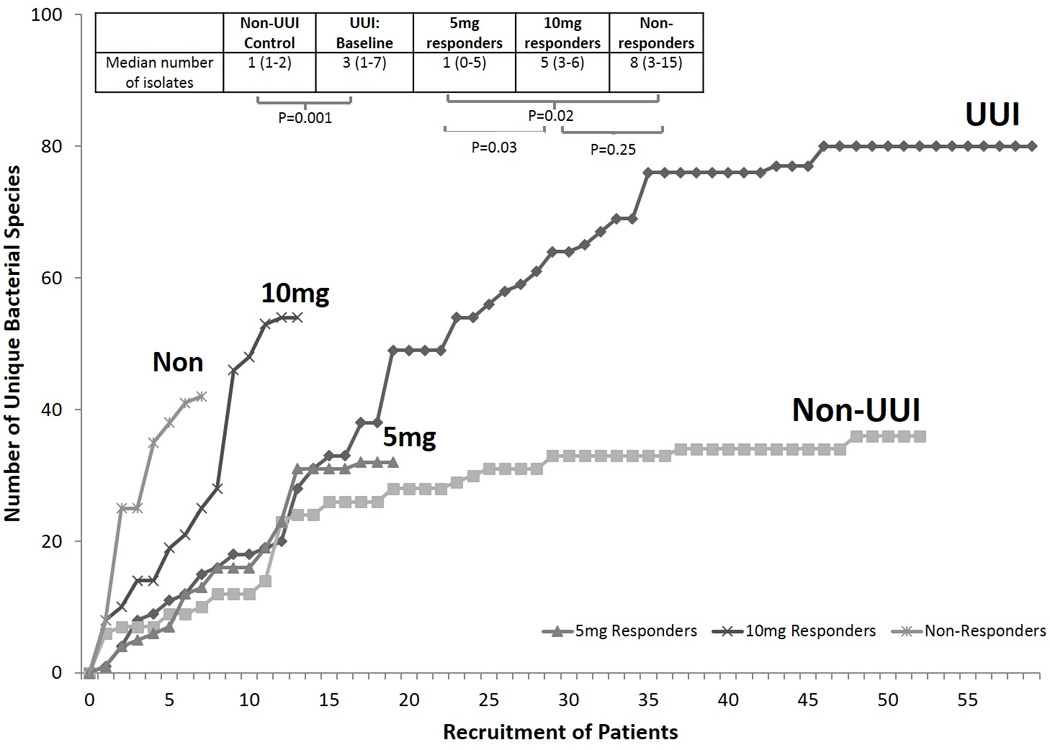
Species accumulation analysis illustrates the number of unique species cultured and identified (using EQUC) with each new patient sampled. When the curve plateaus, it indicates that the community is fully sampled and few, if any, new species will be identified. Therefore, it also measures the overall diversity of the population by total number of unique species isolated. The UUI group isolated 80 unique species at baseline and the control cohort isolated 36 unique species. Therefore, the species isolated from UUI is far more diverse that the species isolated from controls. There is statistical difference in the median number of isolates collected from each individual in each cohort [M=3 (IQR: 1–7) versus M=1 (IQR: 1–2), p<0.001].
The UUI curve represents samples at baseline from individuals who will respond or not. When we divide this curve into each stratified by response group we see that the baseline diversity of each groups is distinct, suggesting that baseline diversity could be predictive of treatment response. 5mg responders (grey triangles) had low diversity, with a total of 32 unique species isolated. 10mg responders (dark “x”) had high diversity with a total of 54 unique isolates. Non-responders (light “x”) had high diversity with a total of 42 unique isolates. The median number of unique species was not significant between 10mg and non-responders [5 (IQR: 3–6) versus 8 (IQR: 3–15), p-value= 0.25], but was significant between the 5mg and 10mg and between 5mg and non-responders [1 (IQR: 0–5) versus 5 (IQR: 3–6), p-value= 0.03; and 1 (IQR: 0–5) versus 8 (IQR: 3–15), p-value= 0.02].
Characteristics in the Baseline Samples Correlate with Primary Outcome
Primary outcome data were available for 50 participants at 12 weeks, with 25 “5mg responders”, 15 “10mg responders” and 10 “non-responders”, for an overall response rate of 80%. At baseline, compared to the withdrawn population, participants with primary outcome data weighed less [BMI 31.2 (SD:7.7) versus 35.8 (SD:9.2), p=0.03] and were more likely to have had previous pharmacologic treatment for OAB (60% versus 29%, p=0.01). They also had greater HRQL scores [61 versus 37, p=0.001] and larger urinary distress inventory scores [95 versus 131, p=0.02] (E-Table 1). We did not detect other significant group differences in baseline variables for participants who competed the study. (E-Table 1).
At baseline, the 3 response groups had similar demographics and symptom severity (Table 1). At 12 weeks, the HRQL scores differed among all response groups (p=0.008). The median score for non-responders (70, IQR: 61–86) differed significantly from both responder groups: 5mg group (93, IQR: 86–99) and 10mg group (94, IQR: 88–99) (p=0.004 and p=0.008, respectively) (Table 1).
The urine samples from all 50 participants with primary outcome data were tested for detectable bacteria. At baseline, a similar proportion of each response group had detectable bacterial DNA [5mg: 56% N=14/25, 10mg: 46.7% N=7/15, non-responders: 40% N=4/10, p=0.66, Table 2B], suggesting that there is no difference in the frequency of samples with detectable bacteria present in each response group. In contrast, when we compared bacterial community composition by distribution of urotypes (i.e., the number of individuals with microbiomes dominated by one organism), the baseline samples from each response group tended to be different; however, no statistical testing was conducted due to limited sample sizes. Compared to 10mg responders (12.5%, N=1/8), 5mg responders had a larger proportion of individuals with Lactobacillus-dominant urine (50%, N=7/14) (Table 2B). The response groups had similar alpha diversities [5mg: 1.6 (IQR: 1.2–3.7), 10mg: 1.9 (IQR: 1.1–6.3), non-responders: 2.8 (IQR: 1.7–4.1), p=0.55].
| 2B. Urotypes in UUI Response Groups | |||||||||
|---|---|---|---|---|---|---|---|---|---|
| UUI Baseline - 5mg Responders | UUI 12 week- 5mg Responders | ||||||||
| Sequencing (N=25) | Culture (N=19) | Sequencing (N=23**) | Culture (N=21) | ||||||
| Undetermined* | 44% (11/25) | Of the samples collected, 19 were cultured with EQUC |
Undetermined* | 26.3% (5/19) | Undetermined* | 56.5% (13/23) | Of the samples collected, 21 were cultured with EQUC |
Undetermined* | 14.3% (3/21) |
| Total Sequenced | 56% (14/25) | Total Cultured | 73.7% (14/19) | Total Sequenced | 43.5% (10/23) | Total Cultured | 85.7% (18/21) | ||
|
Identified Sequence Urotypes |
Identified Culture Urotypes |
Identified Sequence Urotypes |
Identified Culture Urotypes |
||||||
| Lactobacillus | 50% (7/14) | Lactobacillus | 35.7% (5/14) | Lactobacillus | 70% (7/10) | Lactobacillus | 38.9% (7/18) | ||
| Gardnerella | 21.4% (3/14) | Gardnerella | 14.3% (2/14) | Gardnerella | 20% (2/10) | Diverse | 16.7% (3/18) | ||
| Diverse | 14.3% (2/14) |
Actinobaculum, Candida, Enterobacteriaceae, Enterobacteriaceae/Bacillus Staphylococcus, Streptococcus, and Diverse each represent 7.1% (1/14) |
Diverse | 10% (1/10) | Gardnerella | 11.1% (2/18) | |||
| Enterobacteriaceae and Staphylococcus both represent 7.1% (1/14) |
Enterobacteriaceae | 11.1% (2/18) | |||||||
|
Bifidobacterium, Lactobacillus / Gardnerella, Streptococcus, and Streptococcus/Actinomyces each represent 5.6% (1/18) | |||||||||
| UUI Baseline - 10mg Responders | UUI 12 week 10mg Responders | ||||||||
| Sequencing (N=15) | Culture (N=13) | Sequencing (N=15) | Culture (N=14) | ||||||
| Undetermined* | 53.3% (8/15) | Of the samples collected, 13 were cultured with EQUC |
Undetermined* | 0% (0/13) | Undetermined* | 53.3% (8/15) | Of the samples collected, 14 were cultured with EQUC |
Undetermined* | 7.1% (1/14) |
| Total Sequenced | 46.7% (7/15) | Total Cultured | 100% (13/13) | Total sequenced | 46.7% (7/15) | Total Cultured | 92/8% (13/14) | ||
|
Identified Sequence Urotypes |
Identified Culture Urotypes |
Identified Sequence Urotypes |
Identified Culture Urotypes |
||||||
| Gardnerella | 42.8% (3/7) | Divserse | 38.5% (5/13) | Lactobacillus | 28.6% (2/7) | Divserse | 23.1% (3/13) | ||
| Diverse | 28.6% (2/7) | Streptococcus | 30.8% (4/13) | Gardnerella | 28.6% (2/7) | Streptococcus | 23.1% (3/13) | ||
|
Enterobacteriaceae and Lactobacillus both represent 12.5% (1/8) |
Gardnerella | 15.4% (2/13) | Enterobacteriaceae | 28.6% (2/7) | Enterobacteriaceae | 15.4% (2/13) | |||
| Enterobacteriaceae and Lactobacillus both represent 7.8% (1/13) |
Diverse | 14.3% (1/7) | Lactobacillus | 15.4% (2/13) | |||||
|
Corynebacterium, Gardnerella, and Streptococcus/Actinomyces each represent 7.8% (1/13) | |||||||||
| UUI Baseline – Non-responders | UUI 12 week – Non-responders | ||||||||
| Sequencing (N=10) | Culture (N=7) | Sequencing (N=10) | Culture (N=9) | ||||||
| Undetermined* | 60% (6/10) | Of the samples collected, 7 were cultured with EQUC |
Undetermined* | 14.3% (1/7) | Undetermined* | 40% (4/10) | Of the samples collected, 9 were cultured with EQUC |
Undetermined* | 22.2% (2/9) |
| Total Sequenced | 40% (4/10) | Total Cultured | 85.7% (6/7) | Total sequenced | 60% (6/10) | Total Cultured | 77.8% (7/9) | ||
|
Identified Sequence Urotypes |
Identified Culture Urotypes |
Identified Sequence Urotypes |
Identified Culture Urotypes |
||||||
| Lactobacillus | 75% (3/4) | Diverse | 50% (3/6) | Lactobacillus | 33.3% (2/6) | Lactobacillus | 42.8% (3/7) | ||
| Diverse | 25% (1/4) | Lactobacillus | 33.3% (2/6) | Gardnerella | 33.3% (2/6) |
Aerococcus, Enterobacteriaceae, Streptococcus, and Diverse each |
|||
| Enterobacteriaceae | 16.7% (1/6) |
Aerococcus and Diverse both represent 16.7% (1/6) |
|||||||
Undetermined urotype means the bacterial load in the sample was below the detectable threshold by either sampling method.
The subset (N=39/50) of baseline urine samples from participants with primary outcome data that were cultured with EQUC included 19 “5mg responders”, 13 “10mg responders”, and 7 “non-responders”. Cultivatable organisms (EQUC) were detected in most participants: 5mg responders: 73.7% (N=14/19), 10mg responders: 100% (N=13/13) and non-responders: 85.7% (N=6/7) (p=0.13, Table 2B). The dominant urotype by response group was: 5mg response -Lactobacillus-dominant urotype 35.7% (N=5/14); 10mg - diverse urotype 38.5% (N=5/13) and 30.8% (N=4/13) Streptococcus-dominant urotype; and non-responders – diverse urotype 50% (N=3/6). Each response group had a distinct species accumulation curve, with different total number of unique cultured bacterial isolates: 5mg (32), 10mg (54) and non-responders (42) (Figure 2). Overall, there was a difference in the number of unique species isolated by response group (p=0.02). The median number of unique species isolated from each individual within each cohort was similar in the 10mg and non-responder groups [5 versus 8, p= 0.25 Figure 2 inset]. However, there was a statistically significant difference between the 5mg and the other responder groups: [5mg: 1 versus 10mg responders: 5 p= 0.03, or non-responders: 8, p= 0.02 Figure 2 inset].
Each response group contained several genera that differed from other response groups (Figure 3A), with Actinomyces cultivated more commonly from 10mg responders and non-responders than from 5mg responders (p=0.01 and 0.04, respectively). Streptococcus was cultivated more frequently from the 10mg responders (p<0.001), while Corynebacterium was cultivated more commonly from non-responders (p=0.002). In addition, several bacterial species differed between response groups (Figure 3B).
Figure 3. Frequency of Detection of Genera and Significant Species Between Response Groups.
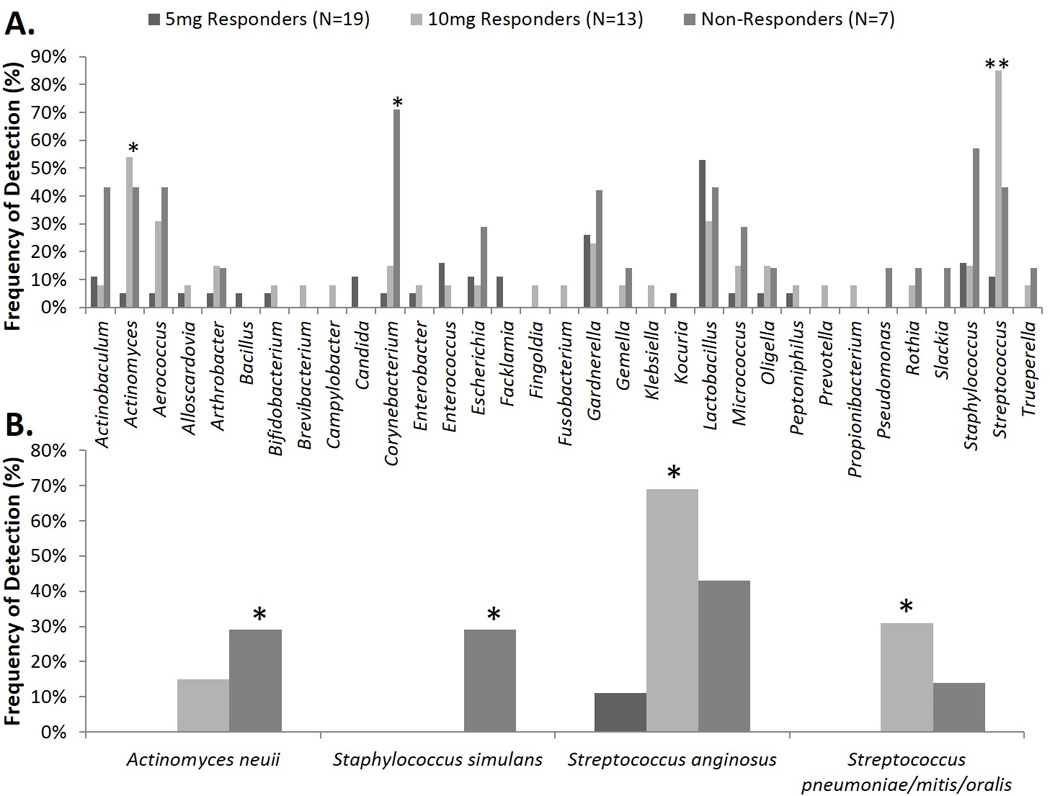
Comparison of the frequency of culture-based detection at the genus (A) and species level (B) for baseline urines by response group. Fisher’s Exact Test was used to calculate the p-values. * p=0.05 ** p=0.00
Primary Outcome Comparison – 12 weeks
At 12 weeks, 48 of the 50 participants with primary outcome data were sequenced. Two samples were not sequenced due to inconclusive labeling. Of the remaining 48, 23 samples were positive for bacterial DNA (Table 2B). Similar to baseline, the response groups had similar proportions of 12-week samples with detectable bacterial DNA [5mg: 43.5% N=10/23, 10mg: 46.7% N=7/15, and non-responders: 60% N=6/10, p=0.70]. Statistical testing was not performed because of limited sample size; however, the 3 response groups trended toward different sequence urotype distributions, with larger proportions of Lactobacillus urotypes in 5mg responders (70%, N=7/10), compared to 10mg responders (28.6%, N=2/7) and non-responders (33.3%, N=2/6) (Table 2B). The response groups had similar alpha diversity (p=0.18).
At 12 weeks, most (86%, N=38/44) EQUC-characterized urines demonstrated cultivatable organisms (Table 2B). At 12 weeks, each response group tended toward different culture urotypes distributions: 5mg response - Lactobacillus-dominant urotype 38.9% N=7/18; 10mg -diverse urotype 23.1% N=3/13 and 23.1% N=3/13 Streptococcus-dominant urotype; and non-responders – Lactobacillus 42.8% N=3/7 (Table 2B). The species accumulation analysis of the baseline and 12-week samples show that the 10mg and non-responders decreased in diversity by 12 weeks, from 55 unique isolates to 23 for the 10mg group and from 40 to 29 for the non-responders. In contrast, the 5mg group increased in diversity, from 32 unique isolates to 41 (E-Figure 1). We did not detect a specific single genus that significantly declined in responders (5mg or 10mg) (E-Figure 2). At the conclusion of the specimen collection, we compared the two methods of bacterial assessment. Approximately half (49.8%, N=119/239) of all urine specimens sequenced had detectable bacterial DNA, whereas most specimens (80%, N=140/177) cultured with EQUC grew organisms. Among the sequence-positive, culture-positive individuals, the urotype classifications were moderately comparable (Kappa = 0.45) [23].
When comparing EQUC to standard culture, we found EQUC detected more organisms overall. Of all the urine samples in the study, 81.3% (N=165/203) grew bacteria by EQUC. Of those, 149 had been deemed culture negative (“No Growth”) by the standard culture, resulting in 90.3% false negative rate for standard culture.
DISCUSSION
The female urinary microbiota in women affected by UUI appears to differ from a comparison group of unaffected women. Using two complementary techniques, we report differences in composition (urotype), diversity (number of unique bacterial species) and identity of certain bacteria at the genus and species levels. These differences, which were detectable prior to UUI treatment, appear related to treatment response. Moreover, following UUI treatment, certain microbiota characteristics appear associated with a clinically significant response to treatment. Overall, less diversity appears associated with fewer UUI symptoms and with treatment response at 5mg. We also found that bacterial diversity in women who required a higher dose to achieve adequate symptom control is more similar to the diversity found in non-responders, indicating that the diversity of cultivatable organisms might be used to predict treatment response.
The mechanistic relationship between bacterial diversity and UUI symptoms is unknown. However, given our findings, important clinical questions regarding UUI etiology or consequences will need careful study. In this research work, we selected 2 complementary study techniques to assess the bacterial milieu, one of which was developed after we started enrollment. Sequencing, which was available at the onset of our study, provided a broad picture of bladder bacteria, allowing a more complete analysis of bacterial diversity. In addition, sequencing could detect bacteria that even EQUC could not cultivate. However, urine samples contain low biomass relative to other anatomical sites (e.g., gut or vagina). Thus, a proportion of the study population did not contribute sequencing data. This lack of information was often resolved by the use of EQUC. This expanded culture technique for urine became available after our study started. EQUC not only confirms that bladder organisms are alive, but it also allows phenotyping of low biomass individuals not measurable by sequencing.
The very low CFUs associated with UUI may prompt consideration of a lower CFU cut-off (perhaps >102) for a standard urine culture. Others have suggested lowering the culture threshold for UTI [15,24–27] and even for UUI [28]; however, these studies focused on growing known uropathogens. Here, we showed that the bladder can contain a variety of organisms. Some are likely non-pathogenic normal flora. Others might have an impact on UUI and other lower urinary tract symptoms. Some of these might be protective, whereas others may contribute to symptoms. Indeed, we recently reported that detection of urinary microbiota by quantitative PCR is associated with a reduced risk of post-instrumentation UTI [9] and an association between Lactobacillus crispatus and the lack of lower urinary tract symptoms [11]. Furthermore, several bacterial species appear to be associated with UUI [11]. Thus, we recommend the use of expanded culture conditions until our understanding of unrecognized uropathogens improves. EQUC is more likely than sequencing to be readily available in the clinical setting, and may prove useful for rapid phenotyping of individual patients, prior to treatment selection. This is especially important as no single clinical demographic variable adequately predicted treatment outcome.
We have considered the implications of the minority of samples that were “negative” for both techniques. We currently consider this group to be “sub-threshold” rather than “sterile” and fully anticipate that the very low biomass individuals will be more fully described as technologies evolve.
The dominance of certain genera, such as Lactobacillus and Gardnerella, may prompt thoughts of vaginal contamination. Our use of aseptically collected specimens via transurethral catheter by experienced individuals, and our prior publications demonstrating the presence of Lactobacillus and Gardnerella in female bladder urine collected through suprapubic aspirates [12], supports the evidence that both genera are capable of residing in the bladder. The role of these organisms as members of the urinary microbiome and their relationships to vaginal microbiota requires further study. Because the bladder and vagina can contain the same species, the use of catheterized samples is recommended whenever possible and careful interpretation is required when using samples obtained by void.
It is possible that baseline group differences contributed to our findings. However, since UUI incidence increases with age and is therefore linked to menopause status, our sample size is not sufficient to further describe the separate effects of estrogen status, age, and UUI symptoms in relation with microbiota diversity. We acknowledge this possibility; yet, we wish to highlight the importance of the findings between treatment response groups (Figure 2). Women with 1–4 bacterial isolates on EQUC were most likely to respond to the initial 5mg dose of solifenacin, whereas women with more diversity (≥5 bacterial isolates) were less likely to respond or needed an increased dose. These simple cut-offs, detectable prior to treatment, will require validation in larger patient populations. Therefore, in future studies, the use of both EQUC and sequencing for all collected urine specimens is recommended. The results are highly complementary, with sequencing measuring a broad picture of the population and the EQUC protocol measuring the cultivatable organisms within that population.
Clinicians can benefit from expanded knowledge about the bacterial communities that are present in patients with UUI. Although specific changes in clinical management cannot yet be recommended, this promising area of research is generating many new hypotheses. In addition, our findings should inform the design of larger clinical studies that have potential to personalize UUI treatment, provide insight into UUI etiology, and offer promise for novel UUI prevention strategies. We believe that related urinary tract disorders may also benefit from this new knowledge.
CONCLUSIONS
The response to oral UUI medication (solifenacin) may relate to individual urinary microbiota characteristics that are detectable prior to treatment. Our findings, especially the importance of organism diversity, offer promising possibilities for new ideas for prevention and treatment of UUI in women.
Supplementary Material
Acknowledgments
We kindly thank Mary Tulke RN and Bozena Zemaitaitis for their assistance with participant recruitment and sample collection and Kathleen McKinley MT (ASCP) for her clinical microbiology contributions. We would like to acknowledge and thank the Loyola University Chicago Health Sciences Division’s Office of Informatics and Systems Development for their expertise and for the computational resources utilized in support of this research.
FUNDING/SUPPORT
This study was supported by a grant from the Falk Foundation (LU#202567), by NIH grant R21DK097435-01A1, and by Astellas Scientific and Medical Affairs (ASMA) (Wolfe PI) and is registered at www.clinicaltrials.gov as NCT01642277. Loyola University Chicago Stritch School of Medicine’s research computing facility was developed through grant funds awarded by the Department of Health and Human Services as award number 1G20RR030939-01. The following reagent was obtained through BEI Resources, NIAID, NIH as part of the Human Microbiome Project: Genomic DNA from Microbial Mock Community A (Even, Low Concentration), HM-782D. Our funding sources had no role in design and conduct of the study; collection, management, analysis, and interpretation of the data; preparation, review, or approval of the manuscript. ASMA was given a courtesy review.
Footnotes
Conflict of Interest: All Authors have completed and submitted ICMJE Form for Disclosure of Potential Conflicts of Interest.
All authors report that this study was funded in part by a grant from Astellas Scientific and Medical Affairs (ASMA).
Alan J. WOLFE, Ph.D. – Scientific Study/Trial: Investigator Initiated Grant from ASMA for certain aspects of this study.
Linda BRUBAKER, MD – Scientific Study/Trial: Grants from NICHD and NIDDK during conduct of a different study. Health Publishing: Personal fees from Up-To-Date.
Elizabeth R. MUELLER, M.D. reports grants from ASMA, during the conduct of the study; grants and personal fees from ASMA, personal fees from Peri-Coach, and personal fees from Allergan, outside the submitted work.
Reprints will not be available.
Author Contribution: Drs. Brubaker and Wolfe had full access to all of the data in the study and take responsibility for the integrity of the data and the accuracy of the data analysis.
KJ Thomas-White: Data Collection, Data Analysis, Manuscript Writing EE Hilt: Data Collection, Data Analysis, Manuscript Writing C Fok: Data Collection, Project Development, Manuscript Editing MM Pearce: Data Collection, Data Analysis, Manuscript Writing
ER Mueller: Data Collection, Manuscript Editing
S Kliethermes: Statistical Analysis, Manuscript Writing
K Jacobs: Data Collection, Manuscript Editing
MJ Zilliox: Data Collection, Manuscript Editing
C Brincat: Data Collection, Manuscript Editing
TK Price: Data Collection, Data Analysis Manuscript Editing
G Kuffel: Data Collection, Manuscript Editing
P Schreckenberger: Project Development, Manuscript Editing
X Gai: Project Development, Manuscript Editing
L Brubaker: Project Development, Data Collection, Manuscript Writing
AJ Wolfe: Project Development, Manuscript Writing
REFERENCES
- 1.Hartmann KE, McPheeters ML, Biller DH, Ward RM, McKoy JN, Jerome RN, Micucci SR, Meints L, Fisher JA, Scott TA, Slaughter JC, Blume JD. Treatment of overactive bladder in women. Evidence Report/Technology Assessment. 2009;(187):1–120. [PMC free article] [PubMed] [Google Scholar]
- 2.Hoffstetter S, Leong FC. Solifenacin succinate for the treatment of overactive bladder. Expert Opinion on Drug Metabolism & Toxicology. 2009;5(3):345–350. doi: 10.1517/17425250902762866. [DOI] [PubMed] [Google Scholar]
- 3.Haab F, Cardozo L, Chapple C, Ridder AM Solifenacin Study Group. Long-term open-label solifenacin treatment associated with persistence with therapy in patients with overactive bladder syndrome. European Urology. 2005;47(3):376–384. doi: 10.1016/j.eururo.2004.11.004. [DOI] [PubMed] [Google Scholar]
- 4.Pelman RS, Capo JP, Jr, Forero-Schwanhaeuser S. Solifenacin at 3 years: a review of efficacy and safety. Postgraduate Medicine. 2008;120(2):85–91. doi: 10.3810/pgm.2008.07.1795. [DOI] [PubMed] [Google Scholar]
- 5.Santos JC, Telo ER. Solifenacin: scientific evidence in the treatment of overactive bladder. Archivos Espanoles de Urologia. 2010;63(3):197–213. [PubMed] [Google Scholar]
- 6.Whiteside SA, Razvi H, Dave S, Reid G, Burton JP. The microbiome of the urinary tract - a role beyond infection. Nature Reviews Urology. 2015;12(2):81–90. doi: 10.1038/nrurol.2014.361. [DOI] [PubMed] [Google Scholar]
- 7.Brubaker L, Wolfe AJ. The new world of the urinary microbiota in women. American Journal of Obstetrics and Gynecology. 2015 doi: 10.1016/j.ajog.2015.05.032. (Epub ahead of print] [DOI] [PMC free article] [PubMed] [Google Scholar]
- 8.Wolfe AJ, Brubaker L. “Sterile Urine” and the Presence of Bacteria. European Urology. 2015;68(2):173–174. doi: 10.1016/j.eururo.2015.02.041. [DOI] [PMC free article] [PubMed] [Google Scholar]
- 9.Brubaker L, Nager CW, Richter HE, Visco A, Nygaard I, Barber MD, Schaffer J, Meikle S, Wallace D, Shibata N, Wolfe AJ. Urinary bacteria in adult women with urgency urinary incontinence. International Urogynecology Journal. 2014;25(9):1179–1184. doi: 10.1007/s00192-013-2325-2. [DOI] [PMC free article] [PubMed] [Google Scholar]
- 10.Hilt EE, McKinley K, Pearce MM, Rosenfeld AB, Zilliox MJ, Mueller ER, Brubaker L, Gai X, Wolfe AJ, Schreckenberger PC. Urine is not sterile: use of enhanced urine culture techniques to detect resident bacterial flora in the adult female bladder. Journal of Clinical Microbiology. 2014;52(3):871–876. doi: 10.1128/JCM.02876-13. [DOI] [PMC free article] [PubMed] [Google Scholar]
- 11.Pearce MM, Hilt EE, Rosenfeld AB, Zilliox MJ, Thomas-White K, Fok C, Kliethermes S, Schreckenberger P, Brubaker L, Gai X, Wolfe AJ. The Female Urinary Microbiome: A Comparison of Women With and Without Urgency Urinary Incontinence. mBio. 2014;5(4):e01283–e01214. doi: 10.1128/mBio.01283-14. [DOI] [PMC free article] [PubMed] [Google Scholar]
- 12.Wolfe AJ, Toh E, Shibata N, Rong R, Kenton K, Fitzgerald M, Mueller ER, Schreckenberger P, Dong Q, Nelson DE, Brubaker L. Evidence of uncultivated bacteria in the adult female bladder. Journal of Clinical Microbiology. 2012;50(4):1376–1383. doi: 10.1128/JCM.05852-11. [DOI] [PMC free article] [PubMed] [Google Scholar]
- 13.Fouts DE, Pieper R, Szpakowski S, Pohl H, Knoblach S, Suh MJ, Huang ST, Ljungberg I, Sprague BM, Lucas SK, Torralba M, Nelson KE, Groah SL. Integrated next-generation sequencing of 16S rDNA and metaproteomics differentiate the healthy urine microbiome from asymptomatic bacteriuria in neuropathic bladder associated with spinal cord injury. Journal of Translational Medicine. 2012;10:174. doi: 10.1186/1479-5876-10-174. [DOI] [PMC free article] [PubMed] [Google Scholar]
- 14.Siddiqui H, Nederbragt AJ, Lagesen K, Jeansson SL, Jakobsen KS. Assessing diversity of the female urine microbiota by high throughput sequencing of 16S rDNA amplicons. BMC Microbiology. 2011;11:244. doi: 10.1186/1471-2180-11-244. [DOI] [PMC free article] [PubMed] [Google Scholar]
- 15.Khasriya R, Sathiananthamoorthy S, Ismail S, Kelsey M, Wilson M, Rohn JL, Malone-Lee J. Spectrum of bacterial colonization associated with urothelial cells from patients with chronic lower urinary tract symptoms. Journal of Clinical Microbiology. 2013;51(7):2054–2062. doi: 10.1128/JCM.03314-12. [DOI] [PMC free article] [PubMed] [Google Scholar]
- 16.Lewis DA, Brown R, Williams J, White P, Jacobson SK, Marchesi JR, Drake MJ. The human urinary microbiome; bacterial DNA in voided urine of asymptomatic adults. Frontiers in Cellular and Infection Microbiology. 2013;3:41. doi: 10.3389/fcimb.2013.00041. [DOI] [PMC free article] [PubMed] [Google Scholar]
- 17.Barber MD, Walters MD, Cundiff GW. Responsiveness of the Pelvic Floor Distress Inventory (PFDI) and Pelvic Floor Impact Questionnaire (PFIQ) in women undergoing vaginal surgery and pessary treatment for pelvic organ prolapse. American Journal of Obstetrics and Gynecology. 2006;194(5):1492–1498. doi: 10.1016/j.ajog.2006.01.076. [DOI] [PubMed] [Google Scholar]
- 18.Uebersax JS, Wyman JF, Shumaker SA, McClish DK, Fantl JA. Short forms to assess life quality and symptom distress for urinary incontinence in women: the Incontinence Impact Questionnaire and the Urogenital Distress Inventory. Continence Program for Women Research Group. Neurourology and Urodynamics. 1995;14(2):131–139. doi: 10.1002/nau.1930140206. [DOI] [PubMed] [Google Scholar]
- 19.Coyne K, Revicki D, Hunt T, Corey R, Stewart W, Bentkover J, Kurth H, Abrams P. Psychometric validation of an overactive bladder symptom and health-related quality of life questionnaire: the OAB-q. Quality of Life Research : an International Journal of Quality of Life Aspects of Treatment, Care and Rehabilitation. 2002;11(6):563–574. doi: 10.1023/a:1016370925601. [DOI] [PubMed] [Google Scholar]
- 20.Brubaker L, Richter HE, Visco A, Mahajan S, Nygaard I, Braun TM, Barber MD, Menefee S, Schaffer J, Weber AM, Wei J Pelvic Floor Disorders N. Refractory idiopathic urge urinary incontinence and botulinum A injection. Journal of Urology. 2008;180(1):217–222. doi: 10.1016/j.juro.2008.03.028. [DOI] [PMC free article] [PubMed] [Google Scholar]
- 21.Schloss PD, Westcott SL, Ryabin T, Hall JR, Hartmann M, Hollister EB, Lesniewski RA, Oakley BB, Parks DH, Robinson CJ, Sahl JW, Stres B, Thallinger GG, Van Horn DJ, Weber CF. Introducing mothur: open-source, platform-independent, community-supported software for describing and comparing microbial communities. Applied and Environmental Microbiology. 2009;75(23):7537–7541. doi: 10.1128/AEM.01541-09. [DOI] [PMC free article] [PubMed] [Google Scholar]
- 22.Team RDC. R: a language and environment for statistical computing. R Foundation for Statistical Computing. 2014 [Google Scholar]
- 23.Landis JR, Koch GG. The measurement of observer agreement for categorical data. Biometrics. 1977;33(1):159–174. [PubMed] [Google Scholar]
- 24.Hooton TM, Roberts PL, Cox ME, Stapleton AE. Voided midstream urine culture and acute cystitis in premenopausal women. The New England Journal of Medicine. 2013;369(20):1883–1891. doi: 10.1056/NEJMoa1302186. [DOI] [PMC free article] [PubMed] [Google Scholar]
- 25.Maskell RM. The natural history of urinary tract infection in women. Medical Hypotheses. 2010;74(5):802–806. doi: 10.1016/j.mehy.2009.12.011. [DOI] [PubMed] [Google Scholar]
- 26.Stamm WE, Counts GW, Running KR, Fihn S, Turck M, Holmes KK. Diagnosis of coliform infection in acutely dysuric women. The New England Journal of Medicine. 1982;307(8):463–468. doi: 10.1056/NEJM198208193070802. [DOI] [PubMed] [Google Scholar]
- 27.Stark RP, Maki DG. Bacteriuria in the catheterized patient. What quantitative level of bacteriuria is relevant? The New England Journal of Medicine. 1984;311(9):560–564. doi: 10.1056/NEJM198408303110903. [DOI] [PubMed] [Google Scholar]
- 28.Walsh CA, Siddins A, Parkin K, Mukerjee C, Moore KH. Prevalence of “low-count” bacteriuria in female urinary incontinence versus continent female controls: a cross-sectional study. International Urogynecology Journal. 2011;22(10):1267–1272. doi: 10.1007/s00192-011-1506-0. [DOI] [PubMed] [Google Scholar]
Associated Data
This section collects any data citations, data availability statements, or supplementary materials included in this article.