Abstract
Aggregation is a critical issue that hampers the development of monoclonal antibody therapeutics (Mabs). Traditionally, aggregation is considered a process in which native forms of proteins are transformed into an unstable highly associated form through an intermediate formation step. Here we describe the unfolding of an anti CD40 antibody using a folding model based on Lumry-Eyring nucleated polymerization (LENP) model. This model captures several experimental features of the thermal unfolding of this protein as studied by common in situ biophysical techniques such as circular dichroism, fluorescence spectroscopy and turbidity measurements. According to this model, the unfolding and aggregation of the anti CD40 antibody is determined by several distinct steps that include conformational change(s) to generate aggregation prone states, reversible oligomer formation, nucleation and growth as well as their kinetics and the formation of higher order assemblies/aggregates. Furthermore, the loss of monomer is controlled by both thermodynamic (equilibrium unfolding) and kinetic determinants of the unfolding process. This approach captures both of these rate-limiting steps. It can be concluded that this approach is sensitive to formulation conditions such as protein concentration, changes in buffer conditions, and temperature stress. The potential use of this approach in formulation development and stability testing of Mabs is discussed.
Keywords: Monoclonal antibody therapeutics, formulation and stability, Lumry-Eyring nucleated polymerization model, unfolding
Introduction
Monoclonal antibodies (Mab) constitute an important class of protein therapeutics (1). Several Mabs are already in use clinically for various indications with many more in different stages of development (2). The efficient development of Mabs as drugs, however, poses a number of significant challenges. Due to the desirability of reduced volumes, higher concentrations of Mabs need to be formulated. The presence of Mabs at such high concentration often leads to physical instability such as aggregation. Analytical methodology and approaches that are currently available are often inadequate to study proteins at such high concentrations. New analytical approaches are being developed to address this issue (3). Objective of this study was to explore the possibility of (i) using common in situ analytical methods to capture key events in protein unfolding and (ii) developing a suitable folding model to describe routine molecular events that can aid in the rational formulation development and stability testing of MABs.
The use of a folding model used in conjunction with various physical techniques in formulation development is tested here employing an anti CD40 monoclonal antibody as a representative protein. CD40 is a Tumor Necrosis Factor receptor found on several antigen presenting cells (4). This family of receptors is essential for mediating several immune and inflammatory responses. Anti-CD40 antibodies are potential therapeutic agents for several inflammatory disorders and immune system deficiencies. We investigated the unfolding and aggregation kinetics of this protein using several biophysical techniques such as circular dichroism (CD), fluorescence emission and turbidity measurements. Circular dichroism studies provide information about secondary structural changes, while fluorescence emission studies are sensitive to changes in tertiary structure. These two studies can be combined with turbidity measurements, which provide insight into aggregation processes in response to various simulated stress conditions.
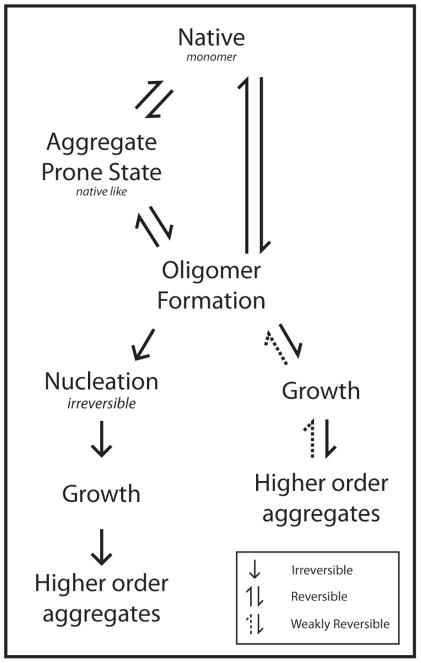
Experimental results are incorporated into a folding model based on a Lumry-Eyring nucleated polymerization (LENP) model (5). We applied this model, depicted in figure 1, to define key steps involved in the unfolding of this Mab, since it captures several of our experimental observations. The results suggest that this approach can be useful for rational formulation development and stability testing of Mabs.
Figure 1.
Folding model based on Lumry-Eyring nucleated polymerization model (LENP). Native, intermediate and oligomer formation are reversible processes with nucleation and subsequent steps representing irreversible events (LENP). In addition, the oligomer formation may not involve formation of intermediate states and larger aggregates may also dissociate back to oligomers.
Materials
Murine Anti-CD40 monoclonal antibody (Lot numbers DSW014071, DSW0108061, Clone number 82105) was obtained from R & D Systems as a lyophilized powder containing 5% trehalose. The lyophilized powder was reconstituted using sterile PBS as recommended by the manufacturer. Reconstituted sample was aliquoted and stored at −70°C to ensure no loss of activity. Multiple freeze-thaw cycles were avoided. Buffer salts were either purchased from Fisher Scientific (Fair Lawn, NJ) or from Sigma (St. Louis, MO) and were used without further purification.
Experimental Methods
Circular Dichroism Spectroscopy
CD spectra were obtained using a JASCO-715 spectropolarimeter fitted with a Peltier 300 RTS unit for temperature dependent studies. The instrument was calibrated using d10 camphor sulphonic acid. The far UV CD spectra for secondary structural analysis were acquired in the wavelength range of 207 to 260 nm. The protein concentrations used were 20 or 400 μg/ml in quartz cuvettes of 10 or 1mm path lengths, respectively. The melting profiles were generated by monitoring the ellipticity at 215 or 230 nm over the temperature range of 20°C–90°C with a 2 min holding time every 5°C. The tertiary structural changes were monitored using near UV CD spectroscopy. The spectra were acquired in the range of 320 – 240 nm using a 10 mm quartz cuvette. The protein concentration used was 0.5 mg/ml.
Protein unfolding profiles were acquired at heating rates of 30, 60 and 120°C/hr with a holding time of 2 min every 5°C. A screw capped quartz cuvette was used to minimize loss of buffer due to evaporation. The sample was monitored for loss of volume before and after each thermal stress experiment. The temperature of the sample compartment was determined using a temperature probe that was inserted in the sample cell holder adjacent to the cuvette, as recommended by the manufacturer. The transition temperatures (Tm) for the unfolding profiles were determined by fitting the data to a sigmoid function using WinNonlin (Pharsight Corporation, Mountainview, CA):
| [Eq 1] |
where Yobserved is the ellipticity at 215 nm at any given temperature T, Ynative is the ellipticity value for the native state, Tm is the transition temperature, gamma (γ) is the hill coefficient, and Δm denotes the magnitude of the ellipticity change defined as (Ynative -Yunfolded), where Yunfolded is the ellipticity value of the unfolded state. For all heating rate dependent studies, the data were normalized to account for variations in ellipticity values and represented as δθ (change in ellipticity) as a function of temperature. δθ was computed as θt-θnative, where θnative is the ellipticity of the protein in the native state and θt is the ellipticity at any given temperature. θnative was estimated by computing the mean ellipticity at initial temperatures.
Steady State Fluorescence Studies
Temperature dependent steady-state emission spectra were acquired using a PTI fluorometer (Photon Technology International, Lawrenceville, NJ) equipped with a Peltier unit. The samples were excited at 280 nm and the emission was monitored in the wavelength range of 300 nm to 400 nm. The excitation and emission slits were set at 4nm. The excitation wavelength was shifted to lower wavelengths to evaluate the impact of scattering and Raman bands on the emission spectrum. Thermal stress studies were performed over the temperature range of 20–90°C. The data points were collected every 5°C with a holding time of ~2 minutes. The concentration of the protein was typically 10μg/ml. Path length of the quartz cuvette used was 1cm.
Turbidity measurements
Turbidity measurements were obtained with a Varian Cary 300 UV-Visible spectrophotometer fitted with a heating unit. 50 μg/ml samples of anti CD40 were added to screw capped quartz cuvettes and absorbance monitored at 350 nm. The temperature dependent changes in optical density were monitored over a temperature range of 25–90°C. Isothermal incubation studies were performed at 65° and 70°C and the aggregation of the protein was followed for 75 min.
Results
Effect of thermal stress on secondary structure
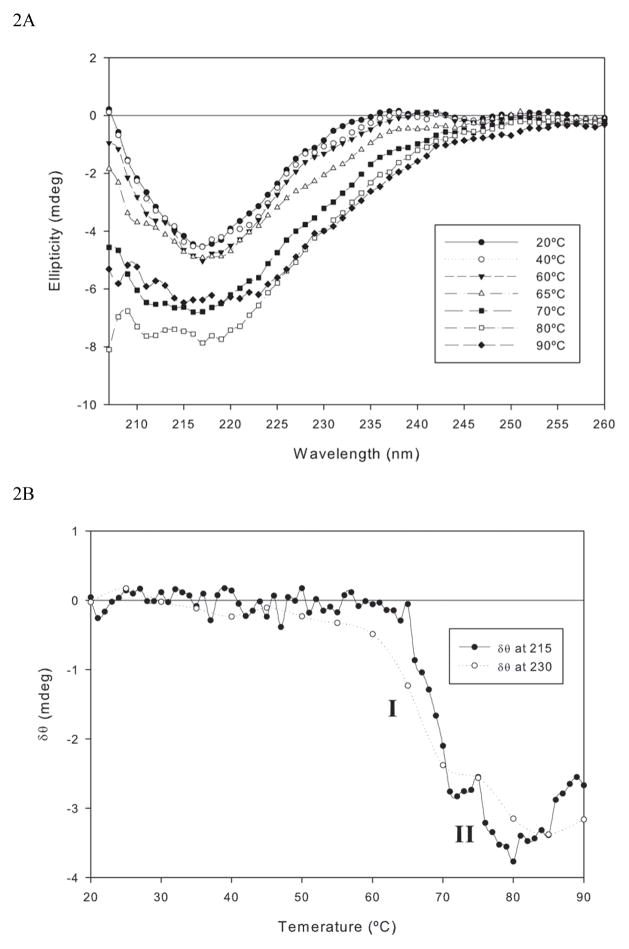
Thermal unfolding of the anti CD40 antibody was monitored by far UV CD spectroscopy to detect the temperature dependent changes in secondary structure of the protein. The far UV CD spectrum of the antibody showed a strong negative band around 217 nm and the spectrum show zero intensity at 206 nm, indicating that the protein predominantly existed in the beta sheet conformation, which is characteristic of immunoglobulin (Figure 2A). This is consistent with X-ray and molecular modeling studies for other immunoglobulins (4). As temperatures were increased to 60°C there were no significant changes observed in the spectral characteristics, indicating no substantial changes in secondary structural content over this temperature range. As the temperature is further increased from 60° to 75°C, substantial spectral changes were observed; a broadening and sharp increase in intensity (particularly >65°C) of the negative band was observed. Further increases in temperature (80–90°C) resulted in red shift with changes in spectral characteristics consistent with the formation of non-native beta sheet aggregates, as observed in the case of Factor VIII and alpha chymotrypsinogen (5, 6).
Figure 2.
Temperature dependent changes in secondary structure of an anti CD40 antibody Figure 2A: The far UV CD spectra of anti CD40 antibody (in PBS at pH 7.0), as a function of temperature. Figure 2B: Melting profile of anti CD40. Secondary structure transition of the Mab was monitored at 215 nm and 230nm while heating the protein at a rate of 60°C/hr.
The melting profile generated based upon these spectral changes is shown in Figure 2B. Since ellipticity around 215 nm is characteristic of beta sheet structures, the temperature dependent spectral changes were followed at this wavelength. In the temperature range of 20–60°C no ellipticity changes were observed. Further increase in temperature resulted in a decrease in ellipticity. Two distinct transitions were observed (indicated as I and II); one below and one above 70°C with the apparent Tm of this overall process observed around 70°C. The two transitions were attributed to the semi-independent melting of structural domains within the Mabs and is consistent with the melting behavior observed for other immunoglobulins (7). In order to capture the peak broadening as a function of temperature, a second melting profile was generated following ellipticity changes at 230 nm. The ellipticity at this wavelength also decreased as a function of temperature, though the origin of this spectral broadening is not clear. It is possible that an increase in total beta content and/or a change in the environment of aromatic side chains occur as the protein is subjected to thermal stress. The melting profile generated at 230 nm is slightly different from that observed at 215 nm. For example, in the temperature range of 60 – 65°C, the ellipticity values decreased at 230 nm but did not change at 215 nm. As the temperature is increased above 65°C, substantial spectral changes were observed at both wavelengths. The data suggest that the conformational state of the protein at 65°C may represent a critical step in the unfolding process.
Effect of thermal stress on tertiary structure
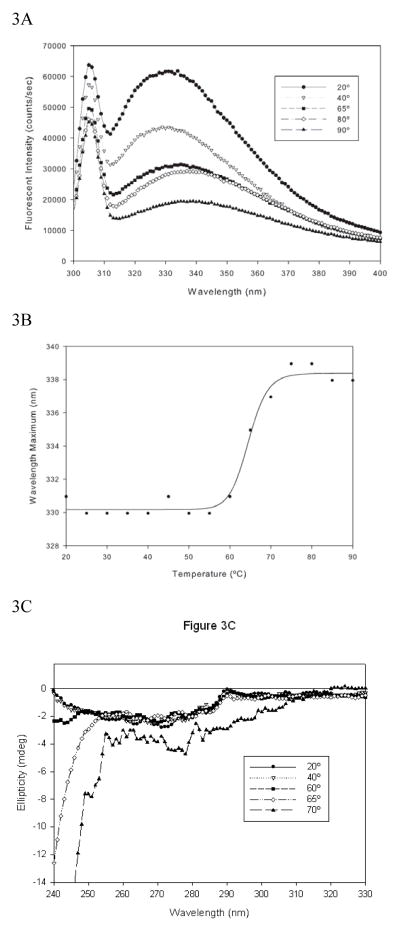
Changes in fluorescence emission spectra are generally taken to reflect changes in the tertiary structure of proteins as accessibility of fluorescent residues increases. Temperature dependent fluorescence spectra were acquired to investigate the effect of thermal stress on the tertiary structure of the antibody (Figure 3A). Since thermal inactivation of excited states leads to a loss of fluorescence intensity, shifts in emission maxima (peak position) were monitored as a function of temperature. At 20°C, the emission maxima was found to be around 330 nm with the maxima shifting to longer wavelength as the temperature was increased. An analogous form of [Eq 1] with λmax used in place of ellipticity values was applied (Figure 3B). The Tm based on tertiary structural alterations is slightly lower than that observed for secondary structural changes (Table 1). At 65°C, the protein lost substantial tertiary structural features but retained secondary structural elements as measured by far UV CD (spectral intensity at 215 nm)—behavior that is characteristic of molten globule intermediates (8, 9). However, ellipticity changes at 230 nm in far UV CD spectrum showed changes due to spectral broadening.
Figure 3.
Temperature dependent changes in tertiary structure of the anti CD40 antibody; Figure 3A: Fluorescence emission spectra of the anti CD40 antibody as a function of temperature. The sample was excited at 280 and emission monitored from 300–400 nm. The peak at 308 nm is a water Raman band while the secondary peak in the 330–340 nm range is of primary interest. Figure 3B: Melting profile generated using the peak maxima data in Figure 3A. The solid lines represent the fit obtained using a modified version of [Eq 1]. Figure 3C: Temperature dependent changes in near UV CD spectrum of the anti CD 40 antibody.
Table 1.
Thermal stress and phase transition of anti CD40 antibody as a function of heating rate (SE corresponds to fit error).
| Instrumentation | Buffer | pH (Initial) | Heating Rate (°C/hr) | Tm ± S.E. (°C) |
|---|---|---|---|---|
| Fluorescence | PBS | 7.0 | 60 | 64.5 ± 0.6 |
| CD | PBS | 7.0 | 30 | 68.3 ± 0.4 |
| CD | PBS | 7.0 | 60 | 69.1 ± 0.3 |
| CD | PBS | 7.0 | 120 | 70.5 ± 0.8 |
| CD | Acetate | 4.0 | 30 | 68.1 ± 1.8 |
| CD | Acetate | 4.0 | 60 | 69.1 ± 1.4 |
| CD | Acetate | 4.0 | 120 | 70.4 ± 2.0 |
To get further insight into tertiary structural changes, thermal unfolding was also followed by near UV CD spectroscopy (Figure 3C). A meaningful estimation of the Tm could not be made due to the rapid aggregation at the higher concentration of protein (0.5 mg/ml) used in the near UV CD studies. It was useful, however, to determine conformational changes associated with unfolding of the protein. A negative band around 270 nm was observed for the anti CD40 antibody at 20°C that remained unaltered as the temperature increased to 65°C, while ellipticity values below 250 nm decreased. This same pattern was also observed as broadening in far UV CD spectra (Figure 2) while the broadening appears more pronounced in Figure 3C because of the higher concentration used. The origin of this spectral change is not clear but could have contributions from both secondary and tertiary structural features. By 70°C the alterations in tertiary structure are readily apparent as indicated by the divergence of the profiles.
Effect of thermal stress on aggregation
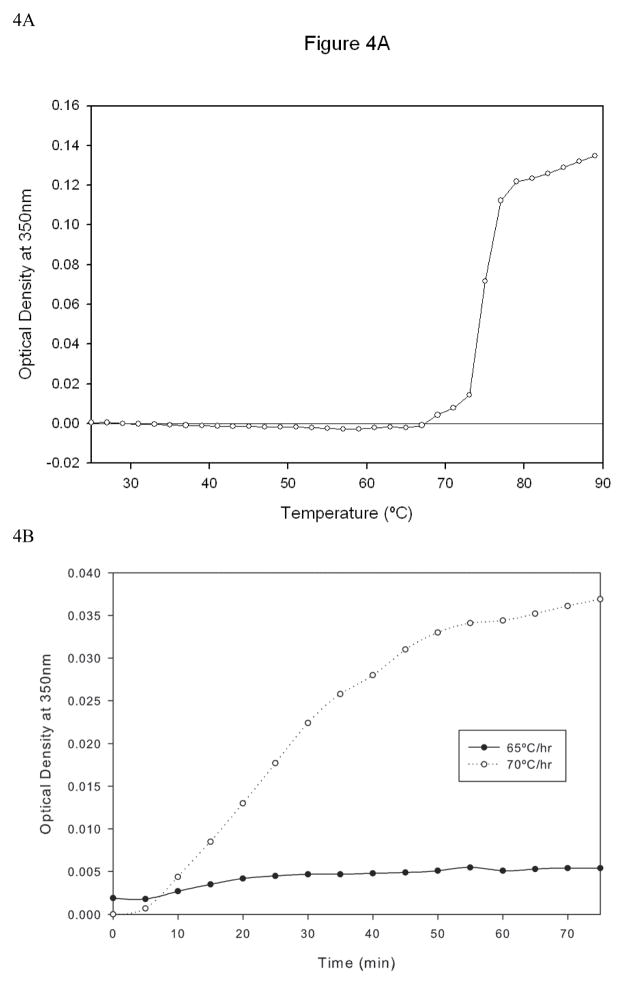
Turbidity measurements have frequently been used to monitor the aggregation of proteins (10). Temperature dependent aggregation was monitored by measuring the optical density (O.D.) at 350 nm while heating the sample chamber (Figure 4A). The O.D. did not change as the temperature was increased up to 65°C, but further increase in temperature produced increases in turbidity, indicating aggregation. The data indicate that the transition observed using CD and fluorescence (Figure 2 and 3) is associated with the formation of aggregates.
Figure 4.
Temperature dependent changes in aggregation of the anti CD40 antibody as measured by turbidity. Figure 4A: The optical density (OD) was monitored at 350 nm as a function of temperature at the two heating rates of 60°C/hr and 120 °C/hr. The concentration of the protein used was 50μg/ml. Figure 4B: Isothermal incubation studies performed at 65°C and 70°C. The optimal density at 350 nm was followed for 75 min.
To further investigate the formation and growth of oligomers, turbidity studies under isothermal incubation conditions were performed at 65°C and 70°C, a temperature range over which substantial conformational changes occurred as indicated by CD and fluorescent analysis. Incubation at 70°C caused the optical density values to increase in a time dependent manner (Figure 4B). The data suggests that there is an increase in aggregation as more aggregate prone monomer is incorporated into aggregated species. Comparatively smaller increase in optical density was observed for samples incubated at 65°C. It seems likely that nucleation is initiated between 65°–70°C, since isothermal incubation at this temperature results in aggregate formation.
Aggregation Kinetics
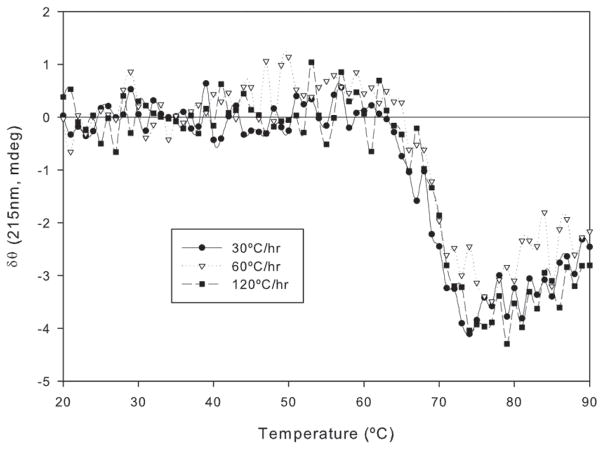
The effect of aggregation kinetics on equilibrium unfolding of anti CD40 was evaluated by acquiring melting profiles at various heating rates as has previously been applied for other proteins (6, 7, 11). The transition temperature was found to be dependent on heating rate with the Tm increasing as the heating rate increased (Table 1). This could be described by the following relationship:
| [Eq 2] |
Where A is the frequency factor, Ea is the activation energy of the unfolding step, R is the gas constant, and ν is the heating rate. The activation energy for the transition was calculated using slope (−Ea/R) of a linear plot of ln (ν/Tm2) versus 1/Tm and found to be approximately 136 Kcal/Mole (r2 = 0.97). Such dependence demonstrates that the thermal unfolding is at least in part under kinetic control. It has been shown that the unfolding of several multi domain proteins including immunoglobulins, is a kinetically controlled process and interferes with the measurement and analysis of routine equilibrium unfolding events (6, 7, 11) and the shape of the unfolding profile. It is possible that increase in size and a greater accumulation of aggregates occurs at lower heating rates. At higher heating rates, however, the protein reaches structurally disrupted and aggregated states more rapidly with minimal accumulation of aggregates of larger size. Similar conclusions were drawn for immunoglobulins by Vermeer and Norde and for recombinant Factor VIII (6, 7). The heating rate dependent size exclusion chromatography (SEC) data of FVIII showed that the position and intensity of the elution profiles were both dependent on this parameter.
Effect of protein concentration on aggregation
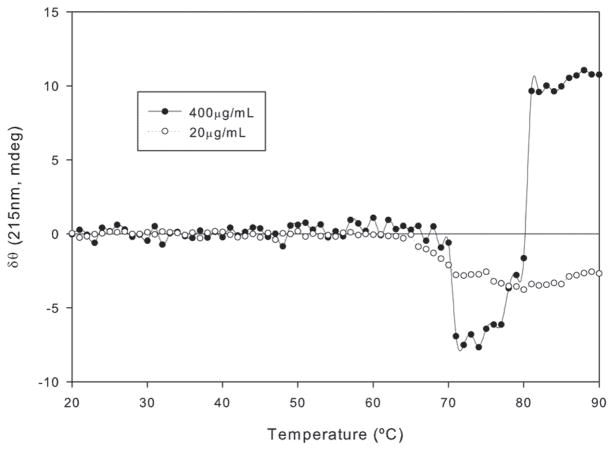
To investigate the effect of protein concentration on the aggregation of the antibody, we acquired melting profiles of the protein at higher concentration (400 μg/ml) at a 120°C/hr heating rate and compared it to the profile observed at lower concentration at the same heating rate (Figure 6). CD is an absorption measure and thus according to Beer’s law, should be linear with respect to concentration within the ideal detection range of the instrument. At lower concentration the CD ellipticity changed by 0.19 mdeg/μg/mL—the same as the transition for the higher concentration once the shorter path length is accounted for. This parameter is likely to be a measure of the relative population of monomer and aggregated species during transitions, suggesting that concentration does not at least initially alter the monomer population.
Figure 6.
The effect of concentration on the thermal unfolding of the anti CD40 antibody. The sample was subjected to thermal stress in the temperature range of 20°C to 90°C at a heating rate of 120°C/hr. The concentration of the sample used was 400 μg/ml in a 1 mm cuvette. Data from the melting profile of protein at 20 μg/ml in a 10 mm cuvette at the same heating rate (Figure 5) is replicated for reference.
Over the lower temperature range, the melting profiles overlap. At higher temperatures, the melting profile demonstrates a stark divergence. Key difference between the profiles includes a rapid increase in ellipticity during/following the transition. At higher concentration, the aggregation kinetics occur at faster rate, thus the process of unfolding and aggregation are not readily separable. The higher concentrations increase the potential for aggregation leading to a substantial alteration in the melting profile. Other factors that may alter the shape of the melting profile include loss of protein in the light path either from solvent evaporation and/or precipitation of the sample, but this was not observed here.
Effect of buffer species on aggregation
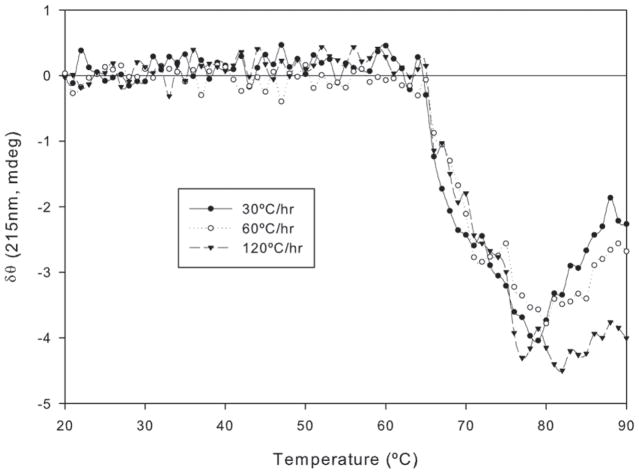
It has been shown that formulation variations such as buffer species can alter the stability of proteins and assessment of the impact of buffer species on protein stability is routinely examined during formulation development (12). We attempted to simulate a formulation condition of protein at pH 4 using acetate buffer due to its good buffering capacity in this range (2). The influence of buffer on unfolding and aggregation of the anti CD40 antibody was evaluated using CD to determine the ability of this technique to detect conformational changes, the rate of nucleation as well as growth and stability (Figure 7). Due to the temperature coefficient of the buffers employed (i.e., pH change /°C), pH changes may be elevated at higher temperatures. As an example, the pH of the acetate buffer changed by 0.14 pH units as the temperature was raised from 20°C to 90°C. Furthermore, different buffer species were required to maintain pH at 4.0 and 7.0. The effects of the nature of the buffer cannot be separated from the effects of pH in the context of these experiments. The combined impact of buffering solute and pH is therefore interpreted as a general effect of buffer conditions. The Tm was measurable but dependent on the heating rate. A similar trend was observed for the antibody in PBS at pH 7.0 (Table 1). This suggests that even at low pH, the unfolding of the protein is still at least partially under kinetic control.
Figure 7.
The effect of buffer conditions on the thermal unfolding of the anti CD40 antibody in acetate buffer at pH 4.0. The sample was subjected to thermal stress in the temperature range of 20°C to 90°C at heating rates of 30, 60 and 120°C/hr.
Discussion
The thermal unfolding of an anti CD40 antibody was monitored using far and near UV CD, fluorescence emission and turbidity measurements. Corroborating results obtained from temperature-dependent CD, fluorescence and turbidity measurements indicate that these biophysical techniques capture some key molecular events. As the protein is heated to 65°C, conformational changes occur (Figure 2 and 3), leading to the formation of oligomers. Further increases in temperature result in the growth of these aggregated species that are stabilized by conformational changes that result in the formation of inter-molecular beta strands. This conformational change is accompanied by the formation of aggregates as detected by increases in optical density (Figure 4B). Heating rate dependence studies showed that the unfolding of the protein is at least in part dependent upon the kinetics of the process (Figure 5), while concentration dependent studies showed that the aggregation of the protein is more pronounced at higher concentration (Figure 6). Since aggregation depends on formulation conditions, studies with various buffers and formulations can impact the shape of the melting profile. Overall, the unfolding of the Mab appears to be controlled by both equilibrium unfolding involving conformational changes and by aggregation kinetics, involving the rate of nucleation and growth of the aggregates. It is possible that either of these steps can be rate limiting depending on experimental conditions. Therefore, the utility of Tm in predicting long-term stability and shelf-life is low since it does not take into account the subsequent aggregation kinetics that interfere with equilibrium unfolding measurements. We propose that in addition to Tm, several other parameters should also be taken into account as predictors of stability. The formation and kinetics of aggregation prone conformational state (as observed at 65°C) may be useful for predicting stability and shelf-life. The spectral characteristics of this conformational state is native like but with some detectable differences; a broader far UV CD spectrum with a small red shift in the fluorescence emission maxima. Further, the shape of the melting profile and its heating rate dependence both provide insight into aggregation kinetics and their impact on equilibrium unfolding. We propose that this may be of significance, since stability and shelf-life may not only defined or be reflected by equilibrium unfolding but may also be a function of aggregation kinetics which are expected to be more pronounced at higher concentration.
Figure 5.
Heating rate dependence of the thermal unfolding of the anti CD40 antibody. The secondary structure transition of the protein was monitored with far UV CD at 215 nm over the temperature range of 20 – 90°C at different heating rates.
Roberts and his colleagues have elegantly analyzed the unfolding and kinetics of the aggregation of alpha-chymotrypsinogen using a LENP model (13). The model proposed here is based on LENP to define key steps involved in the unfolding of this Mab (Figure 1).
The initial monomer (native state) undergoes conformational changes in the temperature range of 50° to 65°C. These conformational changes may represent either the Fc or Fab portions of the antibody. It has been shown that for murine Mabs the first transition corresponds to the Fc portions while in the same humanized immunoglobulins the Fab region is altered first (7, 14). This conformational change may represent an aggregation prone state(s) and to initiate oligomerization events. The formation of this conformational state and subsequent kinetics may be critical to the stability of the protein. Further thermal stress (between 65°C and 70°C) results in the formation of small protein clusters. It is probable that these oligomers are transient and cannot be detected using time-averaged analytical techniques such as SEC. Multiple orthogonal techniques, such as CD and turbidity measurements, however, may be used to infer the presence of these key kinetic intermediates. As seen by turbidity measurements, there is a difference in aggregation kinetics between samples incubated at 65°C and 70°C, suggesting that the formation of both kinetic intermediate states and nucleation occur in this temperature range. Irreversible conformational rearrangements lead to nucleation (which may have unqiue signatures in CD spectra. The oligomerization can also constitute a reversible growth phase as more native like monomers are added to the oligomers (Figure 1). The growth phase involves addition and rearrangement of aggregation prone monomers at 70°C and above that result in the formation of soluble high molecular weight aggregates. During this stage, conformational changes such as the formation of intermolecular beta strands are observed as seen in CD spectra (figure 2A). This is corroborated by turbidity measurements that show substantial increase in optical density. The kinetics of this stage determines the shape of the melting profile. If the rate is faster due to higher protein concentration or solution conditions such as buffer species, it is likely that the trend observed in the melting profiles would manifest as increases in spectral intensity with temperature. This type of spectral change is a common feature of aggregating proteins which form intermolecular beta-structure (15). Assembly of aggregates and/or condensation occurs leading to the formation of bundles and filaments. This stage requires a threshold aggregate size, which is a function of the nucleation and growth phases of the model. These phases are not well described by the analytical techniques employed here owing to a lack of suitable analytical techniques that can quantitatively describe sub visible particles (16).
The model based helps to dissect the melting profile of this antibody and to better understand the nature of the molecular level changes that occur during unfolding. Any changes in any portion of the melting profile as function of formulation variations would give an insight into the molecular level details on the impact of that excipient on unfolding. For example, the melting profile during and after transition captures nucleation and growth phase of aggregation, respectively. Since Mabs often share common molecular, conformational and folding characteristics, this model based on Lumry-Eyring nucleated polymerization model combined with appropriate spectroscopic measurements provides a rational approach to aid in the formulation development of Mabs and could be used in screening formulation buffers and excipients as well as for clonal selection. Furthermore, according to this model, the loss of monomer and rate of aggregation are important factors that should define protein stability and shelf life. These two factors depend critically on formulation conditions such as initial protein concentration, conformational changes, aggregate size, and rate of nucleation and growth.
Applicability of the approach
The authors suggest the following experimental approach could be employed to aid in the formulation development and stability testing of Mabs: (i) Conformational analysis under thermal stress at lower protein concentration (under these experimental conditions it is assumed that the contribution of aggregation kinetics is minimal) using CD and fluorescence spectroscopy. The melting profile generated helps to understand equilibrium unfolding and the role of thermodynamics in the process. Furthermore, these techniques can also identify aggregation prone states during unfolding. If the process is reversible, calculation of thermodynamic parameters may be usefully obtained. Differential scanning calorimetry (DSC) could also be employed to this end. (ii) Turbidity measurement performed with lower concentration samples under thermal stress to determine the conditions under which aggregates are formed. Since turbidity can also indicate phase separation and is highly concentration dependent, this could also be replaced by other techniques. Nephelometery and right angle light scattering measurements during fluorescence analysis are potentially more sensitive methods. Comparing the melting profile generated using turbidity or other light scattering based measurements with that generated using CD experiments provide information regarding the conformational changes associated with formation of aggregates. FTIR may also be used for the same purpose. (iii) Heating rate dependent studies should be employed to evaluate the contribution of aggregation kinetics. Using this data, the activation energy for the aggregation kinetics can be estimated. (iv) Turbidity and CD spectral studies under isothermal incubation conditions at various temperatures provide information on nucleation and growth stage of the aggregates. (v) The melting profile using thermal stress at various (higher) concentrations of the protein provides information about the effect of concentration on the shape of the melting profile. Maintaining optical density within proper limits with the use of shorter path length and screw capped cuvettes to avoid evaporation are some of the precautions that must be taken while analyzing samples at higher concentration. Heating rate dependence at higher concentration of the sample is useful for estimating increases in the rate of aggregation and its effect on equilibrium unfolding. (vi) Application of the folding model to understand protein behavior under unfolding conditions and comparison of several formulation variations gives insight into the role of excipients on the aggregation of the protein that is controlled both by equilibrium unfolding and by aggregation kinetics(13).
Conclusions
Overall, this experimental approach combined with folding model has the potential to be an important tool during the formulation development of Mabs and analysis of their stability. The approach also identifies an aggregation prone conformational state. Monitoring the formation and kinetics of this conformational change would provide insight into the stability and possibly help to predict the shelf-life of the protein. Furthermore, automation of these techniques to permit measurement of multiple samples simultaneously makes it an attractive approach for high throughput formulation development for buffer species selection, screening for other excipients and for clonal selection. Proteins produced by multiple clones can be compared for stability, providing information to detect those clones that produce soluble aggregates. The nucleation and growth phase of these clones would distort melting profiles due to increased rate of nucleation and aggregate growth. In addition, understanding the key steps and molecular changes during unfolding would in aid rational formulation development and in the identification of stabilizing excipients by facilitating their optimization.
Acknowledgments
The authors would like to thank the pharmaceutical instrumentation facility at SUNY Buffalo for the use of circular dichroism and fluorescence spectrophotometer. These instruments were obtained by Shared Instrumentation Grants S10-RR013665 and S10-RR15877 from the National Center for Research Resources, National Institute of Health.
References
- 1.Usami A, Ohtsu A, Takahama S, Fujii T. The effect of pH, hydrogen peroxide and temperature on the stability of human monoclonal antibody. J Pharm Biomed Anal. 1996;14:1133–1140. doi: 10.1016/s0731-7085(96)01721-9. [DOI] [PubMed] [Google Scholar]
- 2.Wang W, Singh S, Zeng DL, King K, Nema S. Antibody structure, instability, and formulation. J Pharm Sci. 2007;96:1–26. doi: 10.1002/jps.20727. [DOI] [PubMed] [Google Scholar]
- 3.Harn N, Allan C, Oliver C, Middaugh CR. Highly concentrated monoclonal antibody solutions: direct analysis of physical structure and thermal stability. J Pharm Sci. 2007;96:532–546. doi: 10.1002/jps.20753. [DOI] [PubMed] [Google Scholar]
- 4.Kindt TJ, Goldsby RA, Osborne BA. Immunology. 6. W.H. Freeman and Co; New York: 2007. [Google Scholar]
- 5.Andrews JM, Roberts CJ. Non-native aggregation of alpha-chymotrypsinogen occurs through nucleation and growth with competing nucleus sizes and negative activation energies. Biochemistry. 2007;46:7558–7571. doi: 10.1021/bi700296f. [DOI] [PubMed] [Google Scholar]
- 6.Ramani K, Purohit V, Middaugh CR, Balasubramanian SV. Aggregation kinetics of recombinant human FVIII (rFVIII) J Pharm Sci. 2005;94:2023–2029. doi: 10.1002/jps.20432. [DOI] [PMC free article] [PubMed] [Google Scholar]
- 7.Vermeer AW, Norde W. The thermal stability of immunoglobulin: unfolding and aggregation of a multi-domain protein. Biophys J. 2000;78:394–404. doi: 10.1016/S0006-3495(00)76602-1. [DOI] [PMC free article] [PubMed] [Google Scholar]
- 8.Ptitsyn OB, Pain RH, Semisotnov GV, Zerovnik E, Razgulyaev OI. Evidence for a molten globule state as a general intermediate in protein folding. FEBS Lett. 1990;262:20–24. doi: 10.1016/0014-5793(90)80143-7. [DOI] [PubMed] [Google Scholar]
- 9.Balasubramanian SV, Bruenn J, Straubinger RM. Liposomes as formulation excipients for protein pharmaceuticals: a model protein study. Pharm Res. 2000;17:344–350. doi: 10.1023/a:1007561308498. [DOI] [PubMed] [Google Scholar]
- 10.Cromwell ME, Hilario E, Jacobson F. Protein aggregation and bioprocessing. AAPS J. 2006;8:E572–579. doi: 10.1208/aapsj080366. [DOI] [PMC free article] [PubMed] [Google Scholar]
- 11.Sanchez-Ruiz JM, Lopez-Lacomba JL, Cortijo M, Mateo PL. Differential scanning calorimetry of the irreversible thermal denaturation of thermolysin. Biochemistry. 1988;27:1648–1652. doi: 10.1021/bi00405a039. [DOI] [PubMed] [Google Scholar]
- 12.McGoff PG, Scher DS, editors. Solution formulation of Proteins and Peptides. Vol. 99. Marcel Dekkar; New York: 2000. [Google Scholar]
- 13.Andrews JM, Roberts CJ. A Lumry-Eyring nucleated polymerization model of protein aggregation kinetics: 1. Aggregation with pre-equilibrated unfolding. J Phys Chem B. 2007;111:7897–7913. doi: 10.1021/jp070212j. [DOI] [PubMed] [Google Scholar]
- 14.Ionescu RM, Vlasak J, Price C, Kirchmeier M. Contribution of variable domains to the stability of humanized IgG1 monoclonal antibodies. J Pharm Sci. 2008;97:1414–1426. doi: 10.1002/jps.21104. [DOI] [PubMed] [Google Scholar]
- 15.Weiss WFt, Young TM, Roberts CJ. Principles, approaches, and challenges for predicting protein aggregation rates and shelf life. J Pharm Sci. 2008;98:1246–1277. doi: 10.1002/jps.21521. [DOI] [PubMed] [Google Scholar]
- 16.Carpenter JF, Randolph TW, Jiskoot W, Crommelin DJ, Middaugh CR, Winter G, Fan YX, Kirshner S, Verthelyi D, Kozlowski S, Clouse KA, Swann PG, Rosenberg A, Cherney B. Overlooking subvisible particles in therapeutic protein products: Gaps that may compromise product quality. J Pharm Sci. 2008;98:1201–1205. doi: 10.1002/jps.21530. [DOI] [PMC free article] [PubMed] [Google Scholar]


