

Abstract
Ligands such as enzyme inhibitors stabilize the native conformation of a protein upon binding to the native state, but some compounds destabilize the native conformation upon binding to the non‐native state. The former ligands are termed “stabilizer chaperones” and the latter ones “destabilizer chaperones.” Because the stabilization effects are essential for the medical chaperone (MC) hypothesis, here we have formulated a thermodynamic system consisting of a ligand and a protein in its native‐ and non‐native state. Using the differential scanning fluorimetry and the circular dichroism varying the urea concentration and temperature, we found that when the coenzyme NADP+ was absent, inhibitors such as isolithocholic acid stabilized the aldo–keto reductase AKR1A1 upon binding, which showed actually the three‐state folding, but destabilized AKR1B10. In contrast, in the presence of NADP+, they destabilized AKR1A1 and stabilized AKR1B10. To explain these phenomena, we decomposed the free energy of stabilization (ΔΔG) into its enthalpy (ΔΔH) and entropy (ΔΔS) components. Then we found that in a relatively unstable protein showing the three‐state folding, native conformation was stabilized by the negative ΔΔH in association with the negative ΔΔS, suggesting that the stabilizer chaperon decreases the conformational fluctuation of the target protein or increase its hydration. However, in other cases, ΔΔG was essentially determined by the delicate balance between ΔΔH and ΔΔS. The proposed thermodynamic formalism is applicable to the system including multiple ligands with allosteric interactions. These findings would promote the development of screening strategies for MCs to regulate the target conformations.
Keywords: medical chaperone, stabilizer, destabilizer, entropy, protein conformation, aldo–keto reductase, ΔΔG, ΔΔS
Introduction
Medical chaperones (MCs)1, 2, 3, 4 are small molecules capable of modulating the free energy landscape of a protein upon binding, thereby increasing the stability of the native conformation and preventing the abnormal aggregate formation. Although MCs are considered to be the candidates of therapeutic agents for treating various conformational diseases,1, 2, 3, 4 the general formulation of their mechanism of action or concrete experimental evidence showing the degree of stabilization have not yet been described. Here we propose the thermodynamic formulation of the stabilization effects on protein conformations upon ligand binding, and also provide the experimental evidences for the proposed formalism using aldo–keto reductases (AKR) superfamily proteins.
AKR superfamily5, 6 was extensively studied as a target for anti‐cancer drug design.7, 8 Especially AKR1B10 was reported to be closely associated with cell carcinogenesis and tumor development by regulating the retinoid acid homeostasis,5, 6 the lipid metabolism,9 and the isoprenoid metabolism.10 For AKR superfamily, various ligands were synthesized11, 12 and their interactions were extensively studied.10 Hence, AKR superfamily was considered to be the appropriate system to examine the proposed formalism.
To describe the ligand binding to the protein, population of the denatured state is not negligible, as the Gibbs free energy difference (ΔG) between the denatured (D) and native state (N) is usually < 10 kcal/mol,13 and the ligand binding may markedly perturb ΔG, affecting the population of N. Therefore in order to discuss the stability of the native conformation, here we introduce ligand (L), N, intermediate state (I) and D into the physical model described by the following scheme;
in which N and NL are considered to be within the native ensemble in the presence of L, while I, IL, and D are within the non‐native ensemble. DL may be eliminated in case of MCs because of their specific interaction with the well‐defined binding pockets.
Under the above perspective, the ligand can perturb the stability of the native state with the free energy of stabilization (ΔΔG) as illustrated in Figure 1, whose sign is either negative [Fig. 1(A)] or positive [Fig. 1(B)]. The native conformation is stabilized in the presence of a ligand (stabilizer chaperone) [Fig. 1(A)] or destabilized (destabilizer chaperone) [Fig. 1(B)]. Here we present several experimental examples of stabilizer and destabilizer chaperones demonstrated by the differential scanning fluorimetry (DSF),14 and the circular dichroism (CD) as a function of denaturant concentration and temperature.
Figure 1.

Possible mechanisms for the (de)stabilization of the native state by ligands. The ligand binding to different states results in different thermodynamic effects on proteins. (A) The ligand preferentially binds to the native state (N), which results in the stabilization of the native state (ΔΔG < 0). (B) The ligand preferentially binds to an intermediate state (I) or the denatured state (D), which results in the destabilization of the native state (ΔΔG > 0). Note that ΔΔG=ΔG free − ΔG ligand.
By the nonlinear curve fitting, we also decomposed ΔΔG into the enthalpy contribution (ΔΔH), and the entropy contribution (ΔΔS), which depends on the characteristics of the conformational fluctuation of the protein and/or the solvation,15 and finally discussed on the overall thermodynamic pictures of the stabilizer‐ and the destabilizer chaperones.
Results
Effects of isolithocholic acid on the stability of AKR superfamily proteins
The melting temperature (T m) of AKR1A116 [Fig. 2(A)] decreased with increasing concentration of isolithocholic acid (ILCA) in the presence of coenzyme NADP+, as shown in Figure 2(C). However, T m of AKR1B1017 [Fig. 2(B)] increased with increasing concentration of ILCA, as shown in Figure 2(D). Thus, in the presence of NADP+, ILCA destabilized AKR1A1, but stabilized AKR1B10.
Figure 2.

(A) Three‐dimensional (3D) structure of AKR1A1 in complex with NADP+ (PDB: 2ALR16). (B) 3D structure of AKR1B10 in complex with NADP+ (PDB: 1ZUA17). A key structural difference between AKR1B10 and AKR1A1 lies in a loop region at the N‐terminus, which is indicated by the dotted circle. (C) Differential scanning fluorimetry (DSF) curves of AKR1A1 in the presence of various concentrations of C21 [Isolithocholic acid (ILCA), 0 (black), 3.13 (yellow), 6.25 (light blue), 12.5 (green), 25 (blue), and 50 (red) μM)]. (D) DSF curves of AKR1B10 in the presence of various concentrations of C21 [0 (black), 3.13 (yellow), 6.25 (light blue), 12.5 (green), 25 (blue), and 50 (red) μM].
Next, we surveyed T m for 24 combinations of six compounds (C9, C26, C18, C21, C12, and C14) and two proteins (AKR1A1 and AKR1B10) in the presence or absence of NADP+ (Fig. 3). The difference in T m upon binding of ligands (ΔT m) varies depending on the combination of ligand, protein, and NADP+. However, ΔT m values were almost all positive, indicating the stabilizing effect on AKR1s, except for the combination of ILCA and AKR1A1 shown in Figure 3(D).
Figure 3.
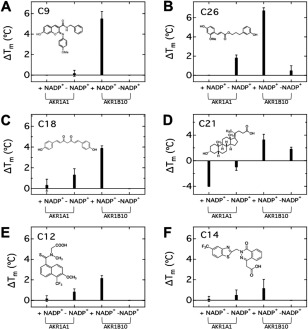
Changes in melting temperature (ΔT m) of AKR1A1 and AKR1B10 in the presence and the absence of NADP+ with C9 (A), C26 (B), C18 (C), C21 (D), C12 (E) and C14 (F), which are considered as potential inhibitors of human aldo–keto reductases familie members (AKR1).
According to the thermodynamic formulation on the change in stability of the conformation upon ligand binding shown in the Eq. (A15) in Appendix, ΔΔG is linearly dependent on temperature upon binding in the experimental condition where T ∼ T m (See Appendix for definitions of variables.).
| (1) |
We measured the T m of a lysozyme solution as a function of urea or guanidine hydrochloride. As shown in Figure S1 (Supporting Information), T m decreased almost linearly with increase in the urea or guanidine hydrochloride concentration. As the free energy of the protein solution is linearly dependent on the denaturant concentration,18 this clearly indicates that Eq. (1) is valid within the observed temperature scale.
We used SYPRO Orange for the fluorescence detection in DSF, but it binds to the intermediate state or the denatured state of a protein, and thus destabilizes the native conformation. To remove this effect of SYPRO Orange, we used the difference in the melting temperature (ΔT m). However, to confirm the above phenomena further and to analyze the effects of ligand binding more quantitatively, we used CD spectra as a function of temperature and urea concentration, applied the proposed formalism to the AKR and inhibitor system, and evaluated ΔΔG, ΔΔH, and ΔΔS upon ligand binding.
Stabilization of AKR1A1 by ligand binding in the absence of NADP+
We measured the urea denaturation curve of AKR1A1 in the absence of coenzyme NADP+ using CD spectra [Fig. S2(A), Supporting Information; 4(A)]. Surprisingly, during the folding process of AKR1A1, a folding intermediate was clearly observed [Fig. 4(A), red], indicating that the process involves at least three states. Native, intermediate, and denatured populations were obtained by fitting of the CD denaturation curves as a function of urea concentration [Fig. S2(C), Supporting Information]. Conversely, in the presence of ILCA, the native conformation was markedly stabilized, as shown in Figure S2(B) and S2(D), Supporting Information. AKR1A1 was stabilized by the binding of ligands such as C18 or C21 (ILCA) [Fig. 4(A)], and also strongly stabilized by the binding of NADP+ [Fig. 4(B)]. To understand the thermodynamic origin of the stability, we next decomposed the free energy of stabilization into the enthalpy‐ and the entropy components using a previously described method.19, 20 Briefly, we measured urea‐denaturation at various temperature (5–35°C) in the presence or absence of ligands, to obtain the temperature dependence of ΔG. The ΔG versus temperature plot was subsequently fit to Gibbs–Helmholtz equation [Eq. (2)] to calculate the ΔS and ΔH contributions to the ΔG. The ΔΔH and ΔΔS were then calculated using the Eqs. (5) and (6), and plotted in Figure 5(A). Notably, entropy decreased upon the binding of C18 and C21 to AKR1A1 (ΔΔS < 0).
Figure 4.
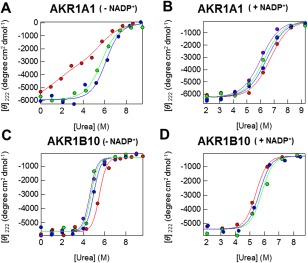
The thermal stability of AKR1A1 and AKR1B10 measured using far‐UV CD. Measurements were performed at 5°C in the presence and absence of various compounds. (A) AKR1A1 in the absence of NADP+. The molar ellipticities as a function of urea in the absence of ligand (red circles) or in the presence of C18 (green circles), or C21 (blue circles) are shown. (B) AKR1A1 in the presence of NADP+. The molar ellipticities as a function of urea in the absence of ligand (red circles) or in the presence of C12 (purple circles), C18 (green circles), or C21 (blue circles) are shown. (C) AKR1B10 in the absence of NADP+. The molar ellipticities as a function of urea in the absence of ligand (red circles) or in the presence of C18 (blue circles), C21 (purple circles), or C26 (green circles) are shown. (D) AKR1B10 in the presence of NADP+. The molar ellipticities as a function of urea in the absence of ligand (red circles) or in the presence of C21 (purple circles) or C26 (green circles) are shown. The solid lines represent least‐square fits to three‐state or two‐state unfolding equations.
Figure 5.

Thermodynamic profiles at 20°C (ΔΔG, ΔΔH, and −TΔΔS) of the ligand binding to (A) AKR1A1 in the presence of NADP+, (B) AKR1A1 in the absence of NADP+, (C) AKR1B10 in the presence of NADP+, and (D) AKR1B10 in the absence of NADP+.
Destabilization of AKR1A1 by ligand binding in the presence of NADP+
Next, we performed a similar analysis in the presence of NADP+. Intriguingly, the folding reaction of AKR1A1 almost showed a two‐state process in the presence of NADP+ [red line in Fig. 4(B)]. Moreover, the binding of ligands such as C12, C18, or C21 destabilized the native conformation of AKR1A1 [Fig. 4(B)]. The positive ΔΔG values depend on the delicate balance of entropy‐ and enthalpy contribution, as shown in Figure 5(B).
Destabilization of AKR1B10 in the absence of NADP+
We measured the urea denaturation curve of AKR1B10 in the absence of the coenzyme NADP+ using CD spectra [Fig. 4(C)]. AKR1B10 showed a clear two‐state transition. Conversely, in the presence of C18, C21 (ILCA), and C26, the native conformation was markedly destabilized, as shown in Figure 4(C). The temperature dependence of ΔG was obtained using the curve fitting of [Θ]222 as described above, and the obtained ΔΔS and ΔΔH contributions are plotted in Figure 5(C). Notably, entropy increased upon the binding of C18, C21, and C26 (ΔΔS > 0).
Stabilization of AKR1B10 in the presence of NADP+
We conducted a similar analysis for AKR1B10 in the presence of NADP+. The folding reaction of AKR1B10 was shown to have two‐state characteristics in the presence of NADP+ [Fig. 4(D)]. Intriguingly, the binding of ligands such as C21 and C26 stabilized the native state of AKR1B10 [Fig. 4(D)]. ΔΔG decreased upon binding of C21 and C26 [Fig. 5(D)], and ΔΔS values were positive.
Discussion
The key and lock model or induced fit model21 was used to describe the interaction between a protein and a ligand, enabling the determination of the free energy of binding. However, this approach never explains the stability of the native conformation or ΔΔG, because the denatured state is not included in the model. Historically the effect of ligands on protein stability was investigated using calorimetry22, 23 and the spectroscopic methods.24, 25 Recently, coupled folding‐binding reaction was reported on the intrinsically disordered protein.26, 27 The idea of stabilization of the native state by ligand binding was qualitatively described,28 and the quantitative formulation and its numeric solution were recently proposed.25
Here we have shown that ILCA stabilizes the native state of AKR1A1 in the absence of NADP+, while destabilizes the native state of AKR1A1 in the presence of NADP+. Conversely, ILCA destabilizes the native state of AKR1B10 in the absence of NADP+, while stabilizes the native state of AKR1B10 in the presence of NADP+. Binding site of NADP+ was already elucidated16, 17 and the binding site of Tolrestat (C12) was different than that of NADP+. Thus those interactions are considered to be the allosteric effect.27, 29, 30 The structure of AKR1A116 is slightly different from that of AKR1B1017 in the region indicated by the dotted circle in Figure 2(A) and (B). AKR1A1 forms a β‐sheet, whereas AKR1B10 forms a loop, both of which are somewhat close to the NADP+‐binding site. Although the structures near the catalytic site differ between the two proteins, the differences in their interactions with ligands remain elusive.
In order to treat these complex systems, we need to establish a general scheme in which the interaction with more than one ligand and the conformational change of a protein upon ligand binding are allowed.
We here propose a simple thermodynamic model system as described in Appendix, which is generally applicable to the system including the non‐native‐ or denatured state to yield ΔΔG upon binding of a ligand using the equilibrium binding constants (K d N and Kd I) or the general thermodynamic parameters (see Appendix).
In order to decompose ΔΔG into ΔΔH and ΔΔS contributions, here we also included the ΔCp contribution in the analysis shown in Eqs. (1), (2), (3), (4), and found that to stabilize the relatively unstable native state (ΔΔG < 0), it might be important to reduce the conformational fluctuation (ΔΔS < 0) with the expense of ΔΔH (> 0), as shown in Figure 5(A), while in other case, the sign of ΔΔG generally depends on the delicate balance of ΔΔS and ΔΔH, as shown in Figure 5(B–D), and Table 1. Of note, as shown in Table 1, ΔCp and m values were distinct but similar between different protein systems.
Table 1.
Summary of Ligand‐Binding Properties
| Protein | System | Ligand |
IC50
(nM) |
T
m
b
(°C) |
ΔH
vf
c
(kcal/mol) |
ΔCp
c
(kcal/mol K) |
m‐valued
(kcal/mol M) |
ΔH
e
[ΔΔH] (kcal/mol) |
‐TΔS
e
[‐TΔΔS] (kcal/mol) |
ΔG
e
[ΔΔG] (kcal/mol) |
|---|---|---|---|---|---|---|---|---|---|---|
| AKR1A1 |
3‐state (U↔I↔N) |
none | ‐ | 46.5 ± 0.4 | 106.7 ± 6.0 | 4.10 ± 0.33 | 0.98 ± 0.06 |
−1.86 [‐] |
6.07 [‐] |
4.21 [‐] |
| C18 | N.D.a | 46.6 ± 0.5 | 126.7 ± 6.0 |
17.78 [−19.64] |
−11.90 [17.97] |
5.88 [−1.66] |
||||
| C21 | N.D.a | 45.0 ± 1.1 | 130.3 ± 5.9 |
27.91 [−29.77] |
−21.80 [27.88] |
6.11 [−1.89] |
||||
|
AKR1A1 + NADP+ |
2‐state (U↔N) |
none | ‐ | 45.7 ± 0.3 | 114.5 ± 4.0 | 3.63 ± 0.22 | 0.79 ± 0.01 |
21.52 [‐] |
−16.13 [‐] |
5.39 [‐] |
| C12 | 42,000 | 46.1 ± 0.3 | 108.3 ± 3.8 |
13.46 [8.06] |
−8.59 [−7.54] |
4.87 [0.52] |
||||
| C18 | 2,900 | 46.1 ± 0.3 | 110.8 ± 4.0 |
15.99 [5.53] |
−10.92 [−5.21] |
5.07 [0.32] |
||||
| C21 | 68,000 | 42.1 ± 0.1 | 111.6 ± 4.0 |
31.35 [−9.83] |
−26.40 [10.28] |
4.94 [0.45] |
||||
| AKR1B10 |
2‐state (U↔N) |
none | ‐ | 52.6 ± 0.1 | 149.4 ± 3.1 | 3.64 ± 0.14 | 1.65 ± 0.04 |
30.76 [‐] |
−21.95 [‐] |
8.81 [‐] |
| C18 | N.D.a | 52.8 ± 0.1 | 138.6 ± 3.1 |
19.21 [11.55] |
−11.49 [−10.47] |
7.73 [1.08] |
||||
| C21 | N.D.a | 54.7 ± 0.1 | 140.7 ± 3.2 |
18.04 [12.72] |
−9.69 [−12.26] |
8.34 [0.46] |
||||
| C26 | N.D.a | 52.7 ± 0.1 | 144.3 ± 3.1 |
21.7 [9.05] |
−13.77 [−8.18] |
7.94 [0.87] |
||||
| AKR1B10+ NADP+ |
2‐state (U↔N) |
none | ‐ | 54.0 ± 0.4 | 122.2 ± 2.8 | 2.79 ± 0.13 | 1.43 ± 0.04 |
27.36 [‐] |
−19.77 [‐] |
7.59 [‐] |
| C21 | 27 | 56.9 ± 0.1 | 125.5 ± 3.2 |
22.67 [4.72] |
−14.61 [−5.19] |
8.06 [−0.47] |
||||
| C26 | 6.2 | 61.0 ± 0.1 | 126.9 ± 2.9 |
12.57 [14.82] |
−4.32 [−15.48] |
8.25 [−0.66] |
IC50 value was not determined, because the enzymatic activity is absent without the cofactor, NADP+.
Melting temperature obtained by DSF experiments. Error represents the standard deviation in three experiments.
Van't Hoff enthalpy and heat capacity obtained by analyzing the ΔG versus T plot over 5°C −35°C (see Material and Methods section). Error represents the fitting error in one S.D.
m‐value in the transition from the unfolded to native states, obtained by urea‐unfolding experiments. Error represents the fitting error in one S.D.
Enthalpic and entropic contributions to the free energy at 20°C, which were calculated from the T m, ΔCp and ΔH vf on the basis of the Eqs. (3) and (4).
High energy states4, 31 usually associated with the ligand binding were reported to be within the native ensemble, and the bound state is considered to be different than the unbound state. However, as long as these multiple states are within the native ensemble, they may increase overall stability of the native ensemble. Whereas these states are outside of the native ensemble, they will decrease the stability of the native ensemble.
Therefore, the ligands that stabilize the native state (ΔΔG < 0) [Fig. 1(A)] bind primarily to the native conformation (N), while those destabilize the native state (ΔΔG > 0) bind to the intermediate (I) or denatured state (D) [Fig. 1(B)]. In this viewpoint, it is intriguing that in the absence of NADP+, ligands mainly bind to the native AKR1A1 and to the intermediate or the denatured state of AKR1B10, while in the presence of NADP+, ligands mainly bind to the intermediate or the denatured state of AKR1A1 and to the native AKR1B10, as shown in Figure 4. Although ligand binding to denatured state25, 32 of other proteins were reported, in AKRs there is no structural evidence for the binding to the non‐native or denatured state at this stage and their native structures are actually similar [Fig. 2(A,B)]. However, because the homology of aminoacid sequences of AKR1A133 and AKR1B1034 is 51.5%, ligand‐binding properties of their denatured states may be somewhat different. It must be emphasized again that ΔΔG depends on the subtle balance between ΔH and ΔS and also between the binding constants with native, intermediate, and denatured states.
ILCA may bind to the intermediate state of AKR1A1 with NADP+ [Fig. 4(B)] where binding pocket may be at least conserved, but this state has not been directly observed. Although bile acids are reported to induce protein unfolding,35 here it was shown that ILCA stabilizes the native conformation of AKR1A1 without NADP+ [Fig. 4(A)]. It is interesting to note that lithocholic acid inhibits the polymerization of PiZ alpha‐1‐antitrypsin,36 and extends the life span of the yeast Saccharomyces cerevisiae.37 The variety of functions of lithocholic acids may be arose from their action on the wide spectrum of the protein conformation.
A thermodynamic study on the stabilization of α‐galactosidase upon binding of a pharmacological chaperone was reported.38 It was also reported that the aggregation of α‐galactosidase is a determinant of its efficacy against Fabry disease.39 Therefore, stabilization of the native conformation of proteins is an important strategy to prevent the diseases associated with protein misfolding. However, many reports on the small compounds have emphasized their stabilization effects on the native conformations thus far. In fact, during the in silico screening process of anti‐prion compounds, we eventually found that many compounds inhibited pathogenic conversion, although some compounds promoted the pathogenic conversion reaction.40 Small compounds that stabilize the native conformation of a prion protein may be regarded as stabilizer chaperones, whereas compounds that destabilize the prion protein and promote conversion reaction may be regarded as destabilizer chaperones. Thus an important goal is to establish a rational strategy to design stabilizer or destabilizer chaperones depending on the target proteins. For instance, to prevent the aggregate formation, we may stabilize either native‐, intermediate‐, or even denatured state depending on the conformational properties of the target protein.
Materials and Methods
Materials
Dimethylsulfoxide (DMSO), methanol, NADP+, and the fluorescent dye used in the DSF experiments, as well as SYPRO® Orange Protein Gel Stain (supplied as S5692) were obtained from Sigma‐Aldrich Co. LLC. (St. Louis, MO). SYPRO Orange was supplied as a DMSO solution at 5000× concentration. The buffer Gibco® PBS 1× pH 7.2 was purchased from Thermo Fisher Scientific Co. (Waltham MA). The compounds C9 [7‐hydroxy‐2‐(4‐methoxyphenylimino)−2H‐chromene‐3‐carboxylic acid benzylamide)]11 and C26 [3‐(4‐hydroxy‐2‐methoxyphenyl)acrylic acid 3‐(3‐hydroxyphenyl)propyl ester)]12 were synthesized as previously described. C12 (Tolrestat), C14 (Zopolrestat), and C17 (Fidarestat) were kindly donated by Dr. P.F. Kador (University of Nebraska Medical Center). C18 (bisdemethoxycurcumin) was obtained from Nagara Science Co. (Gifu, Japan). Other reagents were purchased from Wako Pure Chemical Industries (Osaka, Japan).
Preparation of recombinant enzymes
Recombinant AKR1A1 and AKR1B10 with the N‐terminal 6‐His tag10 were expressed in Escherichia coli cells harboring their cDNAs, and purified to homogeneity, as previously described.
Differential scanning fluorimetry
SYPRO Orange is an environmentally sensitive dye. The unfolding process exposes the hydrophobic region of proteins and results in a large increase in fluorescence, which is used to monitor the protein‐unfolding transition. DSF was performed using the Applied Biosystems® StepOnePlusTM Real‐Time PCR System [Thermo Fisher Scientific Co.], The SYBR green melting curve protocol was followed in each experiment to obtain the T m with this PCR system machine. Initially, the general procedure outlined by Nielsen et al. was followed.41
We tested six compounds (C9, C26, C18, C21, C12, and C14) for AKR superfamily proteins. C9 (0.8 mM) and the other compounds (1 mM) were dissolved in DMSO/methanol (1:9v/v) and in methanol, respectively. In a single well of a 96‐well PCR plate (Ultra Amp PCR plates; Sorenson, BioScience, Murray, UT), a 20‐μL reaction solution was placed in each well prepared by mixing 4 μL of protein solution, 4 μL of 20× SYPRO Orange (diluted from 5000× stock in DMSO), 0.5 μL of the compound, 10.5 μL of buffer solution (phosphate‐buffered saline, pH 7.2) and a 1 μL of NADP+ (24 μM) solution. The final concentrations of protein and compound in each well were 5 and 25 μM, respectively. DMSO/methanol or methanol was used as a background vehicle control at a final concentration of 2.5%–3.0%. Well plates were sealed with a qPCR adhesive seal sheet (4titude, Dorking, UK), centrifuged using a low‐speed Flexpin Bench‐top Centrifuge (TOMY‐LC‐220, TOMY, Japan) at 1000 rpm for 1 min to remove air bubbles, and then placed in the RT‐PCR instrument. DSF was performed from 25 to 95°C in increments of 1°C per minute. T m was determined using the software, StepOnePlus or Igor Pro V.6. DSF measurements were repeated at least three times.
1. CD measurements and analysis
The thermal stabilities of AKR1A1 and AKR1B10 in the absence or presence of various ligands (C12, C18, C21, C26, and NADP+) were investigated using near‐UV circular dichroism (CD). The concentrations of the proteins and the ligands used in the experiments were 5 and 25 µM, respectively. Buffers used for CD measurements were 50 mM sodium phosphate (pH 7) containing 150 mM NaCl, 1 mM 2‐mercaptoethanol, 0.5 mM EDTA, 4% glycerol, and various concentrations of urea (0–9 M). A 150‐µL fraction of each samples was placed in a quartz cell with the path length of 1 mm, and the ellipticity at 190–260 nm was recorded at 5°C using Chirascan‐Plus CDTM spectrometer (Applied Photophysics, Leatherhead, Surrey, UK). Then, the temperature was gradually increased up to 35°C with the rate of 1°C /min, and the change of the ellipticity at 222 nm was recorded every 2.5°C. The ellipticity as a function of urea concentration at the various temperatures was analyzed by assuming a two‐state or three‐state unfolding mechanism42 to derive the free‐energy difference between the native and unfolded states (ΔG UN). The ΔG UN versus T plot was subsequently analyzed by Gibbs–Helmholtz equation19, 20
| (2) |
where ΔH vf, ΔCp, and T m represent the van't Hoff enthalpy, isobaric heat capacity change upon the unfolding and melting temperature, respectively. Here, the T m value was fixed to the values obtained by DSF experiments (see above), and ΔH vf, ΔCp were determined by a least squares fitting. ΔH and ΔS at arbitrary temperature were calculated according to the following equations.
| (3) |
| (4) |
The CD measurements and analysis were also performed in the presence of various ligands, and ΔΔG, ΔΔH and ΔΔS were calculated by the following equations.
| (5) |
| (6) |
| (7) |
The subscripts free and ligand refer to the values in the absence or presence of a ligand, respectively. Of note, in order to simplify the fitting process, the m‐value and ΔCp were assumed to be not affected by the presence of ligand, as these two parameters are mainly determined from the change in the solvent‐accessible surface area upon unfolding (ΔSASA).43 Based on the crystal structure of AKR1B10 complex with the Tolrestat (C12) (PDB: 1ZUA), as well as an estimated solvent accessible surface area of the unfolded state,44 ΔSASA is calculated to be 40,775 and 41,526 Å2 in the absence and presence of the ligand, respectively, which are almost unchanged by the ligand binding.
Supporting information
Supporting Information
Supporting Information
Supporting Information
Acknowledgment
We thank Sachie Hori for providing technical help.
APPENDIX 1. THERMODYNAMIC THEORY ON THE CHANGE IN STABILITY OF THE NATIVE CONFORMATION UPON LIGAND BINDING
In a new system consisting of native state (N), intermediate or denatured state (I), and ligand (L), the following reaction occurs.
| (A1) |
Then, the free energy of stabilization (ΔΔG) upon ligand binding is calculated as follows:
| (A2) |
where [X]o and [X]L indicate the population of X without and with ligand, respectively. Here we considered [N]L and [NL]L to be within the native ensemble, and [I]L and [IL]L within the non‐native ensemble. Then we can further proceed as follows:
| (A3) |
Thus,
| (A4) |
If the free ligand never affects the free energy levels of the native and non‐native states, that is, it has no effect on the solvent structure, then
| (A5) |
which can be negative (stabilizer chaperone) or positive (destabilizer chaperone) depending on binding constants and also free ligand concentration.
Also we can formulate the melting temperature (T m) obtained by differential scanning fluorimetry (DSF).14 In the absence of ligand, for small changes in T m ( ),
| (A6) |
where ΔXD-N(T) = XD(T)−XN(T)
While in the presence of ligand, for small changes in T m ( ),
| (A7) |
If we define ΔΔS as follows:
| (A8) |
| (A9) |
| (A10) |
Thus,
| (A11) |
| (A12) |
| (A13) |
Finally, we can obtain the alteration of free energy upon ligand binding as follows:
| (A14) |
in which
Therefore, when ΔΔCP can be neglected, ΔΔG can be linearly dependent on the temperature with a slope of
| (A15) |
This additivity generally persists even in case of multiple ligand binding including allosteric effect.
Conflicts of interest
The authors have no conflict of interest directly relevant to the content of this article.
References
- 1. Kuwata K (2013) Logical design of medical chaperone for prion diseases. Curr Top Med Chem 13:2432–2440. [DOI] [PubMed] [Google Scholar]
- 2. Ma B, Yamaguchi K, Fukuoka M, Kuwata K (2016) Logical design of anti‐prion agents using NAGARA. Biochem Biophys Res Commun 469.4:930–935. [DOI] [PubMed] [Google Scholar]
- 3. Kamatari Y, Hayano Y, Yamaguchi K‐i, Hosokawa‐Muto J, Kuwata K (2012) Characterization of anti‐prion compounds according to the binding properties to the prion protein. Protein Sci 21:154–154. [DOI] [PMC free article] [PubMed] [Google Scholar]
- 4. Kuwata K, Nishida N, Matsumoto T, Kamatari YO, Hosokawa‐Muto J, Kodama K, Nakamura HK, Kimura K, Kawasaki M, Takakura Y, Shirabe S, Takata J, Kataoka Y, Katamine S (2007) Hot spots in prion protein for pathogenic conversion. Proc Natl Acad Sci USA 104:11921–11926. [DOI] [PMC free article] [PubMed] [Google Scholar]
- 5. Crosas B, Hyndman DJ, Gallego O, Martras S, Pares X, Flynn TG, Farres J (2003) Human aldose reductase and human small intestine aldose reductase are efficient retinal reductases: consequences for retinoid metabolism. Biochem J 373:973–979. [DOI] [PMC free article] [PubMed] [Google Scholar]
- 6. Ruiz FX, Gallego O, Ardevol A, Moro A, Dominguez M, Alvarez S, Alvarez R, de Lera AR, Rovira C, Fita I, Pares X, Farres J (2009) Aldo‐keto reductases from the AKR1B subfamily: retinoid specificity and control of cellular retinoic acid levels. Chem Biol Interact 178:171–177. [DOI] [PubMed] [Google Scholar]
- 7. Ma J, Yan R, Zu X, Cheng JM, Rao K, Liao DF, Cao D (2008) Aldo‐keto reductase family 1 B10 affects fatty acid synthesis by regulating the stability of acetyl‐CoA carboxylase‐alpha in breast cancer cells. J Biol Chem 283:3418–3423. [DOI] [PubMed] [Google Scholar]
- 8. Huang L, He R, Luo W, Zhu YS, Li J, Tan T, Zhang X, Hu Z, Luo D (2016) Aldo‐keto reductase family 1 member B10 inhibitors: Potential drugs for cancer treatment. Recent Pat Anticancer Drug Discov 11:184–196. [DOI] [PMC free article] [PubMed] [Google Scholar]
- 9. Wang C, Yan R, Luo D, Watabe K, Liao DF, Cao D (2009) Aldo‐keto reductase family 1 member B10 promotes cell survival by regulating lipid synthesis and eliminating carbonyls. J Biol Chem 284:26742–26748. [DOI] [PMC free article] [PubMed] [Google Scholar]
- 10. Endo S, Matsunaga T, Mamiya H, Ohta C, Soda M, Kitade Y, Tajima K, Zhao HT, El‐Kabbani O, Hara A (2009) Kinetic studies of AKR1B10, human aldose reductase‐like protein: endogenous substrates and inhibition by steroids. Arch Biochem Biophys 487:1–9. [DOI] [PubMed] [Google Scholar]
- 11. Endo S, Hu D, Suyama M, Matsunaga T, Sugimoto K, Matsuya Y, El‐Kabbani O, Kuwata K, Hara A, Kitade Y, Toyooka N (2013) Synthesis and structure‐activity relationship of 2‐phenyliminochromene derivatives as inhibitors for aldo‐keto reductase (AKR) 1B10. Bioorg Med Chem 21:6378–6384. [DOI] [PubMed] [Google Scholar]
- 12. Soda M, Hu D, Endo S, Takemura M, Li J, Wada R, Ifuku S, Zhao HT, El‐Kabbani O, Ohta S, Yamamura K, Toyooka N, Hara A, Matsunaga T (2012) Design, synthesis and evaluation of caffeic acid phenethyl ester‐based inhibitors targeting a selectivity pocket in the active site of human aldo‐keto reductase 1B10. Eur J Med Chem 48:321–329. [DOI] [PubMed] [Google Scholar]
- 13. Privalov PL, Gill SJ (1988) Stability of protein structure and hydrophobic interaction. Adv Prot Chem 39:191–234. [DOI] [PubMed] [Google Scholar]
- 14. Brandt T, Kaar JL, Fersht AR, Veprintsev DB (2012) Stability of p53 homologs. PloS One 7:e47889. [DOI] [PMC free article] [PubMed] [Google Scholar]
- 15. Kinoshita M (2008) Molecular origin of the hydrophobic effect: analysis using the angle‐dependent integral equation theory. J Chem Phys 128:024507. [DOI] [PubMed] [Google Scholar]
- 16. El‐Kabbani O, Green NC, Lin G, Carson M, Narayana SV, Moore KM, Flynn TG, DeLucas LJ (1994) Structures of human and porcine aldehyde reductase: an enzyme implicated in diabetic complications. Acta Cryst D50:859–868. [DOI] [PubMed] [Google Scholar]
- 17. Gallego O, Ruiz FX, Ardevol A, Dominguez M, Alvarez R, de Lera AR, Rovira C, Farres J, Fita I, Pares X (2007) Structural basis for the high all‐trans‐retinaldehyde reductase activity of the tumor marker AKR1B10. Proc Natl Acad Sci USA 104:20764–20769. [DOI] [PMC free article] [PubMed] [Google Scholar]
- 18. Santoro MM, Bolen DW (1992) A test of the linear extrapolation of unfolding free energy changes over an extended denaturant concentration range. Biochemistry 31:4901–4907. [DOI] [PubMed] [Google Scholar]
- 19. Pace CN, Laurents DV (1989) A new method for determining the heat capacity change for protein folding. Biochemistry 28:2520–2525. [DOI] [PubMed] [Google Scholar]
- 20. Talla‐Singh D, Stites WE (2008) Refinement of noncalorimetric determination of the change in heat capacity, DeltaC(p), of protein unfolding and validation across a wide temperature range. Proteins 71:1607–1616. [DOI] [PMC free article] [PubMed] [Google Scholar]
- 21. Koshland DE (1958) Application of a theory of enzyme specificity to protein synthesis. Proc Natl Acad Sci USA 44:98–104. [DOI] [PMC free article] [PubMed] [Google Scholar]
- 22. Brandts JF, Lin LN (1990) Study of strong to ultratight protein interactions using differential scanning calorimetry. Biochemistry 29:6927–6940. [DOI] [PubMed] [Google Scholar]
- 23. Murphy KP (2001) Stabilization of protein structure. Methods Mol Biol 168:1–16. [DOI] [PubMed] [Google Scholar]
- 24. Matulis D, Kranz JK, Salemme FR, Todd MJ (2005) Thermodynamic stability of carbonic anhydrase: measurements of binding affinity and stoichiometry using ThermoFluor. Biochemistry 44:5258–5266. [DOI] [PubMed] [Google Scholar]
- 25. Cimmperman P, Baranauskiene L, Jachimoviciute S, Jachno J, Torresan J, Michailoviene V, Matuliene J, Sereikaite J, Bumelis V, Matulis D (2008) A quantitative model of thermal stabilization and destabilization of proteins by ligands. Biophys J 95:3222–3231. [DOI] [PMC free article] [PubMed] [Google Scholar]
- 26. Dyson HJ, Wright PE (2004) Unfolded proteins and protein folding studied by NMR. Chem Rev 104:3607–3622. [DOI] [PubMed] [Google Scholar]
- 27. Hilser VJ, Thompson EB (2007) Intrinsic disorder as a mechanism to optimize allosteric coupling in proteins. Proc Natl Acad Sci USA 104:8311–8315. [DOI] [PMC free article] [PubMed] [Google Scholar]
- 28. Cohen FE, Kelly JW (2003) Therapeutic approaches to protein‐misfolding diseases. Nature 426:905–909. [DOI] [PubMed] [Google Scholar]
- 29. Monod J, Wyman J, Changeux JP (1965) On the nature of allosteric transitions: A plausible model. J Mol Biol 12:88–118. [DOI] [PubMed] [Google Scholar]
- 30. Koshland DE, Jr , Nemethy G, Filmer D (1966) Comparison of experimental binding data and theoretical models in proteins containing subunits. Biochemistry 5:365–385. [DOI] [PubMed] [Google Scholar]
- 31. Palmer AG 3rd (2015) Enzyme dynamics from NMR spectroscopy. Acc Chem Res 48:457–465. [DOI] [PMC free article] [PubMed] [Google Scholar]
- 32. Rea AM, Thurston V, Searle MS (2009) Mechanism of ligand‐induced folding of a natively unfolded helixless variant of rabbit I‐BABP. Biochemistry 48:7556–7564. [DOI] [PubMed] [Google Scholar]
- 33. Bohren KM, Bullock B, Wermuth B, Gabbay KH (1989) The aldo‐keto reductase superfamily. cDNAs and deduced amino acid sequences of human aldehyde and aldose reductases. J Biol Chem 264:9547–9551. [PubMed] [Google Scholar]
- 34. Cao D, Fan ST, Chung SS (1998) Identification and characterization of a novel human aldose reductase‐like gene. J Biol Chem 273:11429–11435. [DOI] [PubMed] [Google Scholar]
- 35. Cremers CM, Knoefler D, Vitvitsky V, Banerjee R, Jakob U (2014) Bile salts act as effective protein‐unfolding agents and instigators of disulfide stress in vivo. Proc Natl Acad Sci USA 111:E1610–E1619. [DOI] [PMC free article] [PubMed] [Google Scholar]
- 36. Gerbod MC, Janciauskiene S, Jeppsson JO, Eriksson S (1998) The in vitro effect of lithocholic acid on the polymerization properties of PiZ alpha‐1‐antitrypsin. Arch Biochem Biophys 351:167–174. [DOI] [PubMed] [Google Scholar]
- 37. Beach A, Richard VR, Bourque S, Boukh‐Viner T, Kyryakov P, Gomez‐Perez A, Arlia‐Ciommo A, Feldman R, Leonov A, Piano A, Svistkova V, Titorenko VI (2015) Lithocholic bile acid accumulated in yeast mitochondria orchestrates a development of an anti‐aging cellular pattern by causing age‐related changes in cellular proteome. Cell Cycle 14:1643–1656. [DOI] [PMC free article] [PubMed] [Google Scholar]
- 38. Andreotti G, Citro V, Correra A, Cubellis MV (2014) A thermodynamic assay to test pharmacological chaperones for Fabry disease. Biochim Biophys Acta 1840:1214–1224. [DOI] [PMC free article] [PubMed] [Google Scholar]
- 39. Siekierska A, De Baets G, Reumers J, Gallardo R, Rudyak S, Broersen K, Couceiro J, Van Durme J, Schymkowitz J, Rousseau F (2012) Alpha‐Galactosidase aggregation is a determinant of pharmacological chaperone efficacy on Fabry disease mutants. J Biol Chem 287:28386–28397. [DOI] [PMC free article] [PubMed] [Google Scholar]
- 40. Hosokawa‐Muto J, Kamatari YO, Nakamura HK, Kuwata K (2009) Variety of antiprion compounds discovered through an in silico screen based on cellular‐form prion protein structure: Correlation between antiprion activity and binding affinity. Antimicrob Agents Chemother 53:765–771. [DOI] [PMC free article] [PubMed] [Google Scholar]
- 41. Niesen FH, Berglund H, Vedadi M (2007) The use of differential scanning fluorimetry to detect ligand interactions that promote protein stability. Nat Protoc 2:2212–2221. [DOI] [PubMed] [Google Scholar]
- 42. Latypov RF, Cheng H, Roder NA, Zhang J, Roder H (2006) Structural characterization of an equilibrium unfolding intermediate in cytochrome c. J Mol Biol 357:1009–1025. [DOI] [PubMed] [Google Scholar]
- 43. Myers JK, Pace CN, Scholtz JM (1995) Denaturant m values and heat capacity changes: relation to changes in accessible surface areas of protein unfolding. Protein Sci 4:2138–2148. [DOI] [PMC free article] [PubMed] [Google Scholar]
- 44. Creamer TP, Srinivasan R, Rose GD (1995) Modeling unfolded states of peptides and proteins. Biochemistry 34:16245–16250. [DOI] [PubMed] [Google Scholar]
Associated Data
This section collects any data citations, data availability statements, or supplementary materials included in this article.
Supplementary Materials
Supporting Information
Supporting Information
Supporting Information