Abstract
Understanding light intensity and temperature increase is of considerable importance in designing or performing in vivo optogenetic experiments. Our study describes the optimal light power at target depth in the rodent brain that would maximize activation of light-gated ion channels while minimizing temperature increase. Monte Carlo (MC) simulations of light delivery were used to provide a guideline for suitable light power at a target depth. In addition, MC simulations with the Pennes bio-heat model using data obtained from measurements with a temperature-measuring cannula having 12.3 mV/°C of thermoelectric sensitivity enabled us to predict tissue heating of 0.116 °C/mW on average at target depth of 563 μm and specifically, a maximum mean plateau temperature increase of 0.25 °C/mW at 100 μm depth for 473 nm light. Our study will help to improve the design and performance of optogenetic experiments while avoiding potential over- and under-illumination.
OCIS codes: (170.3660) Light propagation in tissues, (170.5280) Photon migration, (170.7050) Turbid media, (350.5340) Photothermal effects
1. Introduction
Optogenetics, which combines optics with genetic engineering, permits cell-type-specific probing of neural circuits with millisecond precision [1]. During in vivo optogenetic experiments, light is typically delivered into the brain via an optical fiber inserted with stereotactic guidance, and intensity measured in mW/mm2 is the recommended notation for reporting light requirement because of its inherent simplicity in measuring total light power [2, 3]. The experimental requirement is for the intensity to be sufficiently powerful enough to achieve neural activation. Previous studies have revealed that the effective power density required for 50% of activation (EPD50) for wild-type Channelrhodopsin-2 (ChR2), which is the most commonly used light-gated excitatory cation channel, is 1.3 mW/mm2 [4]. Typically, to compensate for scattering loss, a 100-fold or higher intensity is used in vivo to illuminate neural cells located further away from the light source [2]. However, the intensity of light that can be safely applied in vivo is limited by the light-induced temperature changes that may adversely affect experimental results. For example, Christie et al. (2013) warned of false opto-fMRI (combinational study of fMRI with optogenetic tools) responses due to tissue heating despite the absence of optogenetic activation [5].
Yizhar et al. (2011) were the first to characterize temperature changes at a target region (500 μm away from the fiber tip) during fiber-optic neural stimulation (200 μm, 0.39 NA, 5 mW of instantaneous power; 0.5 mW of time-averaged power) by assuming zero conduction [2]. In their work, the absorption coefficient (0.1 mm−1) and stimulation time (30 s of 5 ms pulse at 20 Hz was considered to be equal to 3 s of constant illumination) were multiplied by local instantaneous intensity to predict absorbed heat energy at a specific target site, which was converted to a local temperature shift (~0.38 °C) at the target depth. However, such a direct and linear relationship between the stimulation time and temperature increase is not a reasonable approximation because significant heat spread and loss mechanisms, such as thermal conduction of pulses at tens of millisecond duration, must be taken into account [6]. Therefore, the zero conduction approximation can result in significant discrepancies between the actual and predicted temperatures [7]. For this reason, Stujenske et al. (2015) introduced the Pennes bio-heat model to describe heat diffusion in brain tissue and were the first to demonstrate the usefulness of a physiologically realistic model for predicting temperature changes induced by fiber-optic-based optogenetic neural stimulation [7].
Presumably, the most efficient way to reduce any potential for thermal artifacts is to avoid over-illumination by controlling the intensity, and this requires a detailed understanding of light delivery in the brain. Analytical diffusion theory [3, 8, 9], a well-established light scattering model in the field of tissue optics, was initially adopted for optogenetic applications because of the increasing need for precise light delivery to neural targets. However, earlier works related to diffusion theory precluded accurate estimates of light intensity for regions of close proximity (semi-diffusive) to the fiber [10]. For example, Stujenske et al. (2015) recently reported that light intensity around the fiber is not well-modeled by an exponential fit based on the diffusion theory [7], and our previous studies have revealed that the reasons for the discrepancy is an unrealistic fulfillment of the diffusion condition and the numerical aperture (NA) limit of the optical fiber (NA-limit) [10–12]. Moreover, the earlier works were limited in that they provided the longitudinal extent of the internal intensity that exceeded a certain threshold despite the three-dimensional (3D) nature of the problem. Hence, 3D open-source Monte Carlo (MC) simulators that are free of the diffusion approximation and NA-limit boundary conditions were recently developed for fiber-optic-based optogenetic stimulations to allow accurate modeling of light distribution in 3D space [7, 10, 13].
The first goal of our study was to provide a detailed 3D investigation of light intensity emitted from an optical fiber using an MC simulator developed by us [10] to help researchers select precise experimental conditions. Toward this goal, we evaluated the area of neural tissue activation (ATA) and the volume of neural tissue activation (VTA) by setting the threshold of the volumetric intensity and provided optimized fiber-to-target distances (OFD) that maximizes excitation of the light-sensitive proteins for various light power levels and fiber diameters.
A secondary goal was to measure and model tissue heating during fiber-optic optogenetic stimulation in vivo. Although several measurements were made because of the potential value of the light-induced temperature changes [5, 7], more data are needed under various experimental conditions to establish a guideline for the confounding problem of tissue heating in experimental designs. Moreover, previous measurements still have some limitations for identifying the exact local temperature at a target depth due to the inherent difficulty of measuring temperature within deep areas of the brain (i.e. measurement of the cortical surface only [5], direct heating of the thermistor by intense light [7], and difficulty of perfect anti-parallel alignment of the fiber with the thermistor probe in the opaque brain tissue – large craniotomy causing tissue damage throughout the entire frontal cortex is inevitable [7]).
For these reasons, we measured light-induced temperature changes during prolonged optogenetic stimulation with a custom-made temperature measuring cannula (novel cannula-type thermocouple) capable of measuring deep brain temperature at the fiber end while being minimally-invasive [14, 15]. Also, similar with the study by Stujenske et al. (2015) [7], the Pennes bio-heat model was applied to find the spatial extent of the local temperature and was compared with the measured temperature profiles [16]. The intensity and temperature were analyzed further to help design appropriate experimental conditions, including input light power, duty ratio, and corresponding OFD. Therefore, our study will provide researchers with an in-depth analysis of fiber-optic light delivery and light-induced temperature changes in the brain for precise in vivo optogenetic neural stimulation.
2. Methods
2.1 Characterization of the light spread below the fiber in the brain tissue
We calculated light distribution in the gray brain matter (GM) with the 3D MC simulator that was developed by our group for in vivo optogenetic use (available for download at http://optomc.er.ro; the homogeneous model was used) [10]. The scattering (μs), absorption (μa) coefficients of GM for the most commonly used wavelength (473, 532 and 593 nm) were chosen from the reported values in the literature, where the anisotropy (g) is assumed to equal 0.89 (see Table 1) [13, 17]. Note that these wavelengths closely match the peak activation wavelength of microbial opsins that could be used to control action potentials [2]. Light propagation from a fiber-coupled light source at the three wavelengths was simulated for different fiber output powers, diameters, and NA (4 – 20 mW; 100 – 400 μm; 0.22 – 0.48 NA). The simulation domain was confined to 4 × 4 × 2 mm3 with 10 × 10 μm2 resolution, and a total of 108 photons were used for all simulations.
Table 1. Used optical properties for MC simulations.
| Wavelength (nm) | μs (mm−1) | μa (mm−1) | g | Brain Region | Typical Opsins |
|---|---|---|---|---|---|
| 473 | 11.5 | 0.50 | 0.89 | GM | ChR2 |
| 532 | 10.5 | 0.25 | 0.89 | GM | C1V1 |
| 593 | 9.6 | 0.14 | 0.89 | GM | eNpHR3.0 |
The spatial distributions of light emitted from the fiber were omitted in this report because identical light distribution below the fiber can be obtained with several open-source 3D MC simulators [7, 10, 13] as long as similar tissue optical properties are concerned, and some results were already presented as a demonstration. Instead, we focused on a more detailed and systematic analysis of 3D light distribution to provide clear answers for the ATA and VTA that surpass the spiking threshold while considering the appropriate location of the fiber tip from the target area (i.e. OFD). It is important to understand that neural activation in optogenetics (appearing as spikes) is the accumulation of light-evoked photocurrents that result from the opening of a large number of transgenic opsin proteins expressed in neurons upon stimulation by light. Thus, the spatial extent of the light intensity over the spiking threshold is more important than the exact intensity level at a specific site. However, as far as we know, detailed analyses of these were only performed with the diffusion-based analytical models (improper scattering models in the semi-diffusive region) [8, 9]. Therefore, previously published results should be reexamined with a more precise 3D MC simulation adapted to optogenetic studies.
For these reasons, we longitudinally evaluated the ATA that exceeds a specified intensity threshold with the 3D light intensity. We defined the minimum, normal, and robust intensity thresholds for optogenetic photo-activation as 1.3 (ChR2-EPD50), 5, and 10 mW/mm2, respectively, after review of the literature, so that researchers can choose appropriate criteria depending on the microbial opsins of interest [1–4, 8, 18]. Note that intensity level of 5 mW/mm2 is typically effective and safe in vivo experimental conditions at target neurons [4], and this value is close to EPD50 for eNpHR3.0 (5.4 mW/mm2 at the peak activation wavelength of 590 nm [4]) that typically requires higher light power than ChR2. The numbers of super-threshold voxels are simply added and multiplied by the unit area of the voxel (10 × 10 μm2) to yield the depth-dependent ATA for given illumination conditions. Next, we established the OFD to maximize the ATA at a target depth for various light powers, fiber diameters, and threshold criterions to guide optimal experimental conditions. Lastly, the VTA versus increasing power and thresholding criteria were achieved by longitudinally integrating the ATA.
2.2 Measurement and modeling of light-induced temperature changes
This section describes (1) fabrication of the temperature-measuring cannula having a thermocouple fabricated on the end (Section 2.2.1), (2) procedures for measuring temperature changes in the brain tissue caused by light emission from an optical fiber (Section 2.2.2 to 2.2.3), and (3) computational methods for estimating temperature changes at various target depths with the addition of the Pennes bio-heat model to the result of MC simulation and the temperature measurement (Section 2.2.4). Details of the experimental and computational procedures are given in the following subsections.
2.2.1 Fiber coupled temperature measuring cannula
Temperature measurements within the brain tissue, upon fiber-optic light stimulation, were gathered with the custom-made temperature-measuring cannula (see Fig. 1(a)). Details of the manufacturing process and explanation of the temperature-measuring cannula are described in our patent application (US Patent 9028450 B2) [14] and previous work [15] with the only difference being the shape of the cannula. Here, the inclined surface of the syringe cannula was ground to have a flat face parallel to the fiber end face to access the temperature on the same plane while avoiding obstruction of light emission from the fiber.
Fig. 1.
Overview of the optical stimulation and temperature measuring devices. (a) Schematic drawing of the temperature measuring cannula. (b) Schematic of the overall experimental setup. (c) Rat with the experimental device.
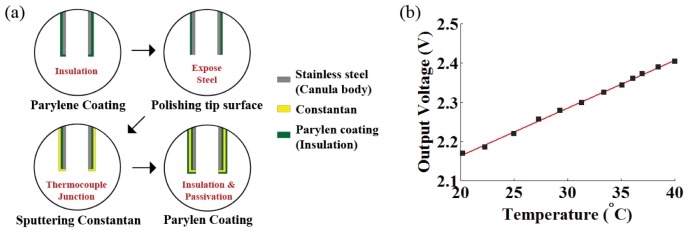
The following and Fig. 2(a) describe the manufacturing process of our temperature-measuring cannula. We deposited constantan (CuNi; Seebeck coefficient of 35.1 μV/°C) metal and parylene insulator on the cannula body (stainless steel; Seebeck coefficient of 4.4 μV/°C) to drive the thermo-electromotive force that is induced when two dissimilar metals are at different temperatures (Seebeck effect) [19]. The thermocouple junction of the two different metals was achieved with constantan and cannula body itself on the tip portion of the syringe cannula (J-type). First, parylene was used to coat the surface of a syringe cannula to form an insulating layer. Then, the rim of the syringe cannula tip was polished and Constantan was deposited to make a thermocouple junction. A final parylene coating was applied as a final step to reduce physical, chemical, and electrical damage. The thickness of the parylene and constantan coating was carefully controlled to be ~1.5 μm through vapor deposition and metal sputtering. Thermocouple was connected on the sequentially exposed metal pads with an electrically conductive epoxy.
Fig. 2.
(a) Manufacturing process of the temperature-measuring cannula. (b) Calibration of temperature measuring needle with precision thermometer using temperature-controlled water bath at various temperatures.
Thermal voltage-difference (Seebeck voltage) across the junction of the fabricated cannula (see Fig. 1(a)) was measured as 33.6 μV/°C with a nanovoltmeter (Keithley 2182A; Keithley Instruments, Cleveland, OH, USA) [15]. The electrical potential difference at the thermocouple junction of the cannula, corresponding to the temperature measured at the end rim of the cannula, was linearized, filtered, and amplified 370 times using an external amplifier before being stored in data form through an NI-DAQ board (NI USB-6353, National Instrument, USA).
Calibration was performed with a precision thermometer (F200, Automatic Systems Laboratories, UK; resolution 0.001 °C and accuracy ± 0.01 °C) to scale the amplified voltage output of the cannula to the actual temperature. Temperature-controlled water bath at various temperatures (20 – 40 °C, temperature controlled non-scattering and non-absorbing media that has similar thermal conductivity to brain) was prepared for the calibration. We adjusted the voltage output from the temperature-measuring cannula to the actual temperature acquired by the precision thermometer that was closely positioned to the end-rim of the temperature-measuring cannula in the water bath (fitted to a linear regression with R2 = 0.9982; see Fig. 2(b)). The accuracy of the temperature-measuring cannula is comparable to that of a standard J-type thermocouple (CuNi-Fe) because the same principle was applied. The fabricated temperature-measuring cannula produced 12.3 mV/°C with accuracy and precision of 0.1 °C and ± 0.03 °C, respectively [15]. We also confirmed that the problem of direct heating of the thermocouple by intense light could be minimized in our experiment by determining that measurements in the water bath were not affected by presence or absence of the stimulation light.
The optical fiber was inserted into the cannula tube, and the fiber end face was positioned as close as possible to the end rim of the cannula tip by observation with a microscope. The inner and outer diameters of the temperature-measuring cannula were 250 and 500 μm respectively, and the inserted optical fiber had 200 and 225 μm of core and cladding diameter, respectively (FT200EMT, Thorlabs, USA).
Although we attempted to measure accurately the local internal temperature at the end rim of the cannula tip, uncertainties associated with physical limitations of the equipment are still present and should be addressed. These sources of uncertainties include (1) slight ambiguity regarding the exact position of the optical fiber within the syringe cannula due to the small difference between cannula inner and fiber cladding diameters, and (2) the assumption of uniform sensitivity across the somewhat bulky temperature sensing area (250-500 μm diameters). Note that this outer diameter is identical to that of a thin cylindrical head thermistor (Wavelength Electronics, TCS10K5) used by Stujenske et al. (2015) for their work [7].
2.2.2 Surgical procedure
All procedures were performed by protocols approved by the Institutional Animal Care and Use Committee of Gwangju Institute of Science and Technology (GIST). Two male Sprague–Dawley rats (ChR2-expressing and normal rat, 300-500 g) were anaesthetized with 50% urethane in a saline solution (I.P. 1.5 g/kg). The operation was performed on a homeothermic device (ATC 1000, World Precision Instruments, USA) to maintain rectal temperature at 37.5 ± 1 °C. The head was positioned in a stereotaxic frame (Lab Standard Stereotaxic, Stoelting, USA). A midline incision was made on the scalp and a 1 mm diameter craniotomy was drilled to minimally expose the dura (Fig. 1(c)). The temperature-measuring cannula and the optical fiber were inserted stereotactically through the hole to reach the target coordinates (AP 2.04, ML −2.5, DV −1.5; primary motor cortex M1 area with bregma as reference [20]).
2.2.3 Measurement of the light-induced temperature changes
20 Hz pulsed optical stimulations were generated by a 473 nm laser (Shanghai Laser and Optics Century, China) under various light powers and duty ratio (30% and 50%, see Table 2). Each stimulation was repeated five times with cycles of 30 s on and 30 s off periods. Thus, each measurement was made over a time span of 5 minutes with 1 min of resting interval between the stimulation sessions; overall, the experimental period was 60 min for each rat. The measurement was first performed for the normal rat and then the ChR2-expressing rat, using the same temperature sensor. Note that containing the dark states (laser-off periods) between the pulsed illuminations is a frequently used strategy for prolonging optogenetic stimulation to allow for baseline recovery of temperature and photocurrent [4, 5].
Table 2. Laser parameters used for local temperature measurement and simulation.
| Instantaneous Power (mW) | Averaged Power (mW) | Frequency (Hz) | Duty Ratio (%) | Duration (ms) |
|---|---|---|---|---|
| 4 | 1.2 | 20 | 30 | 15 |
| 4 | 2 | 20 | 50 | 25 |
| 8 | 2.4 | 20 | 30 | 15 |
| 8 | 4 | 20 | 50 | 25 |
| 12 | 3.6 | 20 | 30 | 15 |
| 12 | 6 | 20 | 50 | 25 |
| 16 | 4.8 | 20 | 30 | 15 |
| 16 | 8 | 20 | 50 | 25 |
| 20 | 6 | 20 | 30 | 15 |
| 20 | 10 | 20 | 50 | 25 |
The fiber output powers were controlled to be 1.2 – 10 mW on average by chirping (30% and 50%) the different continuous (instantaneous) light powers between the range of 4–20 mW. The pulse duration and light power for each measurement were controlled automatically using the custom-built LabVIEW program. The spatio-temporal temperature variation of the brain tissue just below the fiber (end rim of the temperature measuring cannula) was measured and sequentially stored via NI-DAQ board (see Fig. 1(b)).
2.2.4 Estimation of the temperature changes at target depth
We simulated the spatio-temporal temperature changes of the brain tissue using the Pennes bio-heat model to estimate the temperatures at the distant target that is different from the measurement site mainly because of heat conduction [7]. We used bio-heat transfer module of commercial finite element method (FEM) software (COMSOL multi-physics, Comsol Ltd, UK), instead of developing a code for the heat spread [7] based on the Pennes bio-heat equation [16]:
| (1) |
The left-hand side of Eq. (1) is the rate of change of thermal energy stored in the tissue with density ρ and specific heat Cp. In the right-hand side of Eq. (1), , is related to the net conduction heat flux with the thermal conductivity k and the temperature of tissue T. Qopt is the added Joule heating by the optical stimulation, and Qbio (Penne’s bio-heat term) is the sum of blood perfusion Qb and metabolic heat generation Qm that is defined as [21]
| (2) |
where ρb is the blood density, ωb is the blood perfusion, Cb is the blood specific heat capacity, and Tb is the blood temperature.
The optical heat source Qopt was obtained from the light intensity distribution simulated with our MC model [10]. The intensity simulated for the various initial power was exported to the FEM software, and it was converted to absorbed Joule energy Qopt by multiplying the absorption coefficient of the brain tissues [2]. The pulse train over 30 seconds was modeled with a rectangular function depending on the frequency (20 Hz) and duty cycles (30% and 50%) of the laser output, and it was also multiplied to model the pulsed light stimulation. Thermal parameters used for the FEM simulation are summarized in Table 3 and the initial temperature was set to 36 °C for the entire domain [21–25]. Note that core diameter and NA of the fiber were set at 200 μm and 0.39 NA, respectively, for all temperature modeling cases (same as the experimental condition).
Table 3. Thermal parameters of the brain tissue.
| Thermal Parameter | Value | Units |
|---|---|---|
| Specific heat of the brain, Cp | 3680 | J/kg/K |
| Brain density, ρ | 1035.5 | kg·m−3 |
| Tmermal conductivity, k | 0.52 | W/m/K |
| Specific heat of the blood, Cb | 3600 | J/kg/K |
| Blood perfusion rate, ωb | 0.17467 | 1/s |
| Blood density, ρb | 1057 | kg·m−3 |
| Metabolic heat, Qm | 15575 | W/m3 |
3. Results and discussion
3.1 Characterization of the light spread below the fiber in the brain tissue
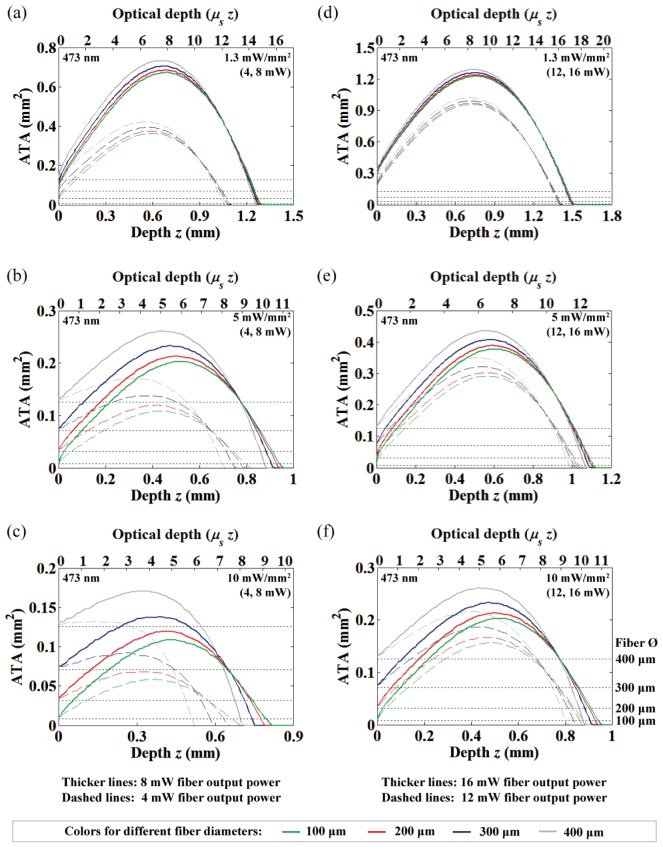
As described in Section 2.1, the ATA for varying distances of light at 473 nm were computed and displayed in Fig. 3 for three different intensity thresholds (10, 5, and 1.3 mW/mm2) under various fiber output powers (4, 8, 12 and 16 mW) and fiber diameters (100, 200, 300, and 400 μm). We observed that the NA-related difference in the ATA was so small for the same fiber diameter that the difference can be considered negligible (the graphs are almost overlapping); therefore, Fig. 3 shows only the data from the 0.39 NA. In fact, the change in the acceptance angle of the fiber for the different NA is only about 4-5 degrees (tissue refractive index n = 1.36), and these small changes can be easily obscured over one optical depth (1/μs = 87 μm at 473 nm) due to the high-scattering nature of brain tissue. Note that the dotted horizontal lines, in order from the bottom to the top, represent the area of the four fiber diameters (100, 200, 300, and 400 μm). Thus, the lines help to illustrate the spatial extent of the ATA along with depth relative to the fiber diameters.
Fig. 3.
The area of neural tissue activation (at 473 nm) along with depth from the fiber-end under different fiber output powers and diameters. 4 and 8 mW fiber output powers with (a) 1.3 mW/mm2, (b) 5 mW/mm2 and (c) 10 mW/mm2 threshold criterion. 12 and 16 mW fiber output powers with (d) 1.3 mW/mm2, (e) 5 mW/mm2 and (f) 10 mW/mm2 threshold criterion. For all graphs, the dashed and thick solid lines represent lower (4 and 12 mW) and higher (8 and 16 mW) powers, respectively. The dotted horizontal lines represent area of the four fiber diameters (100, 200, 300, and 400 μm; see Fig. 3(f)).
Increasing the fiber diameter increases the ATA near the fiber with slight reduction of the light penetration depth and very small shift of the ATA maxima (i.e. OFD) (Fig. 3). However, this tendency is not significant for the lower intensity criterion and high light output power. Also, the differences between the fiber diameters become reduced as the light propagates deeper. This means that both the NA and the fiber diameter are not prominent factors in practical in vivo optogenetic applications (where the adequate fiber diameter is generally less than 200 μm due to potential brain trauma), and thus the fiber output power has the greatest effect on the ATA and OFD. Specifically, a linear dependency between the fiber output power and the ATA at OFD were extracted from Fig. 3 (0.012, 0.022, and 0.072 mm2/mW for 10, 5, and 1.3 mW/mm2 criterion, respectively). This result is also consistent with the previous observation that fiber size does not dramatically affect the depth of effective opsin activation for strong light intensity [7], and our results confirm this in three-dimensions.
3.2 Effects of wavelength and introduction of optical depth
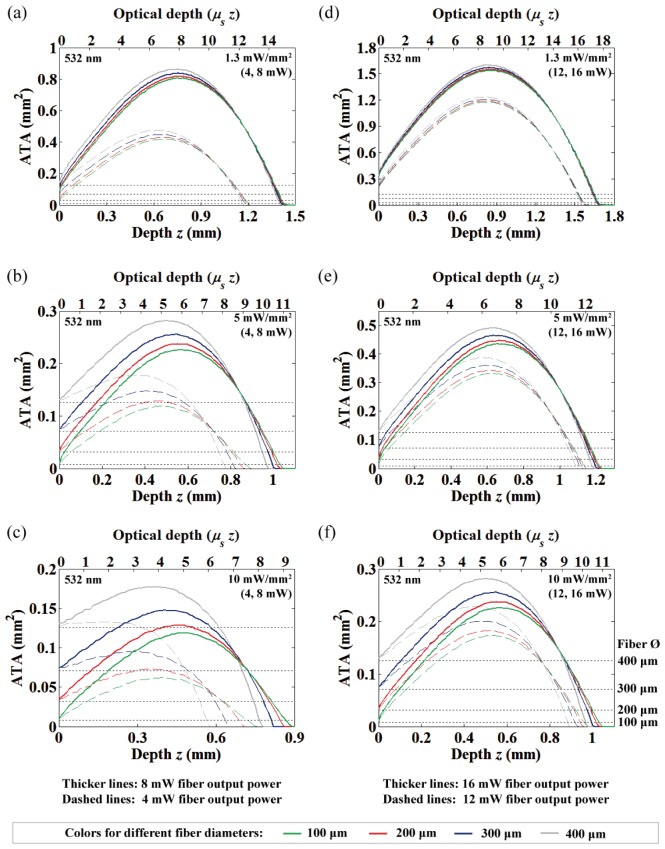
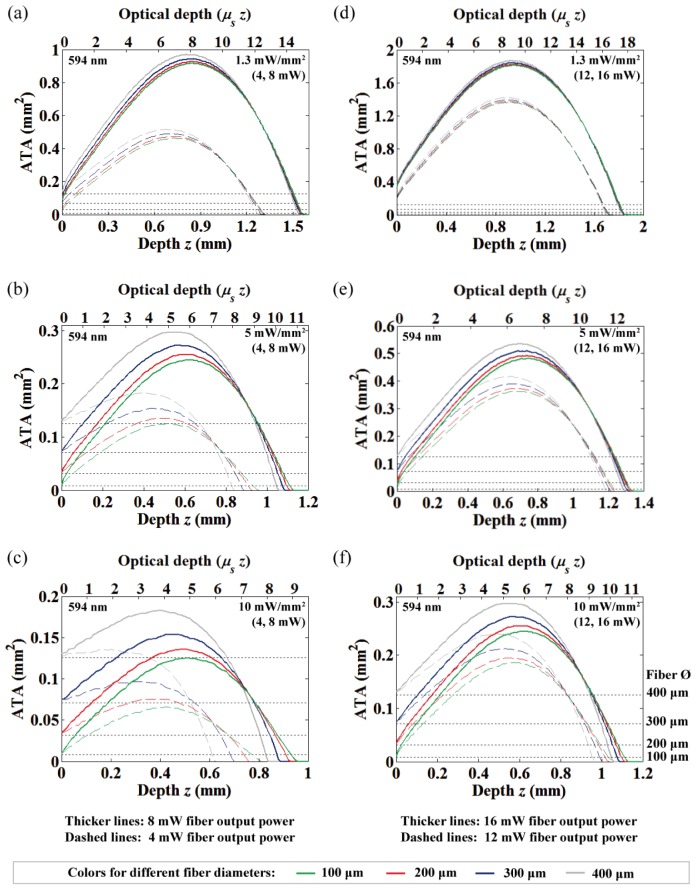
We characterized the wavelength dependence of the ATA to cover various opsins that have different activation wavelengths (Fig. 4(a)). We also introduced an optical depth (μs z) to normalize the depth of the ATA to the average distance between scattering events (see Fig. 4(b)) [26]. As shown in Fig. 4(a), it is well known that light of longer-wavelengths is less scattering and penetrates deeper into the brain tissue. However, interestingly, normalizing the geometric depth to the optical depth effectively compresses the ATA in an axial direction (which reflects the 3D light spread in 2D), and thus moves the ATA maxima (OFD) and the maximum penetration depth to be nearly equal for the different wavelengths. Therefore, this simple depth normalization provides wavelength-independent insight of 3D light distribution from the fiber in one-dimension, and significantly reduces the necessity for time-consuming MC simulation for various wavelengths. The ATA in geometrical depth for the different wavelengths (532 and 594 nm) of various light power and criteria are displayed in the Appendix (Figs. 13 and 14).
Fig. 4.
The ATA for varying wavelength with different depth scale. (a) The ATA represented with usual geometrical depth. (b) The ATA normalized to optical depth.
3.3 Optimized fiber-to-target distances and volume of tissue activation
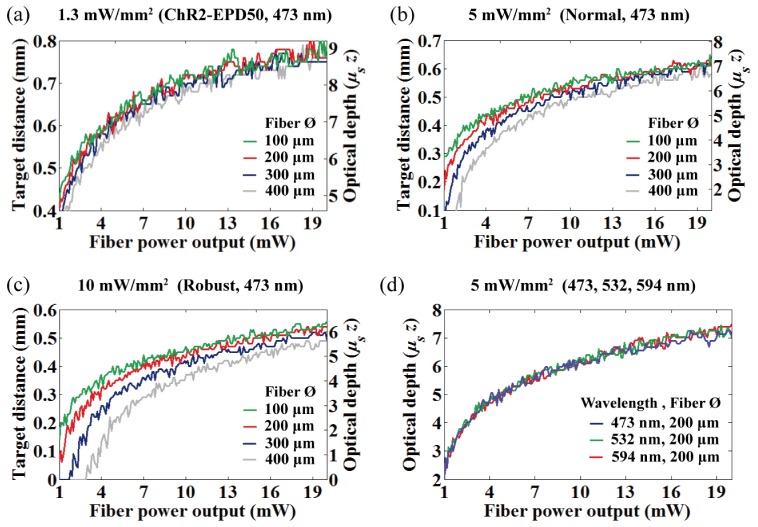
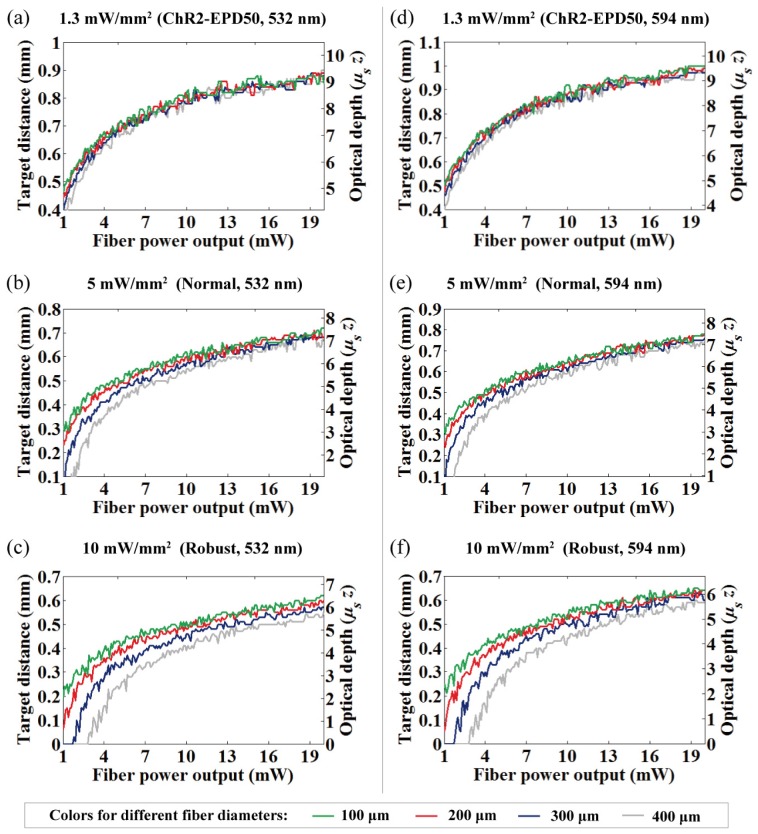
It is important to understand the OFD because it allows the use of lower light power to activate a desired volume of tissue, and it may result in reduced heat build-up that is proportional to light power. Figures 5(a) to 5(c) show the OFD at 473 nm as a function of power increases (1–20 mW, simulated with 0.1 mW step) for four different fiber diameters with three intensity criterions. The geometric and the optical depth were represented together on the same graph for comparison. The OFD for the different wavelengths that normalized to the optical depth are represented in Fig. 5(d), and non-normalized OFD at 532 and 594 nm for different light power and criteria were also provided in the Appendix (Fig. 15).
Fig. 5.
Fiber output power vs. OFD at 473 nm for (a) 1.3 mW/mm2, (b) 5 mW/mm2, and (c) 10 mW/mm2 intensity criteria. (d) Fiber output power vs. normalized OFD at the different wavelengths (473, 532, and 594 nm).
The simulated results show that the OFD for general in vivo experiments resides in the semi-diffusive regime of less than ~9 optical depth (fiber-to-target distance less than the transport mean free path, MFPt = (1/μs)/(1−g) = 790, 870 and 950 μm for 473, 532 and 594 nm, respectively, with the coefficients listed in Table 1). This implies that previous reports of the OFD based on the diffusion theory would result in prediction errors because the condition is always unsatisfied [8, 9].
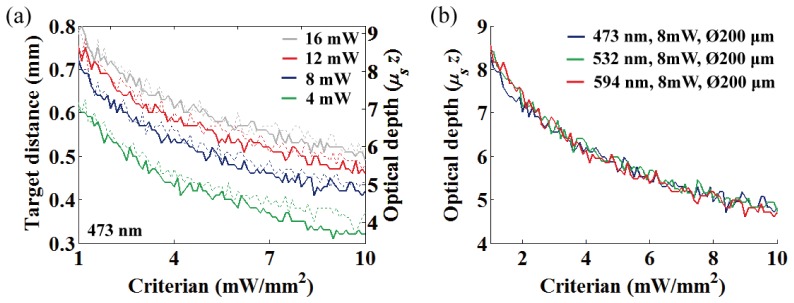
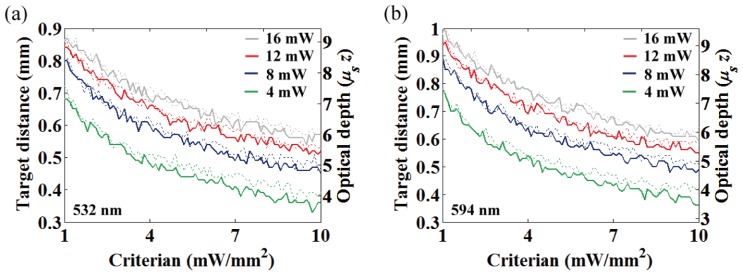
The OFD at 473 nm for varying criterion are summarized in Fig. 6 for various light power (4, 8, 12, 16 mW) and two fiber diameters (100 and 200 μm). Figure 6 shows decrease of the OFD as a function of the thresholding criterion, and it reveals that the OFD differences among the difference in fiber diameters were widened as the criterion increased (see also Figs. 5(a) to 5(c)). Figures 5(d) and 6(b) are the OFD normalized to optical depth for the different wavelengths, and the overlaid plots clearly show identical normalized OFD regardless of its wavelength. Therefore, it is important to reemphasize that rescaling the normalized OFD by dividing it by the scattering coefficient μs allows access to the geometric OFD of any wavelength.
Fig. 6.
Intensity criterion vs. OFD at 473 nm for the four different fiber output powers (4, 8, 12 and 16 mW). Dotted and thick solid lines represent 100 and 200 μm fiber diameters, respectively. (b) Intensity criterion vs. normalized OFD at the different wavelengths (473, 532, and 594 nm).
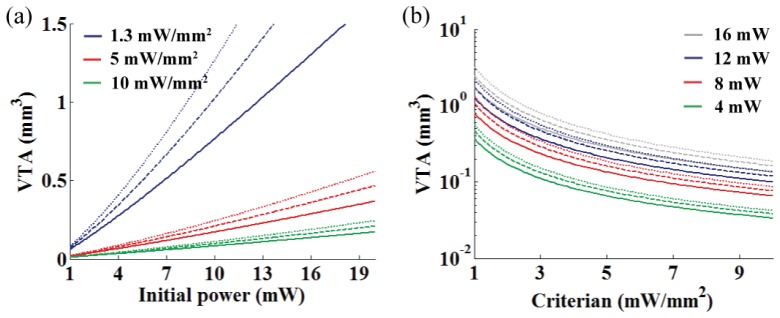
Lastly, we examined the VTA from various light power (Fig. 7(a)) and threshold criterion (Fig. 7(b)) with the three wavelengths by axially integrating the ATA. The solid, dashed, and dotted lines of Fig. 7 are for 473, 532, and 594 nm, respectively. The results show a roughly linear relationship between light power and VTA over 4 mW of the fiber output power (a commonly used power setting), and exponential decay of the VTA for the increasing intensity criterion was observed. Also, the VTA increased with increasing wavelength resulting in better light penetration in the brain tissue.
Fig. 7.
Characterization of the VTA at the different wavelengths. (a) VTA vs. optical power for the three different intensity threshold criterions (10, 5 and 1.3 mW/mm2). (b) VTA vs. intensity criterion for the four different fiber output powers (4, 8, 12 and 16 mW). The solid, dashed, and dotted lines represents the VTA at 473, 532, and 594 nm, respectively.
3.4 Light power dependence of the temperature changes
We examined the measured and estimated temperature changes at the end rim of the cannula when illuminated with 473 nm light. 473 nm light has greater absorption by hemoglobin (higher absorption coefficient μa) than light at longer wavelengths [13, 17] and, therefore, requires more attention for suppressing unwanted temperature increases in vivo. Thus, our analysis will focus more on light-induced temperatures for 473 nm light, and the results for different wavelengths (532 and 594 nm) are provided in the Appendix (Figs. 16, 17, 18, 19, and 20). As far as temperature changes upon optical stimulation from fibers are concerned, there is no measured data at this wavelength and therefore presenting these data will be valuable. Note that measurements made available by Christie et al. (2013) and Stujenske et al. (2015) were performed with 445 and 532 nm light, respectively, while Stujenske et al. (2015) also reported modeled temperatures for different wavelengths [5, 7].
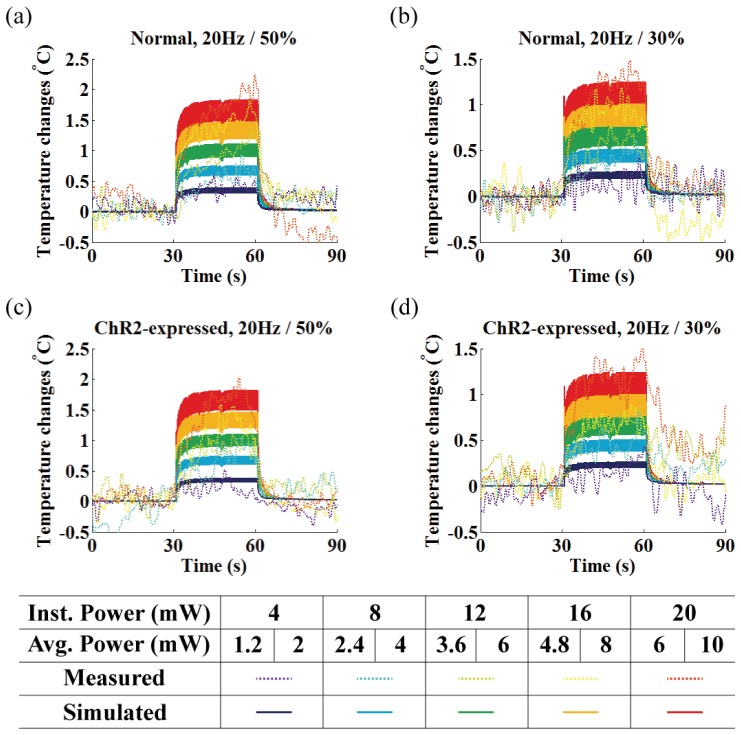
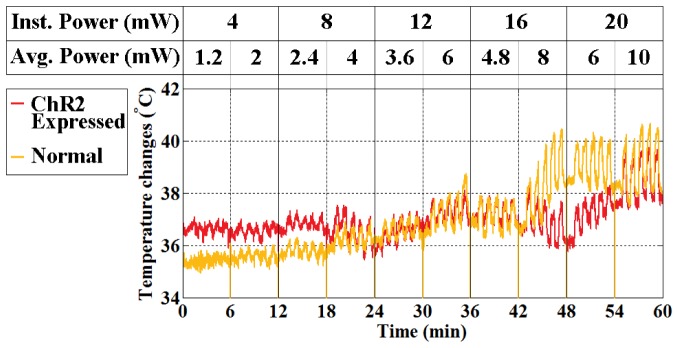
The measured (dotted lines) and estimated (dark solid lines) temperature changes at the measurement site for the first 30 seconds of stimulation under ten different conditions are shown in Fig. 8 (see also Table 2). We considered only the first minute (30s on/30s off, see Fig. 8) of the measurements for comparison because the patterns of temperature changes repeat with slow baseline fluctuations. Thus, the slow baseline fluctuation was to be regarded as independent of optical stimulation (i.e. normal physiological variation due to long experimental time). The actual measurements (not relative) for the whole experimental period were also plotted in Fig. 9 (raw data).
Fig. 8.
Local temperature measurement (dotted lines) and simulation (solid lines) at the end rim of the cannula under the 30s of photo-stimulation of 473 nm light (30s on / 30s off) for (a-b) normal and (c-d) ChR2 expressed rat. Each color represents different instantaneous light power used in the range of 4 to 20 mW. The corresponding average power for each duty ratio (30% / 50%) is shown below the instantaneous laser power and in Table 2.
Fig. 9.
Local temperature measurement over the course of the experiment under optical stimulation. The stimulation condition for each experimental sequence is indicated on the graph and in Table 2.
The results in Fig. 8 show a slight rise in temperature for the normal rat compared to the ChR2-expressing rat, but this may be due to the difficulty in maintaining the same experimental environment between two rats (i.e. difficulty in maintaining the same brain and body core temperature, surgical wounds and tissue damage, overall time in surgery, and physiological responses), rather than expression of the ChR2 transgene. This can be explained by the fact that heat conduction, inherent material characteristics governed by the thermal conductivity k, is the major contributor to tissue temperature increases induced by optical stimulation [6, 7]. Thus, even though expression of opsin transgene in neurons may be able to alter the Pennes bio-heat term (Qbio, see Eqs. (1) and (2)), it has a negligible effect on temperature increases. Thus, we conclude that opsin expression is a minor contributor to local temperature increases of the brain tissue while fiber output power is the most significant source of temperature variations.
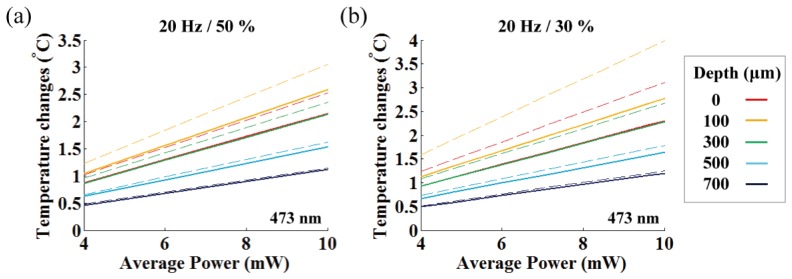
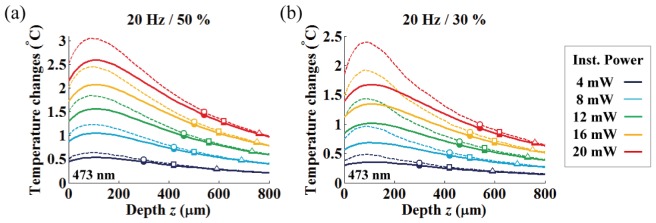
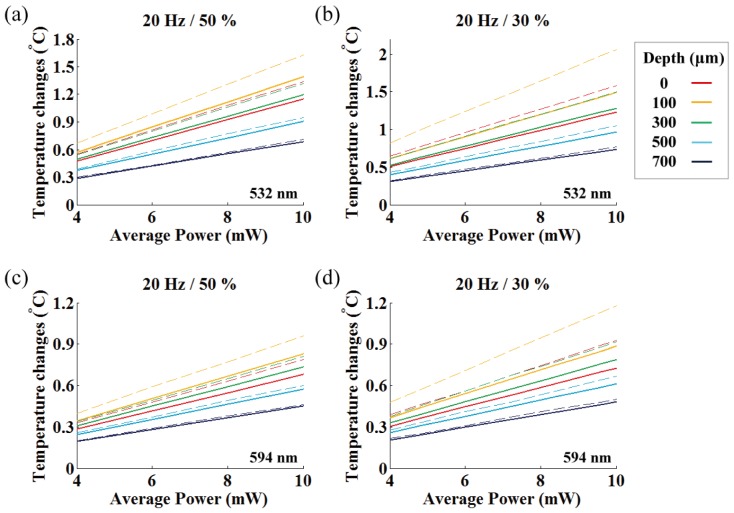
To account for the spatio-temporal heat spread that leads to temperature differences between the measurement site and the target depth, we investigated depth-dependent temperature changes (on-axis) with the Pennes bio-heat model (see Section 2.2.4) for the various fiber output powers. In Fig. 10, we plotted the plateau temperatures at different depths after 30 seconds of photostimulation for the various averaged powers and pulse durations. Because pulsed stimulation leads to rapid oscillation of the plateau temperatures, we prepared two graphs with one indicating mean plateau temperature (solid lines) and the other indicating peak plateau temperature (dashed lines).
Fig. 10.
Graph indicating the linear relationship between the averaged light power and temperature changes for different depths. Average fiber output power vs. plateau temperature changes at 473 nm light for (a) 50% duty cycles, (b) 30% duty cycles, respectively. Solid and dashed lines represent the mean and peak plateau temperatures, respectively.
When considering the mean plateau temperature, the temperature increase was proportional to the averaged fiber output power (maximum slope is 0.25 °C/mW at 100 μm depth, see yellow solid line in Fig. 10(a)) except for a slight reduction in the local temperature changes for the relatively longer-pulsed stimulation (50% duty ratio) owing to the small increase in thermal penetration depth [6]. This result is in agreement with observations by other investigators that time-averaged fiber output power and temperature rise have a linear relationship [5, 7]. However, our experiments show that temporal oscillation of the plateau temperature strongly deviates from the peak plateau temperature for the equivalent averaged power outputs between the relatively longer (50%, 0.3 °C/mW) and shorter (30%, 0.4 °C/mW) pulses (Fig. 10). This discrepancy was greater closer to the fiber end, and lower at larger depths due to heat diffusion. Thus, as Stujenske et al. (2015) proposed, pulsing the light could be an effective strategy for reducing mean plateau temperature or peak temperature at a target depth [7]. However, it is important to note that this strategy is limited to target depths located away from the fiber end (over 300 μm) and it is not enough to reduce the maximum peak temperature close to the fiber end (at round 100 μm depth). Also, while our estimate of the maximum mean plateau temperature is close to the simulation by Stujenske et al. (0.27 °C/mW at 473 nm) [7], ours and the previous estimates for 473 nm light is only about 60% of the expected temperature changes for 445 nm light (0.42 °C/mW) measured by Cristie et al. [5]. This suggests that although ChR2 has a broad activation spectrum (400 – 500 nm with activation peak at 470 nm), wavelengths within the hemoglobin absorption peak (400 – 450 nm [17]) need to be avoided whenever possible owing to substantial light absorption that is converted to heat.
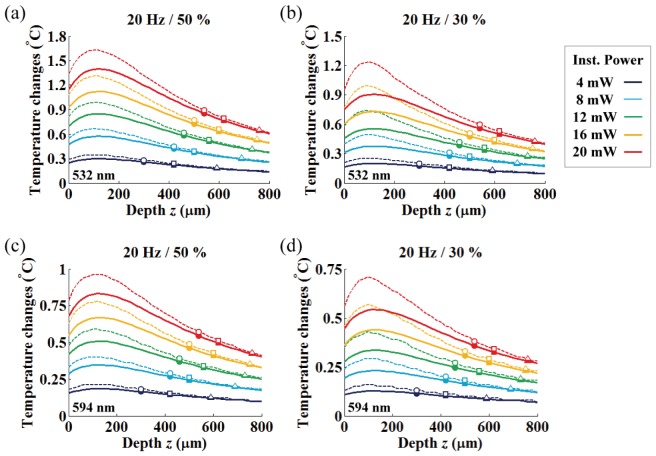
In Fig. 11, we studied the mean (solid lines) and peak (dashed lines) plateau temperatures along with depth for various light powers (instantaneous and average light powers in the range of 4 – 20 mW with 4 mW step and 1.2 – 10 mW, respectively). Also, we marked the OFD and the corresponding temperature increases for three different criteria to allow the experimenter to easily identity suitable experimental conditions (round, square and triangle markers indicate the OFD for the threshold criteria of 10, 5 and 1.3 mW/mm2, respectively).
Fig. 11.
Axial temperature variation under various fiber output powers. Each color represents different instantaneous light power used in the range of 4 to 20 mW. Solid and dashed lines represent mean and peak plateau temperature changes, respectively, and the corresponding average power for each duty ratio ((a) 50% / (b) 30%) is shown in Table 2. The round, square and triangle symbols indicate the simulated temperature at the optimized target depth with 10, 5 and 1.3 mW/mm2 threshold criterions, respectively.
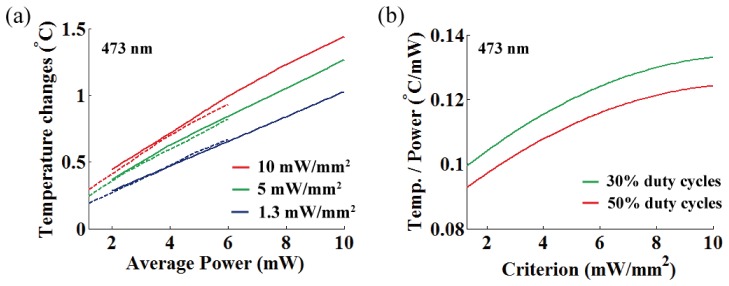
In Fig. 12, we represented the temperature increase per averaged power at OFD for various threshold criteria, and linear relationship in the ranging from 0.093 °C/mW to 0.133 °C/mW was observed for 473 nm light (mean = 0.116 °C/mW at target depth of 563 μm, standard deviation σ = 0.0105).
Fig. 12.
(a) Temperature increase per averaged power at OFD for three different intensity thresholds (473 nm; 10, 5, and 1.3 mW/mm2). Dashed and solid lines represent 30% and 50% duty cycles, respectively. (b) A rate of temperature changes per averaged power at OFD as a function of the threshold criterion for different duty cycles (30% and 50%).
The general trend we observed are as follows: (1) the discrepancy between the peak and mean plateau temperatures decreases with increasing depth and becomes negligible at the OFD, (2) both the OFD and corresponding temperature increased as the input power was increased, (3) the OFD increased for the lower intensity criterion with a corresponding temperature decrease, (4) the axial temperature close to the fiber end increases up to a tissue depth of around 100 μm for all light power levels, and becomes gradually reduced along with depth after the temperature maxima, (5) tissue temperature at roughly 300 μm in depth is similar to that of the fiber end face (on-axis).
These results indicate that high-temperature regions (where the on-axis temperature is above the temperature of the fiber-end (z = 0); fiber-to-target depth less than 300 μm) must be avoided for use as a neuromodulation target if at all possible to circumvent potential thermal damage and artefacts. Also, it is beneficial to position the fiber as far as possible from the local target. At the same time, the target distance should allow for sufficient light intensity to surpass a certain threshold for the photo-activation. As a consequence, these conditions must be balanced for an optimal experimental design. Fortunately, the OFDs we reported are located mostly far enough from the high-temperature region while allowing for maximal light-gated channel activation. In this case, the OFD can be used to spatially separate the potential neuromodulation target as far as possible from the high-temperature regions.
4. Conclusion
Optimizing light intensity and target distance for in vivo optogenetic experiments is critical for minimizing unwanted heating of tissues yet is often overlooked when designing experiments. Here, we describe a model of light and heat propagation during optogenetic experiments. The ATA, VTA, and OFD that maximizes activation of light-gated ion channels for combinations of various light power levels and fiber diameters were obtained from MC simulations. This was used to demonstrate the linear dependency between fiber output power and ATA at OFD (0.012, 0.022, and 0.072 mm2/mW at wavelength of 473 nm for 10, 5, and 1.3 mW/mm2 criteria, respectively). Furthermore, introducing optical depth allows wavelength-independent measurement of the ATA and OFD, which contribute to reduced computational costs. We also reported the invention and use of a temperature-measuring cannula with a thermocouple fabricated on the end, allowing real-time measurement of temperature changes caused by light emission from optical fibers. We calculated the expected temperature at OFD with the addition of the Pennes bio-heat model using data from a temperature-measuring cannula having 12.3 mV/°C of thermoelectric sensitivity, and we estimated suitable fiber output power and OFD with expected temperature increases (0.116 °C/mW on average at target depth of 563 μm in general and specifically, a maximum mean plateau temperature increase of 0.25 °C/mW at 100 μm depth for 473 nm light). We believe that the data presented here will serve as a useful reference for selecting optical parameters to regulate light intensity and temperature changes in a targeted area of the brain.
Acknowledgments
The authors thank Heejin Park and Donghyeon Kim at GIST for helpful discussions regarding the FEM temperature modeling. We also thank Professors Ellis Lee and Michel Ye at GIST for carefully proofreading the manuscript.
Appendix.
Fig. 13.
The area of neural tissue activation (at 532 nm) along with depth from the fiber-end under different fiber output powers and diameters. 4 and 8 mW fiber output powers with (a) 1.3 mW/mm2, (b) 5 mW/mm2 and (c) 10 mW/mm2 threshold criterion. 12 and 16 mW fiber output powers with (d) 1.3 mW/mm2, (e) 5 mW/mm2 and (f) 10 mW/mm2 threshold criterion.
Fig. 14.
The area of neural tissue activation (at 594 nm) along with depth from the fiber-end under different fiber output powers and diameters. 4 and 8 mW fiber output powers with (a) 1.3 mW/mm2, (b) 5 mW/mm2 and (c) 10 mW/mm2 threshold criterion. 12 and 16 mW fiber output powers with (d) 1.3 mW/mm2, (e) 5 mW/mm2 and (f) 10 mW/mm2 threshold criterion.
Fig. 15.
Fiber output power vs. OFD at 532 nm for (a) 1.3 mW/mm2, (b) 5 mW/mm2, and (c) 10 mW/mm2 intensity criteria, and the identical data at 594 nm for (d) 1.3 mW/mm2, (e) 5 mW/mm2, and (f) 10 mW/mm2 intensity criteria.
Fig. 16.
(a) Intensity criterion vs. OFD at (a) 532 and (b) 594 nm for the four different fiber output powers (4, 8, 12 and 16 mW). Dotted and thick solid lines represent 100 and 200 μm fiber diameters, respectively.
Fig. 17.
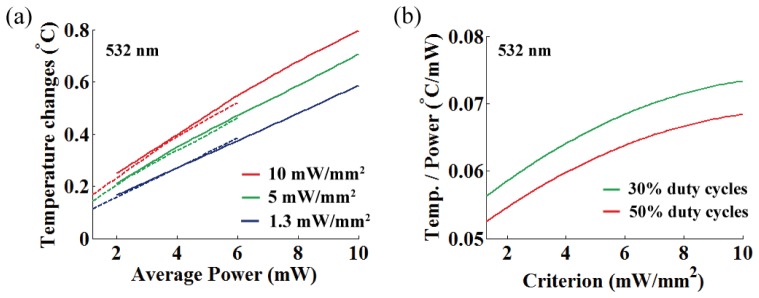
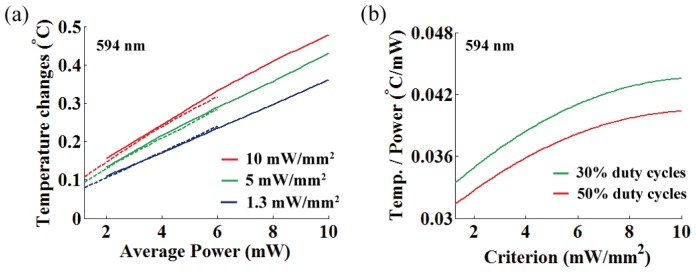
Average fiber output power vs. plateau temperature changes for (a) 50% duty cycles at 532 nm, (b) 30% duty cycles at 532 nm, (c) 50% duty cycles at 594 nm, and (d) 30% duty cycles at 594 nm. Solid and dashed lines represent the mean and peak plateau temperatures, respectively.
Fig. 18.
Axial temperature variation under various fiber output powers for stimulation light of (a) 50% duty cycles at 532 nm, (b) 30% duty cycles at 532 nm, (c) 50% duty cycles at 594 nm, and (d) 30% duty cycles at 594 nm. Each color represents different instantaneous light power used in the range of 4 to 20 mW. Solid and dashed lines represent mean and peak plateau temperature changes, respectively. The round, square and triangle symbols indicate the simulated temperature at the optimized target depth with 10, 5 and 1.3 mW/mm2 threshold criterions, respectively.
Fig. 19.
(a) Temperature increase per averaged power at OFD for three different intensity thresholds (532 nm; 10, 5, and 1.3 mW/mm2). Dashed and solid lines represent 30% and 50% duty cycles, respectively. (b) A rate of temperature changes per averaged power at OFD as a function of the threshold criterion for different duty cycles (30% and 50%). The temperature change at OFD for 549 nm light are in the ranging from 0.0526 °C/mW to 0.0733 °C/mW (mean = 0.064 °C/mW, standard deviation σ = 0.0054).
Fig. 20.
(a) Temperature increase per averaged power at OFD for three different intensity thresholds (594 nm; 10, 5, and 1.3 mW/mm2). Dashed and solid lines represent 30% and 50% duty cycles, respectively. (b) A rate of temperature changes per averaged power at OFD as a function of the threshold criterion for different duty cycles (30% and 50%). The temperature change at OFD for 549 nm light are in the ranging from 0.0314 °C/mW to 0.0435 °C/mW (mean = 0.038 °C/mW, standard deviation σ = 0.0032).
Funding
This work was supported in part by the New Growth Engine Industry Project of the Ministry of Knowledge and Economy (No.10047579), National Research Foundation of Korea (NRF) grant funded by the Korea government (MSIP) (No. 2015R1A2A2A03005382), and the GIST Research Institute (GRI) in 2016.
References and links
- 1.Boyden E. S., Zhang F., Bamberg E., Nagel G., Deisseroth K., “Millisecond-timescale, genetically targeted optical control of neural activity,” Nat. Neurosci. 8(9), 1263–1268 (2005). 10.1038/nn1525 [DOI] [PubMed] [Google Scholar]
- 2.Yizhar O., Fenno L. E., Davidson T. J., Mogri M., Deisseroth K., “Optogenetics in neural systems,” Neuron 71(1), 9–34 (2011). 10.1016/j.neuron.2011.06.004 [DOI] [PubMed] [Google Scholar]
- 3.Aravanis A. M., Wang L.-P., Zhang F., Meltzer L. A., Mogri M. Z., Schneider M. B., Deisseroth K., “An optical neural interface: in vivo control of rodent motor cortex with integrated fiberoptic and optogenetic technology,” J. Neural Eng. 4(3), S143–S156 (2007). 10.1088/1741-2560/4/3/S02 [DOI] [PubMed] [Google Scholar]
- 4.Mattis J., Tye K. M., Ferenczi E. A., Ramakrishnan C., O’Shea D. J., Prakash R., Gunaydin L. A., Hyun M., Fenno L. E., Gradinaru V., Yizhar O., Deisseroth K., “Principles for applying optogenetic tools derived from direct comparative analysis of microbial opsins,” Nat. Methods 9(2), 159–172 (2011). 10.1038/nmeth.1808 [DOI] [PMC free article] [PubMed] [Google Scholar]
- 5.Christie I. N., Wells J. A., Southern P., Marina N., Kasparov S., Gourine A. V., Lythgoe M. F., “fMRI response to blue light delivery in the naïve brain: implications for combined optogenetic fMRI studies,” Neuroimage 66, 634–641 (2013). 10.1016/j.neuroimage.2012.10.074 [DOI] [PubMed] [Google Scholar]
- 6.Thompson A. C., Wade S. A., Cadusch P. J., Brown W. G., Stoddart P. R., “Modeling of the temporal effects of heating during infrared neural stimulation,” J. Biomed. Opt. 18(3), 035004 (2013). 10.1117/1.JBO.18.3.035004 [DOI] [PubMed] [Google Scholar]
- 7.Stujenske J. M., Spellman T., Gordon J. A., “Modeling the spatiotemporal dynamics of light and heat propagation for in vivo optogenetics,” Cell Reports 12(3), 525–534 (2015). 10.1016/j.celrep.2015.06.036 [DOI] [PMC free article] [PubMed] [Google Scholar]
- 8.Al-Juboori S. I., Dondzillo A., Stubblefield E. A., Felsen G., Lei T. C., Klug A., “Light scattering properties vary across different regions of the adult mouse brain,” PLoS One 8(7), e67626 (2013). 10.1371/journal.pone.0067626 [DOI] [PMC free article] [PubMed] [Google Scholar]
- 9.Foutz T. J., Arlow R. L., McIntyre C. C., “Theoretical principles underlying optical stimulation of a channelrhodopsin-2 positive pyramidal neuron,” J. Neurophysiol. 107(12), 3235–3245 (2012). 10.1152/jn.00501.2011 [DOI] [PMC free article] [PubMed] [Google Scholar]
- 10.Shin Y., Kwon H.-S., “Mesh-based Monte Carlo method for fibre-optic optogenetic neural stimulation with direct photon flux recording strategy,” Phys. Med. Biol. 61(6), 2265–2282 (2016). 10.1088/0031-9155/61/6/2265 [DOI] [PubMed] [Google Scholar]
- 11.Ryu Y., Shin Y., Lee D., Altarejos J. Y., Chung E., Kwon H.-S., “Lensed fiber-optic probe design for efficient photon collection in scattering media,” Biomed. Opt. Express 6(1), 191–210 (2015). 10.1364/BOE.6.000191 [DOI] [PMC free article] [PubMed] [Google Scholar]
- 12.Engelbrecht C. J., Göbel W., Helmchen F., “Enhanced fluorescence signal in nonlinear microscopy through supplementary fiber-optic light collection,” Opt. Express 17(8), 6421–6435 (2009). 10.1364/OE.17.006421 [DOI] [PubMed] [Google Scholar]
- 13.Liu Y., Jacques S. L., Azimipour M., Rogers J. D., Pashaie R., Eliceiri K. W., “OptogenSIM: a 3D Monte Carlo simulation platform for light delivery design in optogenetics,” Biomed. Opt. Express 6(12), 4859–4870 (2015). 10.1364/BOE.6.004859 [DOI] [PMC free article] [PubMed] [Google Scholar]
- 14.S.-K. Lee, S.-k. Nam, and H.-I. Kim, “Syringe capable of measuring temperature of a patient body and method of manufacturing the same,” US Patent 9028450 B2 (2015).
- 15.Nam S.-K., Kim H.-I., Byun C.-H., Lee S.-K., “Needle type of hybrid temperature probe for both diagnosis and treatment of musculoskeletal pain syndrome,” J. Korean Soc. Precis. Eng. 31(4), 359–364 (2014). 10.7736/KSPE.2014.31.4.359 [DOI] [Google Scholar]
- 16.Pennes H. H., “Analysis of tissue and arterial blood temperatures in the resting human forearm,” J. Appl. Physiol. 1(2), 93–122 (1948). [DOI] [PubMed] [Google Scholar]
- 17.Johansson J. D., “Spectroscopic method for determination of the absorption coefficient in brain tissue,” J. Biomed. Opt. 15(5), 057005 (2010). 10.1117/1.3495719 [DOI] [PubMed] [Google Scholar]
- 18.Zhang F., Aravanis A. M., Adamantidis A., de Lecea L., Deisseroth K., “Circuit-breakers: optical technologies for probing neural signals and systems,” Nat. Rev. Neurosci. 8(8), 577–581 (2007). 10.1038/nrn2192 [DOI] [PubMed] [Google Scholar]
- 19.Molki A., “Simple Demonstration of the Seebeck Effect,” Sci. Educ. Rev. 9, 103–107 (2010). [Google Scholar]
- 20.Paxinos G., Watson C., The Rat Brain in Stereotaxic Coordinates (Academic, 2006). [DOI] [PubMed] [Google Scholar]
- 21.Park H.-J., Seol J. H., Ku J., Kim S., “Computational Study on the Thermal Effects of Implantable Magnetic Stimulation Based on Planar Coils,” IEEE Trans. Biomed. Eng. 63(1), 158–167 (2016). 10.1109/TBME.2015.2490244 [DOI] [PubMed] [Google Scholar]
- 22.Johansson J. D., Eriksson O., Wren J., Loyd D., Wårdell K., “Radio-frequency lesioning in brain tissue with coagulation-dependent thermal conductivity: modelling, simulation and analysis of parameter influence and interaction,” Med. Biol. Eng. Comput. 44(9), 757–766 (2006). 10.1007/s11517-006-0098-1 [DOI] [PubMed] [Google Scholar]
- 23.Larrat B., Pernot M., Aubry J.-F., Dervishi E., Sinkus R., Seilhean D., Marie Y., Boch A.-L., Fink M., Tanter M., “MR-guided transcranial brain HIFU in small animal models,” Phys. Med. Biol. 55(2), 365–388 (2010). 10.1088/0031-9155/55/2/003 [DOI] [PMC free article] [PubMed] [Google Scholar]
- 24.Collins C. M., Smith M. B., Turner R., “Model of local temperature changes in brain upon functional activation,” J. Appl. Physiol. 97(6), 2051–2055 (2004). 10.1152/japplphysiol.00626.2004 [DOI] [PubMed] [Google Scholar]
- 25.Larsson H. B., Courivaud F., Rostrup E., Hansen A. E., “Measurement of brain perfusion, blood volume, and blood-brain barrier permeability, using dynamic contrast-enhanced T(1)-weighted MRI at 3 tesla,” Magn. Reson. Med. 62(5), 1270–1281 (2009). 10.1002/mrm.22136 [DOI] [PubMed] [Google Scholar]
- 26.Leray A., Odin C., Huguet E., Amblard F., Le Grand Y., “Spatially distributed two-photon excitation fluorescence in scattering media: Experiments and time-resolved Monte Carlo simulations,” Opt. Commun. 272(1), 269–278 (2007). 10.1016/j.optcom.2006.11.007 [DOI] [Google Scholar]


