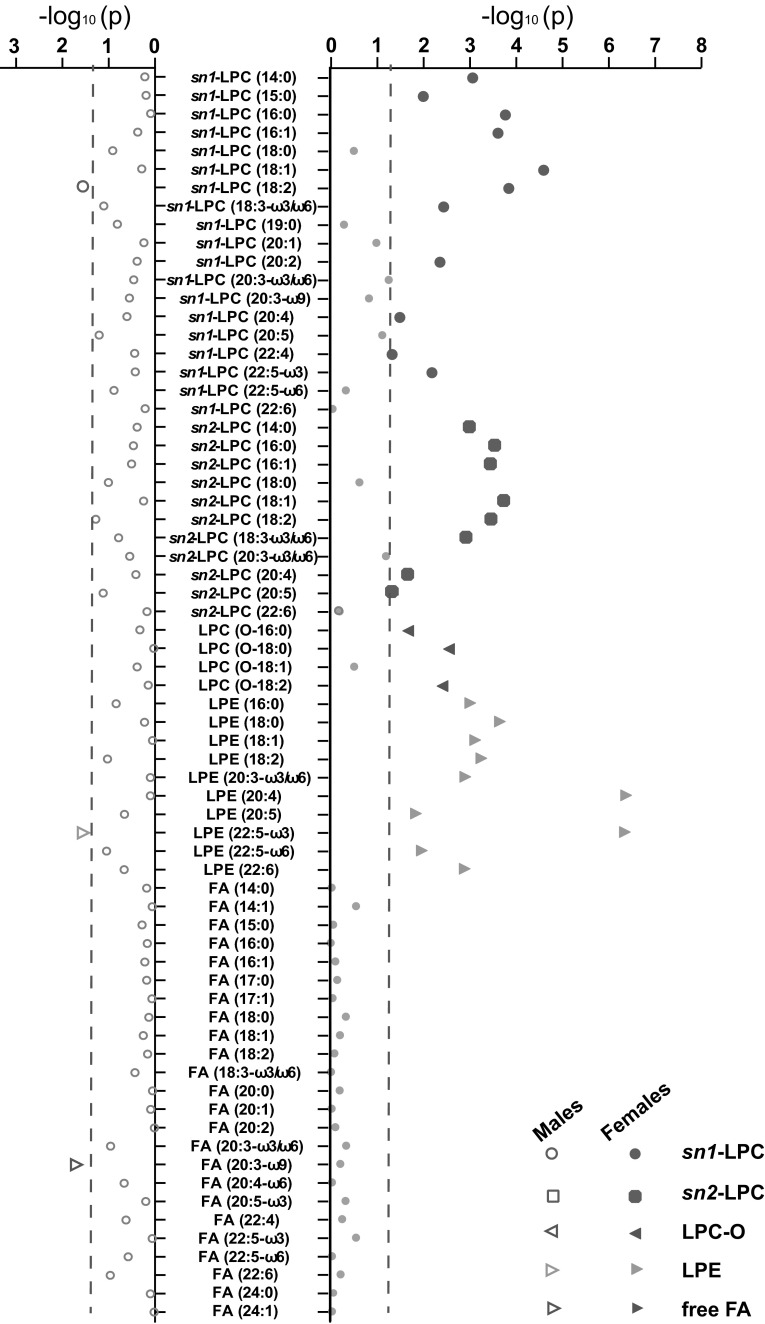
Fig. 1.
Graphical representation of t tests results in lipid clustering. Independent sample t tests were performed on all 68 metabolites on glucocorticoid (GC) users versus non-users, for both genders separately. The x-axis shows the logarithm of p values per metabolite for males and females; the blue dash line represents p value of 0.05

