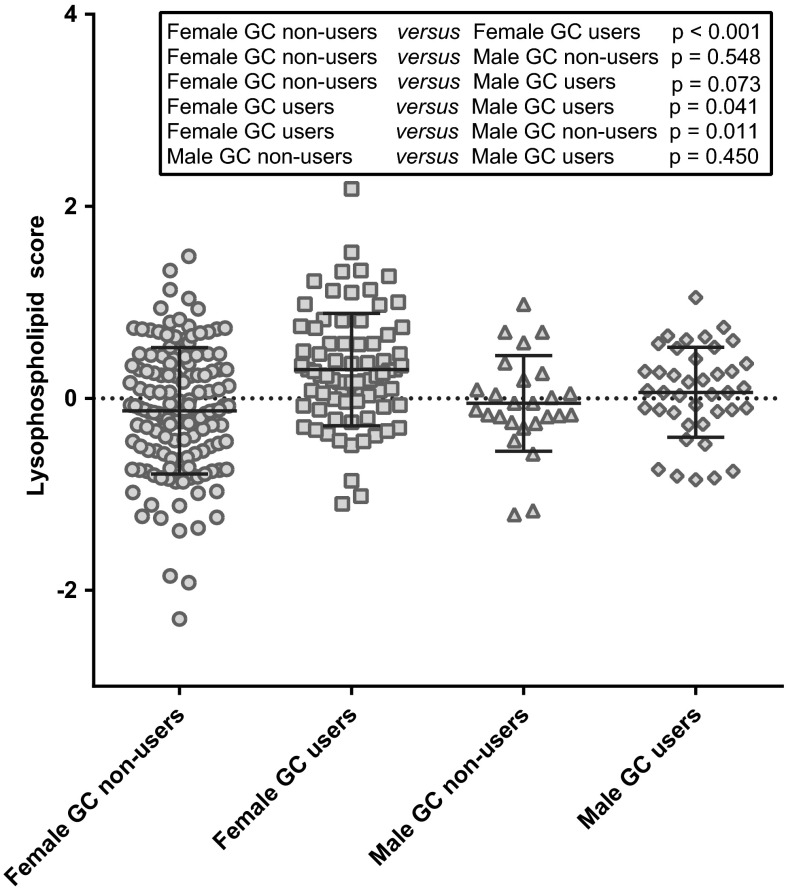
Fig. 2.
Lyophospholipid score in male patients without (n = 26) or with glucocorticoid (GC) treatment (n = 42), and in female patients without (n = 136) or with GC treatment (n = 77). Horizontal bars indicate mean values and standard deviation. One-way ANOVA with Fisher’s LSD was used to compare the means of score among subgroups

