

Abstract
Objective
Neonatal abstinence syndrome (NAS)—a clinical entity of infants from in utero exposure to psychoactive xenobiotic and buprenorphine—has been successfully used to treat NAS. However, nothing is known about the pharmacokinetics (PK) of buprenorphine in neonates with NAS. To our knowledge, this is the first study to investigate the population pharmacokinetic of sublingual buprenorphine in neonates with NAS.
Design
A retrospective population PK analysis of: (1) neonates with NAS treated with sublingual buprenorphine in randomized, double blinded clinical study and (2) data from healthy adults from a previously published pharmacokinetic study.
Setting
Neonatal intensive care unit and general clinical research unit.
Patients
Twenty-four neonates with NAS and five healthy adults.
Interventions
All participants received sublingual buprenorphine per study protocol.
Measurements and Main Results
A total of 303 PK data from 29 neonates and adults were used for model development. A population pharmacokinetic analysis was conducted using a first order conditional estimation with interaction in the NONMEM software program. A two-compartment linear PK model with first-order absorption process best described the pharmacokinetics of sublingual buprenorphine in neonates. The apparent clearance (CL) of buprenorphine was linearly related to body weight and matured with increasing age via two distinct saturated pathways. A typical neonate with NAS (body weight, 2.9 kg; postnatal age; 5.4 days) had a CL of 3.5 L/kg/hour and elimination half-life of 11 hours. Phenobarbital did not affect the clearance of buprenorphine compared to neonates of similar age and weight.
Conclusions
This is the first study to investigate the population PK of sublingual buprenorphine in neonatal NAS. To our knowledge, this is also the first report to describe the age-dependent changes of buprenorphine PK in this patient population. No buprenorphine dose adjustment is needed for neonates with NAS treated with buprenorphine and concurrent phenobarbital.
Keywords: Neonatal Abstinence Syndrome, buprenorphine, pharmacokinetics
Neonatal abstinence syndrome (NAS) is a clinical entity of infants from in-utero exposure to psychoactive xenobiotic, and is most notably associated with opioid exposure. Fifty percent of infants born with in-utero exposure have NAS symptoms severe enough to require pharmacologic therapy.1 The incidence of NAS has increased almost three-fold in the decade ending in 2009, with a yearly treatment cost in the United States of $720 million.2 Evidence-based guidelines identify opioids as the primary pharmacologic treatment option for NAS.3 Morphine and methadone are the most commonly used medications to treat patients with opioid-associated NAS.4 However, optimized treatments of these drugs in NAS have been hampered by a lack of clear understanding of the exposure-response relationship for selecting rational dosage regimens. Such an understanding would greatly benefit NAS patients as current approaches are associated with long inpatient treatment stays, which can interfere with maternal bonding, increase the potential for nosocomial infection, and elevate resource use.5–7
Buprenorphine is a partial μ agonist and κ-opioid antagonist that has been successfully used to reduce illicit opioid use in addicted adults.8 Buprenorphine has a number of characteristics that may make it an appealing agent for the pharmacologic treatment of NAS. It has an established safety profile in adults and adolescents and a decreased risk of overdose compared to full agonists.9 There is a lack of the cardiovascular toxicity of torsades de pointes observed with methadone.10 Lastly, the long half-life and duration of action for preventing withdrawal symptoms make buprenorphine a potentially appealing drug for treatment of opioid-associated NAS.4, 9, 10 While a pilot randomized control trial suggested that buprenorphine had greater efficacy compared to morphine with regard to length of treatment,6 the dosing regimen employed was empiric and the exposure response characteristics remain undescribed.6
The pharmacokinetic (PK) profile of buprenorphine has been extensively studied in adult populations.11–14 After oral dosing with buprenorphine, systemic bioavailability is about 16% due to high-pass metabolism.13, 15, 16 Therefore, buprenorphine is dosed sublingually, with a bio-availability between 30–50%.15, 17, 18 Buprenorphine is metabolized by cytochrome P450 (CYP) 3A4, and to a lesser extent CYP2C8, to the putatively active metabolite, norbuprenorphine; both undergo glucuronidation before elimination.19 Apparent clearance and terminal half-life of sub-lingual buprenorphine in adult populations are 210.4 L/hour and 27.7 hours, respectively.20 There has been very limited information related to PK of buprenorphine in neonatal or pediatric populations.21 Published pharmacokinetic parameters are limited to a single investigation of preterm infants treated with opioid analgesia employing a radioimmune assay.22 Finally, nothing is known about buprenorphine PK in neonates with NAS.
We used pharmacokinetic data collected in the Phase 1 clinical trials of sublingual buprenorphine in NAS patients and pharmacokinetic study of healthy adult to develop a first population pharmacokinetic (PPK) model that can: (1) describe the disposition/elimination of buprenorphine and (2) identify/quantify the effect of patient characteristics on pharmacokinetics of buprenorphine in patients with NAS.
Methods
Data
The data were obtained from neonates with NAS treated with sublingual buprenorphine in a randomized, double blinded clinical study to compare buprenorphine and morphine in the treatment of NAS6, 23 (NCT 00521248). The study was approved by the Institutional Review Board at Thomas Jefferson University. In this study, plasma PK samples were collected as a trough or peak (generally within an hour before or after a dose), with allowance made in collection time to facilitate the clinical care of infants.24 In addition, the published pharmacokinetic data with intensive PK sampling schedules from five healthy male volunteers who received a single 4 mg sublingual buprenorphine were included in the analysis.20 The study was approved by the Francis Scott Key Institutional Review Board. The PK samples were obtained at predose, 0.04, 0.08, 0.13, 0.17, 0.25, 0.33, 0.50, 0.75, 1, 1.5, 2, 3, 4, 5, 6, 7, 10, 13, and 23.75 hours after dose administration.
Sample Analysis
Liquid chromatography–tandem mass Spectrometry (LC-MS/MS) determination of buprenorphine was performed using our previously described method24 modified for use of 0.1-ml aliquots as described in our previous paper on neonates.6 In brief, 0.1-ml aliquots of neonate sample were brought to 0.5 ml with drug-free plasma, fortified with internal standard (buprenorphine-d4), made basic with NaOH and extracted with n-butyl chloride and acetonitrile (4:1 v/v). Samples were then analyzed on a Thermo Finnigan TSQ Quantum (Thermo Fisher Scientific, Waltham MA) equipped with Thermo Scientific Surveyor LC system with electrospray ionization and the MS in the selected reaction-monitoring mode. Precision (% coefficient of variation) of the quality control samples over the course of 10 analytical runs were 0.25 ng/ml – 17.2%; and 7.5 ng/ml – 5.2%. The PK samples from the adult study were analyzed using negative chemical ionization tandem MS as previously described.20, 25 The limit of quantitation for buprenorphine assay was 0.20 ng/mL. The between-run and within-run precisions were 13.8% and 9.8%, respectively.
Population Pharmacokinetics
The population pharmacokinetic (PPK) parameters for buprenorphine were obtained from routine clinical data using nonlinear mixed-effects modeling (NONMEM version 7.2, ICON Development Solutions, Ellicott City, MD) with first order conditional estimation with interaction (FOCE). Two different basic structural models, a one- and two-compartmental linear PK model with first-order linear absorption process, were fit to buprenorphine concentration-time data. In addition, several models with different absorption processes were examined. A log-normal distribution model was used to describe the inter subject variability of PK parameters. Additive, proportional, and combined (additive and proportional) residual error models were considered during the model-building process. The details of the covariate model development using stepwise approach are described in the Appendix 1.
Comparison of alternative structural models and construction of the covariate model was based on the typical goodness-of-fit diagnostic plots and likelihood ratio test. To discriminate two nested models and select significant covariates, a difference in an objective function of >6.64 (1 degree of freedom), which corresponds to a significant level of p<0.01, was used. Akaike information criterion (AIC) was used to select non nested model. A bootstrap resampling technique was used to evaluate the stability of the final model and estimate the confidence interval of parameters.26, 27 Because there were two different populations in the analysis, the bootstrap samples were obtained using stratified sampling technique in order to match the numbers of healthy adult and NAS subjects in the original data. The results from 1000 successful runs were obtained, and the mean and 2.5th and 97.5th percentiles (denoting the 95% confidence interval) for the population parameters were determined and compared with the estimates of the original data.
Results
Buprenorphine PK data (n=209) from 24 neonates with NAS and from 5 healthy male volunteers (n=94) were included in the final analysis. Therefore, a total of 303 PK data from 29 patients and volunteers were used for model development. The demographic data of the neonates with NAS are shown in Table 1. Sixteen of the 24 neonates were male (67%) and 6 (25%) also received phenobarbital treatment. The median gestational age was 39.2 weeks (range: 36.6–41.2). The median postmenstrual age was 41.0 weeks (range: 37.2–46.6). Median gestational weight was 2.9 kg (range: 2.2–4.1).
Table 1.
Demographic data of Neonatal Subjects with NAS for Model Development
| Mean (SD) | Median (Range) | |
|---|---|---|
| WT (kg) | 2.9 (0.5) | 2.9 (2.2–4.1) |
| PNA (days) | 8.7 (9.1) | 5.4 (0.1–49.3) |
NAS, neonatal abstinence syndrome; WT, body weight; PNA, postnatal age; SD, standard deviation.
Both one- and two-compartment PK model with linear absorption and elimination process were tested as the base model. The two-compartment model was selected as the structural model based on the change of objective function (p<0.01) and diagnostic plots. The NONMEM subroutine ADVAN4 TRANS4 was used for the two-compartment model fitting. Removal of both interindividual variability terms of apparent distribution clearance (Q) and central distribution volume (V2) did not result in a statistically significant increase in the objective function (p>0.01); therefore, only interindividual variability of apparent clearance (CL) and distribution volume of peripheral tissue compartment (V3) were retained in the model. Initially, a two-compartment linear PK model with a single first-order linear absorption process was used to describe the data. However, this model had difficulty achieving a successful COV step in NONMEM for standard error estimate of model parameters. Therefore, several models with different absorption processes were constructed and compared. The two-compartment PPK model with separate linear absorption processes for healthy adult and NAS patients was the most stable model in describing the observed data, and decreased the inter subject variability of the Ka by about 30%. Therefore, this model was selected as the final structural model for covariate model development.
After the effect of WT on PK parameters were accounted for in the model, PNA was the only significant covariate to explain interindividual variability for both CL and V3. No significant differences in CL and V3 were observed between neonates treated with or without phenobarbital. Therefore, the final model with covariates was described as follows:
| (1) |
| (2) |
where θCL and θV3 represent the typical values of CL and V3 in reference adult subject with WT of 70 kg, respectively.
Two different saturated models were used to describe the effect of PNA on CL. The first saturated pathway was described by the sigmoid Emax model with maximum effect (Emax), PNA value that produced a 50% maximum effect (KM), and a slope factor (SLP). The second saturated pathway was described by the first-order equation with a single saturation rate constant TF. A single saturated model was used to describe the effect of PNA on V3. In this model, BASE is the baseline parameter used to describe V3 at PNA=0. KMV3 and SLP1 are PNA values that produce 50% of the (1-BASE) effect and slope factor, respectively. The parameter estimates of the final model are summarized in Table 2. All parameters were determined with good precision with percent standard error of the parameter estimates <50%. The θCL was 141 L/hour, and the KM was 0.271 days with the SLP of 5.00, indicating that this PNA-dependent CL pathway was completed much faster than the second pathway with a TF of 0.177 per day. The calculated times to reach 50% and 90% of the weight-adjusted adult CL were 0.50 and 9.35 days, respectively (Figure 1A). Given that both WT and PNA affected the CL of sublingual buprenorphine, the calculated typical CL were 0.161, 1.34, 6.47, 7.27, 8.19, 11.8 and 12.9 L/hour for NAS patients with median WT of 2.9 kg and PNA of 0.1, 0.2, 0.5, 1, 2, 10 and 50 days, respectively. The calculated typical CL were 5.17, 7.70, 11.8, 14.6, 17.3, and 29.1 L/hour for NAS subjects with median PNA of 8.7 days and WT of 1, 2, 3, 4, 5, and 10 kg, respectively. The buprenorphine was absorbed relatively quickly after sublingual administration and the typical values of Ka for healthy adult and NAS patients were 0.642 and 0.416 per hour, respectively. The typical value was 205 L for V2 (θV2) and 621 L/hour for Q (θQ). The typical value of V3 (θV3) was 3218 L, indicating that buprenorphine was distributed widely into the tissue compartment. The BASE was 0.0268 or 2.68% of the weight-adjusted adult level. The KMV3 was 0.788 days with slope factor of 5.00, suggesting that V3 of the buprenorphine reached 50% and 90% of weight-adjusted adult level at about 0.788 and 1.30 days, respectively (Figure 1B). The inter individual variances were 0.177, 0.523, and 2.32 for Ka, CL and V3, respectively. The removal of the additive error from the model did not cause significant increase in objective function (p>0.01), and therefore, this term was dropped from the final model with covariates. The observed buprenorphine concentration-time profiles were reasonably described by the final model with covariates. Figure 2(A) includes individual predicted versus observed buprenorphine concentrations for all subjects in this analysis. Generally, there was a good agreement between the predicted and observed data except that the model over-predicted several observed buprenorphine concentrations in NAS patients, and the model diagnostic plots (Figures 2 and S1) of the final model did not identify systematic bias. Representation plots of observed and individual predicted buprenorphine concentration-time data in six NAS and five healthy adult volunteers are shown in Figures 3 and 4, respectively. These plots further demonstrated that the final model with covariate reasonably described the data.
Table 2.
Parameter Estimates of the Final Population Pharmacokinetic Model and the Stability of the Parameters Using a Bootstrap Validation Procedure
| Original Data Set | 1000 Bootstrap Replicates | |||
|---|---|---|---|---|
|
|
|
|||
| Estimate | SE | Mean | 95% CI | |
| Structural Model | ||||
| 0.642 | 0.127 | 0.641 | 0.429–0.948 | |
| Ka (hr−1) | ||||
| 0.416 | 0.120 | 0.411 | 0.182–0.655 | |
| Ka_NAS (hr−1) | ||||
| θCL (L/hr) | 141 | 17.4 | 157 | 112–234 |
| θV2 (L) | 205 | 47.7 | 203 | 113–297 |
| θQ (L/hr) | 621 | 165 | 589 | 283–812 |
| θV3 (L) | 3218 | 569 | 3514 | 1488–6053 |
| Inter individual Variability | ||||
| ω 2 Ka | 0.177 | 0.0630 | 0.131 | 0.00979–0.246 |
| ω 2 CL | 0.523 | 0.212 | 0.446 | 0.127–0.864 |
| ω 2 V3 | 2.32 | 1.01 | 2.10 | 0.537–4.31 |
| Covariate Model | ||||
| WT Effect on CL and Q | 0.750 (Fixed) | – | – | – |
| WT Effect on V2 and V3 | 1.00 (Fixed) | – | – | – |
| PNA Effect on CL | ||||
| KM (days) | 0.271 | 0.0490 | 0.214 | 0.00398–0.347 |
| Emax | 0.477 | 0.142 | 0.464 | 0.135–0.743 |
| SLP | 5.00 (Fixed) | – | – | – |
| TF (day−1) | 0.177 | 0.0751 | 0.152 | 0.0203–0.300 |
| PNA Effect on V3 | ||||
| BASE | 0.0268 | 0.00586 | 0.0258 | 0.00377–0.0485 |
| KMV3 (days) | 0.788 | 0.0701 | 0.734 | 0.519–0.886 |
| SLP1 | 5.00 (Fixed) | – | – | – |
| Residual Variability | ||||
| Proportional error σprop | 0.466 | 0.0589 | 0.444 | 0.358-0.526 |
SE=standard error of estimates; 95% CI=95% confidence interval; θCL, θV2, θQ, and θV3 represented typical values of CL, V2, Q, and V3 for reference adult with body weight of 70 Kg, respectively. ω2Ka, ω2CL, and ω2V3 represented population variance of Ka, CL, and V3, respectively. Emax, KM, and SLP represented the maximum effect, PNA value that produced 50% maximum effect, and slope factor, respectively, for the first PNA-dependent CL maturation pathway. TF was the first-order rate constant for the second PNA-dependent CL maturation pathway. BASE was the baseline parameter for V3 when PNA=0; KMV3 and SLP1 represented the PNA value that produced 50% of the (1-BASE) effect and slope factor for the PNA-dependent V3 maturation pathway.
Figure 1.

A) Clearance and B) distribution volume at peripheral compartment change with postnatal age in neonatal abstinence syndrome patient population.
Figure 2.
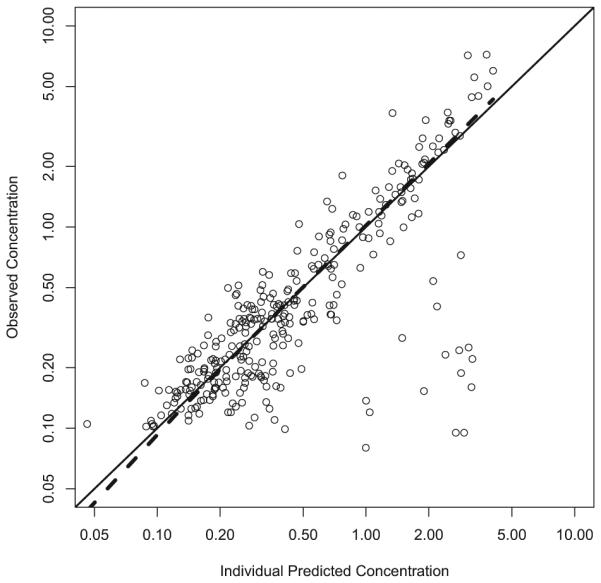
Individual predicted vs observed concentrations.
Figure 3.

Observed vs model predicted concentrations in NAS subjects. Open circle - observed concentrations; dotted line – population predicted concentrations (PRED); solid line – individual predicted concentrations (IPRED).
Figure 4.

Observed vs model predicted concentrations in healthy adult subjects. Open circle: observed concentrations; dotted line: population predicted concentrations; solid line: individual predicted concentrations.
From the original data set, 1500 replicate data sets were generated and used for the evaluation of the stability of the final model. NONMEM achieved successful minimization steps for 1465 out of 1500 (97.7%) replicated data set, suggesting that the model was relatively stable. The result from the first 1000 runs is shown in Table 2. The mean population parameters obtained from the bootstrap procedure were similar to the parameter estimates of the original data set, again indicating that the developed population PK model was stable. However, there was a relatively large 95% confidence interval for the interindividual variance of ω2Ka, Km, and BASE from the bootstrap procedure compared to the standard error of estimates of CL obtained from the original data set. This may be due to data limitation and/or the presence of the influencing subjects with PK parameters and observation significantly deviated from the population reference value.
Discussion
This is the first study to investigate the population pharmacokinetic of buprenorphine in NAS patients. To our knowledge, this is also the first report to describe the age-dependent changes of buprenorphine pharmacokinetics in this patient population. In this study, we demonstrated that phenobarbital treatment has no effect on the CL of buprenorphine in NAS subjects. While unexpected, given the known induction of CYP 3A isoenzymes, this is a reassuring finding for clinicians treating NAS patients with buprenorphine and phenobarbital.
A few studies have investigated the pharmacokinetics of intravenous buprenorphine in new-born infants and children,22, 28 but none have employed the population pharmacokinetics (PPK) approach. These studies involved small numbers of patients and employed traditional pharmacokinetic methods, which require a dense PK sampling schedule where 6–11 samples were obtained during the dosing interval. In contrast, PPK methods are based on statistical models that offer the possibility of using limited PK data obtained from a sparse sampling strategy to study the drug absorption, distribution, and metabolism of the buprenorphine. This is an obvious advantage when studying neonates, for whom dense PK sampling raises ethical concerns about the blood volume required for the study.29
Buprenorphine is a highly lipophilic drug that widely distributes into tissue, and therefore, the plasma concentration-time profiles of buprenorphine are usually best described by two- or three-compartment models after intravenous administrations.11–13, 20 Using only sparse PK data from NAS patients failed to construct a reasonable PPK model. Hence, additional dense PK data from healthy adult volunteers were added and combined with the neonatal PK data for model development using allometric principles.30–33 The science of allometry is well established32–34 and has been repeatedly used for size standardization in PK34 and pediatric PK analyses in patients with wide age range.31, 35 These combined data were successfully used to develop a stable structural PPK model in this analysis, using a population modeling approach with allometric principles.
The model estimated that clearance of sublingual buprenorphine for a typical 70 kg adult subject was 141 L/hour (2.0 L/hr/kg), which was within the range of 1.3–3.2 L/hour/kg reported in previous adult studies.18, 20 The most important biological covariates for predicting buprenorphine apparent clearance in NAS neonates were WT and PNA. Each of these factors is related to the development stage of the neonates. In addition, these two factors are highly correlated and rapidly changing over time. To study the potential age-dependent changes in the PK parameters, the actual weight measured during the PK sampling times was used. Using this time-dependent WT information together with fixing the allometric coefficient of 0.75 for clearance terms and 1 for volume terms based on allometric principle31, 32, 34 in the modeling process allowed us to uniquely identify the age-dependent effect on PK parameters. The model indicated that the buprenorphine CL gradually reached the adult level with increasing age via two distinct mechanisms, and the older neonate is expected to have a higher rate of CL than a younger neonate of equal body weight. These age-related changes in the CL after sublingual administration may be due to age dependent changes in metabolism, sublingual absorption, or both. However, without IV buprenorphine PK data in both NAS patients and adults, it is impossible to identify the precise roles of the metabolism and absorption alteration in the age-dependent CL observed in this study. The mean CL in the studied NAS patients with median WT of 2.9 kg and PNA of 5.4 days was 10 L/hour 3.5 L/hr/kg). To our best knowledge, this is the first reported clearance value of sublingual buprenorphine in neonates. Using the reported clearance of 0.26 L/hour/kg after intravenous buprenorphine administration in neonates,22 the estimated bioavailability of the sublingual buprenorphine in the NAS subjects was about 7%, which was lower than the range of 28–36% reported in adult subjects.15 The relatively low bioavailability of sublingual buprenorphine in NAS subjects may be due to (1) age-related changes in saliva flow rate, oral mucosal pH and thickness in adults and neonates that affecting the drug absorption,36 and/or (2) the majority of the administered drug could be accidently swallowed and subjected to extensive first-pass effects for low oral absorption.37 However, without an appropriate control group (i.e., neonates receiving oral buprenorphine), it was difficult to identify the causes for the relatively low bioavailability of sublingual buprenorphine observed in this study. The corresponding terminal half-life predicted from the model was 11 hours, which was within the reported range of 1–20 hours in a neonatal population after intravenous buprenorphine administration.22, 28
Buprenorphine is extensively metabolized by N-dealkylation to norbuprenorphine via cytochrome P450 (CYP) 3A4-mediated pathway.38 Phenobarbital is a well-known inducer of CYP3A439 and, therefore, may potentially decrease the clearance of buprenorphine when these two drugs are administered together in neonates with NAS. However, our study results suggest that phenobarbital did not affect the clearance of buprenorphine compared to neonates of similar age and weight. Buprenorphine was a high extracted drug, with a hepatic extraction ratio estimated to be close to 1.38 It is well-known that for the sublingual route of administration with minimal first-pass effects, clearance of the drug with high extraction ratio is mainly dependend on hepatic blood flow and not affected by the changes of intrinsic clearance (CLint).40 Therefore, increasing CLint of buprenorphine due to CYP3A4 induction by the phenobarbital had only minimal effect on the buprenorphine clearance in neonates with NAS, which was consistent with the findings observed in our study. Another possible explanation for the lack of PK interaction between phenobarbital and buprenorphine observed in this study is the low statistical power due to the small number of studied patients and volunteers included in the analysis. Further study with a larger number of neonates with NAS is needed to confirm the results of this study.
The ratio between the intersubject variance from final model with covariates to the model without co-variates provided an indication of how important covariates information was in explaining the population variability of the PK parameters.26, 27, 29 For example, the ratio of 0.95 achieved for CL in this study indicates that (1–0.941)*100=4.9% of the overall variability in clearance is predictable from covariate information. Weight and age only explained 4.9% and 4.5% of the inter individual variability of CL and V3, respectively. The intersubject variability of CL remained relatively large even after WT and PNA were included as important covariates in the final model, suggesting that other covariates such as genetic polymorphism of metabolizing enzymes/transporter and the hemodynamic/clinical status of the NAS patients may be needed to reduce the variability of the buprenorphine PK in these patients. Nevertheless, this developed PPK model represented our first-step of developing a population pharmacokinetic-pharmacodynamic (PKPD) model to guide the selection of optimal dosage regimen of buprenorphine in NAS subjects.
Because PK data from NAS patients alone was unable to support a reasonable PPK model, additional adult PK data that used different analytical assay for buprenorphine concentrations was included in the analysis. However, the potential differences of the analytical assays in NAS and adult subjects could have generated bias in our study results. In PPK analysis, residual variability was partly due to the variation in the analytical assay.41 Attempt to quantify the potential differences of these analytical assays by assigning separate residual variance models to NAS and adult subjects failed to improve the model prediction.42 Therefore, the final model assumed that both NAS patients and adult volunteers shared the same residual variability, suggesting that these two different assays were relatively well validated and consistent, with no significant differences between the assay.41 This final model was stable and produced reasonable good prediction for sublingual buprenorphine in NAS patients. Nevertheless, follow-up studies are ongoing to obtain additional optimal PK samples in NAS subjects for developing a more robust PPK model with good model parameter estimates without adult PK data.
In summary, we have created the first population pharmacokinetic model of buprenorphine in the neonatal population. This will assist in creating rational dosing regimens for this clinical entity, which has increased dramatically over the past decade. The described model is also notable for being the first involving a sublingually administered medication in the neonatal patient population.
Supplementary Material
Figure S1. Diagnostic plots of the final model with covariates.
Acknowledgments
The project described was supported by the Commonwealth of Pennsylvania Tobacco Fund and R21DA018207 and R01DA02976 from the National Institute on Drug Abuse. The content is solely the responsibility of the authors and does not necessarily represent the official views of the National Institute on Drug Abuse or the National Institute of Health.
APPENDIX. COVARIATE MODEL DEVELOPMENT
Covariate Model Development
After the PK structure model was selected, covariate models were built using a 2-step approach with the impact of weight (body size) on all pharmacokinetic parameters except Ka was described by allometric model:
| A1 |
in which TVP is the typical value of a PK parameter, θTVP is an estimated parameter for describing the typical PK parameter value for an individual with weight equal to the reference weight WTref; WTi is a body weight of individualt i; and θa is an allometric power parameter. During the model-building process, the standard adult referenced weight of 70 kg was used as WTref, and θa was either estimated or fixed at a value of 0.75 for clearance and a value of 1 for volumes on the basis of physiologic consideration of size impact on metabolic process.33, 43 For the first-step model development, a model for biological covariates (i.e., postnatal age) was built using the stepwise selection approach.29 The baseline gestational age and post menstrual age were not tested as biological covariates in the analysis because this information was not available in adults. Therefore, only WT, postnatal age (PNA), and gender were tested as biological covariates. Several covariate models including linear model, an exponential model, and sigmoidal saturation model with time-varying PNA were used to explore the age-related changes in PK parameters.44 After the effects of the biological covariates were incorporated in the model, the effects of phenobarbital treatment on PK parameters were tested to yield the final model. This sequential approach was taken to minimize confusion between any changes in PK parameters related to weight and other biological covariates and any changes resulting from phenobarbital treatment.26
Footnotes
Competing Interests
The authors affirm that they have no significant conflict of interest relevant to this manuscript.
Supporting Information
The following supporting information is available in the online version of this paper:
References
- 1.Hudak ML, Tan RC. Neonatal drug withdrawal. Pediatrics. 2012;129:e540–60. doi: 10.1542/peds.2011-3212. [DOI] [PubMed] [Google Scholar]
- 2.Patrick SW, Schumacher RE, Benneyworth BD, Krans EE, Mc-Allister JM, Davis MM. Neonatal abstinence syndrome and associated health care expenditures: United States, 2000-2009. JAMA. 2012;307:1934–40. doi: 10.1001/jama.2012.3951. [DOI] [PubMed] [Google Scholar]
- 3.Osborn DA, Jeffery HE, Cole MJ. Opiate treatment for opiate withdrawal in newborn infants. Cochrane Database Syst Rev. 2010;(10):CD002059. doi: 10.1002/14651858.CD002059.pub3. [DOI] [PubMed] [Google Scholar]
- 4.Kraft WK, van den Anker JN. Pharmacologic management of the opioid neonatal abstinence syndrome. Pediatr Clin North Am. 2012;59:1147–65. doi: 10.1016/j.pcl.2012.07.006. [DOI] [PMC free article] [PubMed] [Google Scholar]
- 5.Jackson L, Ting A, McKay S, Galea P, Skeoch C. A randomised controlled trial of morphine versus phenobarbitone for neonatal abstinence syndrome. Arch Dis Child Fetal Neonatal Ed. 2004;89:F300–4. doi: 10.1136/adc.2003.033555. [DOI] [PMC free article] [PubMed] [Google Scholar]
- 6.Kraft WK, Gibson E, Dysart K, et al. Sublingual buprenorphine for treatment of neonatal abstinence syndrome: a randomized trial. Pediatrics. 2008;122:e601–7. doi: 10.1542/peds.2008-0571. [DOI] [PMC free article] [PubMed] [Google Scholar]
- 7.Vega WA, Kolody B, Hwang J, Noble A. Prevalence and magnitude of perinatal substance exposures in California. N Eng J Med. 1993;329:850–4. doi: 10.1056/NEJM199309163291207. [DOI] [PubMed] [Google Scholar]
- 8.Mattick RP, Breen C, Kimber J, Davoli M. Buprenorphine maintenance versus placebo or methadone maintenance for opioid dependence. Cochrane Database Syst Rev. 2014;(2):CD002207. doi: 10.1002/14651858.CD002207.pub4. [DOI] [PMC free article] [PubMed] [Google Scholar]
- 9.Walsh SL, Preston KL, Stitzer ML, Cone EJ, Bigelow GE. Clinical pharmacology of buprenorphine: ceiling effects at high doses. Clin Pharmacol Ther. 1994;55:569–80. doi: 10.1038/clpt.1994.71. [DOI] [PubMed] [Google Scholar]
- 10.Krantz MJ, Lewkowiez L, Hays H, Woodroffe MA, Robertson AD, Mehler PS. Torsade de pointes associated with very-high-dose methadone. Ann Intern Med. 2002;137:501–4. doi: 10.7326/0003-4819-137-6-200209170-00010. [DOI] [PubMed] [Google Scholar]
- 11.Jensen ML, Foster DJ, Upton RN, et al. Population pharmacokinetics of buprenorphine following a two-stage intravenous infusion in healthy volunteers. Eur J Clin Pharmacol. 2007;63:1153–9. doi: 10.1007/s00228-007-0377-2. [DOI] [PubMed] [Google Scholar]
- 12.Bullingham RE, McQuay HJ, Dwyer D, Allen MC, Moore RA. Sublingual buprenorphine used postoperatively: clinical observations and preliminary pharmacokinetic analysis. Br J Clin Pharmacol. 1981;12:117–22. doi: 10.1111/j.1365-2125.1981.tb01189.x. [DOI] [PMC free article] [PubMed] [Google Scholar]
- 13.Bullingham RE, McQuay HJ, Moore A, Bennett MR. Buprenorphine kinetics. Clin Pharmacol Ther. 1980;28:667–72. doi: 10.1038/clpt.1980.219. [DOI] [PubMed] [Google Scholar]
- 14.Moody DE, Fang WB, Morrison J, McCance-Katz E. Gender differences in pharmacokinetics of maintenance dosed buprenorphine. Drug Alcohol Depend. 2011;118:479–83. doi: 10.1016/j.drugalcdep.2011.03.024. [DOI] [PMC free article] [PubMed] [Google Scholar]
- 15.Mendelson J, Upton RA, Everhart ET, Jacob P, 3rd, Jones RT. Bioavailability of sublingual buprenorphine. J Clin Pharmacol. 1997;37:31–7. doi: 10.1177/009127009703700106. [DOI] [PubMed] [Google Scholar]
- 16.Strain EC, Moody DE, Stoller KB, Walsh SL, Bigelow GE. Relative bioavailability of different buprenorphine formulations under chronic dosing conditions. Drug Alcohol Depend. 2004;74:37–43. doi: 10.1016/j.drugalcdep.2003.11.008. [DOI] [PubMed] [Google Scholar]
- 17.McQuay HJ, Moore RA, Bullingham RE. Buprenorphine kinetics. In: Foley KN, Inurrisi CE, editors. Advances in Pain Research and Therapy. Raven Press; New York: 1986. pp. 271–8. [Google Scholar]
- 18.Bullingham RE, McQuay HJ, Porter EJ, Allen MC, Moore RA. Sublingual buprenorphine used postoperatively: ten hour plasma drug concentration analysis. Br J Clin Pharmacol. 1982;13:665–73. doi: 10.1111/j.1365-2125.1982.tb01434.x. [DOI] [PMC free article] [PubMed] [Google Scholar]
- 19.Moody DE. Metabolic and toxicological considerations of the opioid replacement therapy and analgesic drugs: methadone and buprenorphine. Expert Opin Drug Metab Toxicol. 2013;9:675–97. doi: 10.1517/17425255.2013.783567. [DOI] [PubMed] [Google Scholar]
- 20.Kuhlman JJ, Jr, Lalani S, Magluilo J, Jr, Levine B, Darwin WD. Human pharmacokinetics of intravenous, sublingual, and buccal buprenorphine. J Anal Toxicol. 1996;20:369–78. doi: 10.1093/jat/20.6.369. [DOI] [PubMed] [Google Scholar]
- 21.Michel E. Zernikow B [Buprenorphine in children. A clinical and pharmacological review] Schmerz. 2006;20:40–50. doi: 10.1007/s00482-005-0456-1. [DOI] [PubMed] [Google Scholar]
- 22.Barrett DA, Simpson J, Rutter N, Kurihara-Bergstrom T, Shaw PN, Davis SS. The pharmacokinetics and physiological effects of buprenorphine infusion in premature neonates. Br J Clin Pharmacol. 1993;36:215–9. doi: 10.1111/j.1365-2125.1993.tb04220.x. [DOI] [PMC free article] [PubMed] [Google Scholar]
- 23.Kraft WK, Dysart K, Greenspan JS, Gibson E, Kaltenbach K, Ehrlich ME. Revised dose schema of sublingual buprenorphine in the treatment of the neonatal opioid abstinence syndrome. Addiction. 2011;106:574–80. doi: 10.1111/j.1360-0443.2010.03170.x. [DOI] [PMC free article] [PubMed] [Google Scholar]
- 24.Moody DE, Slawson MH, Strain EC, Laycock JD, Spanbauer AC, Foltz RL. A liquid chromatographic-electrospray ionization-tandem mass spectrometric method for determination of buprenorphine, its metabolite, norbuprenorphine, and a co-formulant, naloxone, that is suitable for in vivo and in vitro metabolism studies. Anal Biochem. 2002;306:31–9. doi: 10.1006/abio.2002.5673. [DOI] [PubMed] [Google Scholar]
- 25.Kuhlman JJ, Jr, Magluilo J, Jr, Cone E, Levine B. Simultaneous assay of buprenorphine and norbuprenorphine by negative chemical ionization tandem mass spectrometry. J Anal Toxicol. 1996;20:229–35. doi: 10.1093/jat/20.4.229. [DOI] [PubMed] [Google Scholar]
- 26.Ng CM, Bruno R, Combs D, Davies B. Population pharmacokinetics of rituximab (anti-CD20 monoclonal antibody) in rheumatoid arthritis patients during a phase II clinical trial. J Clin Pharmacol. 2005;45:792–801. doi: 10.1177/0091270005277075. [DOI] [PubMed] [Google Scholar]
- 27.Ng CM, Lum BL, Gimenez V, Kelsey S, Allison D. Rationale for fixed dosing of pertuzumab in cancer patients based on population pharmacokinetic analysis. Pharm Res. 2006;23:1275–84. doi: 10.1007/s11095-006-0205-x. [DOI] [PubMed] [Google Scholar]
- 28.Olkkola KT, Maunuksela EL, Korpela R. Pharmacokinetics of intravenous buprenorphine in children. Br J Clin Pharmacol. 1989;28:202–4. doi: 10.1111/j.1365-2125.1989.tb05418.x. [DOI] [PMC free article] [PubMed] [Google Scholar]
- 29.Shellhaas RA, Ng CM, Dillon CH, Barks JD, Bhatt-Mehta V. Population pharmacokinetics of phenobarbital in infants with neonatal encephalopathy treated with therapeutic hypothermia. Pediatr Crit Care Med. 2013;14:194–202. doi: 10.1097/PCC.0b013e31825bbbc2. [DOI] [PMC free article] [PubMed] [Google Scholar]
- 30.Anderson BJ, Holford NH. Mechanism-based concepts of size and maturity in pharmacokinetics. Annu Rev Pharmacol Toxicol. 2008;48:303–32. doi: 10.1146/annurev.pharmtox.48.113006.094708. [DOI] [PubMed] [Google Scholar]
- 31.Anderson BJ, Holford NH. Tips and traps analyzing pediatric PK data. Paediatr Anaesth. 2011;21:222–37. doi: 10.1111/j.1460-9592.2011.03536.x. [DOI] [PubMed] [Google Scholar]
- 32.West GB, Brown JH, Enquist BJ. A general model for the origin of allometric scaling laws in biology. Science. 1997;276:122–6. doi: 10.1126/science.276.5309.122. [DOI] [PubMed] [Google Scholar]
- 33.West GB, Brown JH, Enquist BJ. The fourth dimension of life: fractal geometry and allometric scaling of organisms. Science. 1999;284:1677–9. doi: 10.1126/science.284.5420.1677. [DOI] [PubMed] [Google Scholar]
- 34.Meibohm B, Laer S, Panetta JC, Barrett JS. Population pharmacokinetic studies in pediatrics: issues in design and analysis. AAPS J. 2005;7:E475–87. doi: 10.1208/aapsj070248. [DOI] [PMC free article] [PubMed] [Google Scholar]
- 35.Anderson BJ, Woollard GA, Holford NH. A model for size and age changes in the pharmacokinetics of paracetamol in neonates, infants and children. Br J Clin Pharmacol. 2000;50:125–34. doi: 10.1046/j.1365-2125.2000.00231.x. [DOI] [PMC free article] [PubMed] [Google Scholar]
- 36.Lam JK, Xu Y, Worsley A, Wong IC. Oral transmucosal drug delivery for pediatric use. Adv Drug Deliv Rev. 2014;73:50–62. doi: 10.1016/j.addr.2013.08.011. [DOI] [PubMed] [Google Scholar]
- 37.Watson PJ, McQuay HJ, Bullingham RE, Allen MC, Moore RA. Single-dose comparison of buprenorphine 0.3 and 0.6 mg i.v. given after operation: clinical effects and plasma concentration. Br J Anaesth. 1982;54:37–43. doi: 10.1093/bja/54.1.37. [DOI] [PubMed] [Google Scholar]
- 38.Elkader A, Sproule B. Buprenorphine: clinical pharmacokinetics in the treatment of opioid dependence. Clin Pharmacokinet. 2005;44:661–80. doi: 10.2165/00003088-200544070-00001. [DOI] [PubMed] [Google Scholar]
- 39.Lin JH, Lu AY. Inhibition and induction of cytochrome P450 and the clinical implications. Clin Pharmacokinet. 1998;35:361–90. doi: 10.2165/00003088-199835050-00003. [DOI] [PubMed] [Google Scholar]
- 40.Hedaya MA. Basic Pharmacokinetics. 2nd Taylor & Francis; Boca Raton, FL: 2012. [Google Scholar]
- 41.Han K, Pillai VC, Venkataramanan R. Population pharmacokinetics of cyclosporine in transplant ecipients. AAPS J. 2013;15:901–12. doi: 10.1208/s12248-013-9500-8. [DOI] [PMC free article] [PubMed] [Google Scholar]
- 42.Dvorchik B, Arbeit RD, Chung J, Liu S, Knebel W, Kastrissios H. Population pharmacokinetics of daptomycin. Antimicrob Agents Chemother. 2004;48:2799–807. doi: 10.1128/AAC.48.8.2799-2807.2004. [DOI] [PMC free article] [PubMed] [Google Scholar]
- 43.Anderson BJ, McKee AD, Holford NH. Size, myths and the clinical pharmacokinetics of analgesia in paediatric patients. Clin Pharmacokinet. 1997;33:313–27. doi: 10.2165/00003088-199733050-00001. [DOI] [PubMed] [Google Scholar]
- 44.Anderson BJ, Allegaert K, Van den Anker JN, Cossey V, Holford NH. Vancomycin pharmacokinetics in preterm neonates and the prediction of adult clearance. Br J Clin Pharmacol. 2007;63:75–84. doi: 10.1111/j.1365-2125.2006.02725.x. 1. [DOI] [PMC free article] [PubMed] [Google Scholar]
Associated Data
This section collects any data citations, data availability statements, or supplementary materials included in this article.
Supplementary Materials
Figure S1. Diagnostic plots of the final model with covariates.