
FIG 3 .
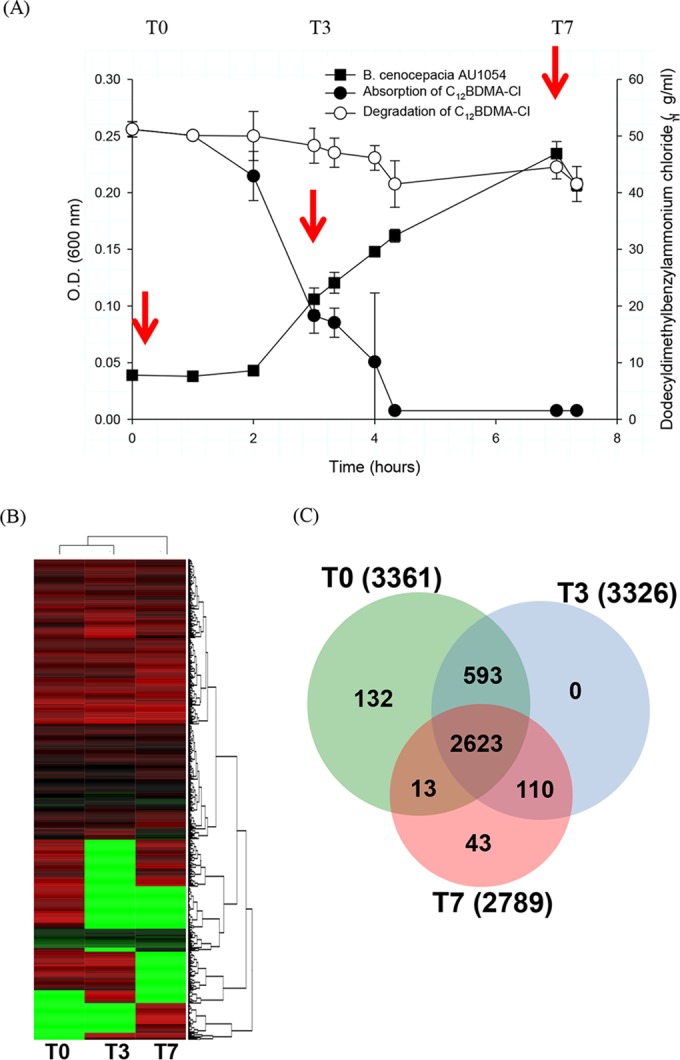
Summary of proteins identified in this proteome study. (A) Time course of sampling. (B) Cluster analysis of proteomic data sets showing the correlation between protein expression profiles and treatment time. (C) Venn diagram analysis of the proteome (3,747/6,632).