

Abstract
This study evaluated the effects of comorbid disorders of diabetes and hyperthyroidism in the adult male mice. In total, 32 ICR strain mice were equally distributed into four groups: control (C), diabetic (D), diabetic-plus-hyperthyroid (DH), and hyperthyroid (H). Mice allocated for diabetes received a single intraperitoneal injection of streptozotocin (STZ) at 200 mg/kg body weight. At the onset of diabetes, one group of mice was concomitantly injected levothyroxine (LT4; 0.3 mg/kg body weight) and the other set of animals received the same treatment independently on a daily basis. The body weight, as well as the testicular and epididymal weights, was reduced markedly in D and DH mice. Higher trends of blood glucose levels were seen in the DH group, in comparison to euthyroid diabetic mice. Thyroid hormones could exert a transient effect on blood glucose homeostasis by altering the serum blood glucose level in diabetic patients. Histomorphometric analysis showed increased luminal sizes of seminiferous tubules, along with decreased epithelial height and atrophic changes in germinal stem cells in the testis of DH and H mice. Caput epididymis of DH mice showed extensive compaction of principal cells, loss of stereocilia, lipid vacuolization, and inflammatory infiltrations; however, damaged tubular integrity, packed clear cells, exfoliated cells, and round spermatids were profoundly noticed in the cauda epididymis. Hyperthyroidism elevated the serum testosterone levels in H and DH mice and produced critical damages to the histoarchitecture of the epididymis. Collectively, this experiment endeavored to mimic the polyglandular autoimmune syndrome, which will be helpful to better understand the reasons for male infertility in diabetic-cum-hyperthyroid patients.
Keywords: Diabetes, Hyperthyroidism, Testicular and epididymal morphology
1. Introduction
Diabetes mellitus (DM) and thyroid dysfunction (TD) are the most common endocrine disease conditions affecting not only the human population (Kadiyala et al., 2010; Duntas et al., 2011) worldwide, but also many animal species (Taniyama et al., 1993; Hoenig, 2002; Lederer et al., 2009; Singh and Beigh, 2013; Hoenig, 2014). Both metabolic manifestations have an underlying pathology, intersecting with one another through disorders of insulin and thyroid hormones. Modulation of insulin sensitivity and feedback of thyroid hormones are controlled centrally at 5'-adenosine monophosphate-activated protein kinase (AMPK) (Goglia et al., 1999). The concomitant presence of TD and DM may be due to an overlap between the autoimmune syndromes exemplified in polyglandular autoimmune syndrome type 2, in which type 1 DM and Hashimoto’s disease are among the most frequently observed complications (Betterle et al., 2002). Reduced fertility and poor sperm quality have been observed in patients with type 1 DM (Mulholland et al., 2011). Nuclear and mitochondrial damages have been seen in human sperm samples obtained from diabetic males (Agbaje et al., 2007), suggesting that hyperglycemia may cause oxidative stress and free radical damage to sperm DNA. Correspondingly, thyroid hormones, most notably triiodothyronine (T3), were reported to have a significant influence in the regulation of Sertoli cell proliferation and differentiation during testicular development encompassing the assembly of the blood-testis barrier (van Haaster et al., 1993; de Franca et al., 1995). Moreover, T3 is also reported to bring around Leydig cell differentiation and stimulation of steroidogenesis in the testis of rats (Mendis-Handagama and Siril Ariyaratne, 2005).
The coexistence of and relationship between TD and DM have been addressed by many researchers (Wu, 2000; Betterle and Zanchetta, 2003; Betterle et al., 2004; Barker et al., 2005; Blois et al., 2010; Hage et al., 2011; Shaikh et al., 2014). The effects of these concurrent conditions on different systems of the body have been discussed only as retrospective studies on the basis of some naturally occurring clinical case records in humans, but the data were found lacking in the context of research trials into such a syndrome and its effects on reproductive health. Only few authors have highlighted the role of thyroid hormones in the development of testis and spermatogenesis during adulthood (Zamoner et al., 2007; Sahoo et al., 2008). Considering the situation, this study was planned to mimic such a polyglandular complication by inducing DM concomitantly with hyperthyroidism through injections of streptozotocin (STZ) and levothyroxine (LT4). The effects of these comorbid metabolic manifestations were investigated individually in controlling diabetic and hyperthyroid animals; however, these disorders were simultaneously induced in the same experimental animals to observe their effects on the morphology of testes and epididymides, along with quantitative estimation of some endocrine hormones.
2. Materials and methods
2.1. Ethics statement
The experimental protocols involving mice were conducted in accordance with the Guide for the Care and Use of Laboratory Animals prepared by the Institutional Animal Care and Use Committee of Nanjing Agricultural University, China.
2.2. Animals and treatments
Thirty-two young healthy male mice of ICR strain (Institute of Cancer Research, Philadelphia, USA; species Mus musculus) (Hayashi et al., 2006) at 6 weeks of age with average body weight of 30–35 g were purchased from Qinglongshan Laboratory Animal Company (Nanjing, China). The mice were kept in a room with controlled temperature (21–22 °C), lighting (12-h light, 12-h dark), and humidity (65%–70%). All mice were tagged and initial body weights were recorded. Mice were fed with standard balanced mouse pellets, and drinking water was given ad libitum.
Our experiment has 5-week duration and started when the mice were 6 weeks of age. The mice were divided into four groups: control (C), diabetic (D), diabetic-plus-hyperthyroid (DH), and hyperthyroid (H), each comprising eight replicates. Nonfasting blood glucose levels of all mice were measured through tail vein puncture by using the Sannuo rapid blood glucose meter (Sinocare Inc., Changsha, China). Body weights, along with feed and water consumption, of all groups were recorded on every alternate day. Mouse litter was changed twice a day to provide dry bedding, particularly for polyuric animals with ketonic smell. Feed index (grams per 10 g) and water index (milliliters per 10 g) were calculated for each group as follows: food consumption index=total food consumed per day/body weight×10; water intake index=total water intake per day/body weight×10. Relative testis/body weight ratio (%) was calculated using the following formula: weight of testes/total body weight×100%.
Mice allocated for induction of DM were kept off feed for 12 h (only water was allowed). STZ was dissolved in cold citrate buffer (pH 4.4) for immediate use within 20 min. Mice of groups D and DH were given a single intraperitoneal injection of STZ at the dose of 200 mg/kg body weight (Hayashi et al., 2006); they were additionally offered 10% (0.1 g/ml) sucrose in place of water on the first day of injection just to prevent them from hypoglycemic shock, which was replaced by fresh water on the next day. Nonfasting blood glucose was examined through tail vein puncture 3–5 d after STZ injection. Mice with random blood glucose level >17 mmol/L (normal: random 7.1–8.2 mmol/L) were considered diabetic. The mice of the DH and H groups were intraperitoneally injected with LT4 (0.3 mg/kg body weight) (Kung and Ng, 1994; Chandra et al., 2010; Kim et al., 2012) on a daily basis till the end of the experiment. The experimental mice were kept without any type of reversal treatment such as insulin or methimazole, throughout the study period.
2.3. Sample collection
After weighing the animals, blood samples were collected from mice anesthetized with halothane through the orbital artery, and mice were euthanized by decapitation. The paired testes and epididymides were weighed and then the left testis and epididymis were fixed in 4% (0.04 g/ml) paraformaldehyde for histomorphological analysis. The blood samples were centrifuged at 4000g for 10 min to retrieve sera and stored at −80 °C until further use.
2.4. Measurement of serum hormones
The levels of thyroid-stimulating hormone (TSH) and insulin (µIU/ml), thyroxine (T4), T3, and testosterone (ng/ml) were determined by commercial radio immunoassay (RIA) kits (Shanghai University of Traditional Chinese Medicine, Shanghai, China) at the General Hospital of the Nanjing Military Command, Nanjing, Jiangsu, China.
2.5. Histomorphology under light microscope
The fixed tissues were dehydrated through a graded series of alcohol, cleared in xylene, and embedded in paraffin. Sections (5-μm thickness) were cut perpendicular to the longest axis of the testis and epididymis, mounted on glass slides, and stained with hematoxylin and eosin (Nanjing Jiancheng Bioengineering Institute, Nanjing, China). Ten seminiferous tubules (STs) of the testis from each replicate were evaluated, under 100×, 400×, and 1000× magnifications, according to the method of Navarro-Casado et al. (2010). Similarly, epididymal tubules were examined in the proximal caput, and measurements were conducted horizontally from one edge to the next for all visible tubules; however, all apparent tubules were evaluated in the distal cauda region. Three independent observers unaware of the slide identity were asked to observe and report histomorphological changes. Germ cells, epithelial cells, and interstitial spaces were examined, and their diameters, extent of epithelial thickening, and size of lumen of the tubes were recorded in micrometers.
2.6. Statistical analysis
Computations were carried out with SPSS (Version 17.0) and Graph Pad Prism (Version 5.0). All values were expressed as mean±standard error of the mean (SEM). The differences across groups were calculated with one-way analysis of variance (ANOVA), followed by Tukey’s post hoc test and two-way ANOVA by considering Bonferroni posttests to compare the means of the replicates, where P-values of <0.05 were considered significant.
3. Results
3.1. Weights of body, testes and epididymides, and testis/body weight ratio
The body weight was recorded on alternate days, and their mean values are presented on a weekly basis (Fig. 1a). Generally, the body weights of diabetic mice in the groups D and DH were significantly lower as compared to those of the controls. However, the mice in group H showed reduced body weight following three weeks of the treatment, compared with group C, but the body weight was remain increased in comparison to groups D and DH during the whole study period. Testicular weight was significantly reduced in groups D and DH (26%), while reduction in testicular weight in group H (7%) was not statistically significant compared with control (Table 1). The data on testis/body weight ratio revealed markedly decreased testicular weight in DH mice in comparison to all other groups, with the exception of group H (Fig. 1b). The weights of the epididymides were significantly reduced in groups D (38%) and DH (26%), while in group H (13%), the decrease was not significant (Table 1).
Fig. 1.

Effects of STZ-induced diabetes and hyperthyroidism on average weekly body weight (a) and testis/body weight ratio (b) in adult mice
(a) Body weights were significantly decreased in all diabetic groups (diabetic (D) and diabetic-plus-hyperthyroid (DH)) from 7 to 11 weeks of age compared with control (C) and hyperthyroid (H); (b) The least testis/body weight ratio was noticed in the DH group. The values are expressed as the mean±SEM (n=8), and different labels indicate significant (P<0.05) differences among groups. The label “ab” at 7 weeks of age represents the D group
Table 1.
Testicular and epididymal weights and diameters of tubules along with the sizes of their lumens
| Group | Testes weight (g) | Epididymis weight (g) | Seminiferous tubule, epithelial cell height (µm) | Seminiferous tubule, lumen diameter (µm) | Epididymis, caput diameter (µm) | Epididymis, caput lumen diameter (µm) | Epididymis, cauda diameter (µm) | Epididymis, cauda lumen diameter (µm) |
| C | 0.27±0.01a | 0.08±0.01a | 60.5±1.38a | 74.25±2.15a | 152.6±3.27a | 63.8±2.84a | 318.7±5.53a | 280.2±5.63a |
| D | 0.20±0.01b | 0.05±0.01b | 50.4±1.46b | 114.20±2.91b | 120.2±2.00b | 72.2±2.36a | 272.7±9.48b | 228.5±6.01b |
| DH | 0.20±0.01b | 0.06±0.00b | 56.7±1.50b | 91.80±2.59c | 103.9±1.98c | 66.7±3.43a | 193.7±9.77c | 121.2±12.92c |
| H | 0.25±0.00a | 0.07±0.00a | 55.0±1.71b | 98.80±3.20c | 139.0±5.73d | 84.2±2.39b | 291.3±8.39ab | 251.9±9.32ab |
Values are expressed as mean±SEM (n=8). In each column, different labels indicate significant differences among groups for each parameter at P<0.05
3.2. Blood glucose levels
Nonfasting blood glucose levels were noted down prior to induction of diabetes and thereafter throughout the study period. The results crossing the maximal limit (27.8 mmol/L) of the screening device were displayed as HI (high). Such high values were mostly seen in the replicates of samples from the DH group and are presented as 28 mmol/L. Blood glucose level was significantly increased in all the diabetic groups (D and DH) in comparison to groups C and H (Fig. 2). This increase was noticed 3–5 d after STZ injection and then remained high throughout the study period. However, about 3 weeks after injection, increased blood glucose levels were observed in the DH group as compared to the euthyroid D group, which further concurred with each other.
Fig. 2.
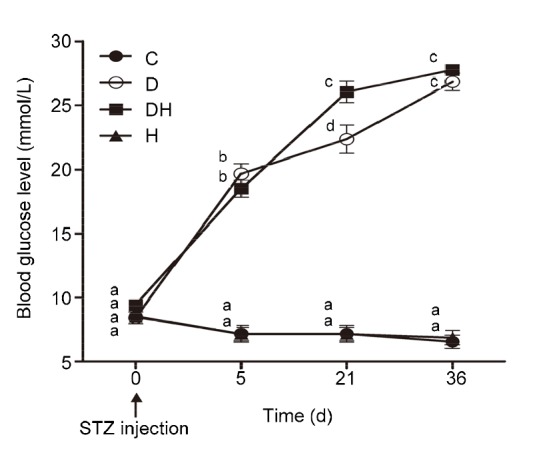
Average random blood glucose level of each group recorded at different days
Blood glucose levels of all diabetic mice were increased compared to the C and H groups. Data are shown from the time point of STZ injection and thereafter at various days during the observational period. Each value represents the mean±SEM (n=8). Different labels indicate significant (P<0.05) differences among groups
3.3. Food and water consumption
Fig. 3a represents the average food consumption index, which was significantly increased in the D (83%), DH (133%), and H (101%) groups of mice compared with that in the C group, while no major difference was established among the mice in the D and H groups. However, the feed consumption ratio of mice in the DH group was significantly higher (27%) than that in the D group of mice. The average water utilization index was found to be elevated in the mice of the DH group (274%), followed by those in the D (197%) and H (96%) groups, compared with the mice in the C group (Fig. 3b). Our experimental findings indicate that hyperthyroidism augments food and water consumption when it is induced concomitantly with diabetes.
Fig. 3.
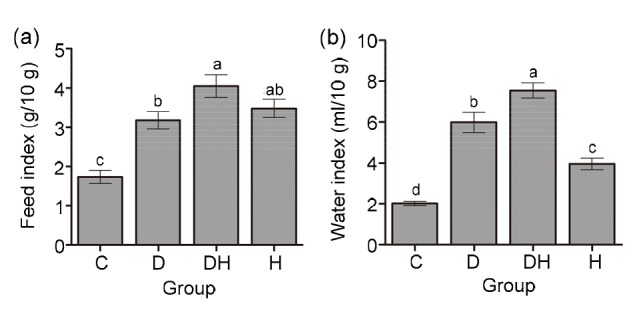
Food and water consumption indexes of experimental mice under different treatments
(a) Average food consumption index=total food consumed per day/body weight×10; (b) Average water consumption index=total water consumed per day/body weight×10. Data are shown as mean±SEM (n=8) and different labels indicate significant (P<0.05) differences among groups
3.4. Serum hormonal profile
Fig. 4a depicts that nonfasting serum insulin level was considerably decreased in DH mice, compared with the C and H groups; however, it was significantly decreased in the D group than in the C group. Hyperthyroidism significantly augmented the serum testosterone levels (Fig. 4b) in the H and DH groups in comparison to the C and D groups; however, serum testosterone levels were found to be reduced in diabetic mice compared with all other experimental animals. The total serum TSH level showed no statistical difference among the D, DH, and C groups; however, it was significantly reduced in the H group as compared to all other groups, with the exception of DH (Fig. 4c). Fig. 4d illustrates that T4 levels were significantly reduced in the D group as compared to all other experimental animals; however, markedly raised values were noticed in the DH and H groups. T3 levels were surprisingly low in DH mice compared with that in H and C mice, while no apparent change was seen between the D and DH groups (Fig. 4e).
Fig. 4.
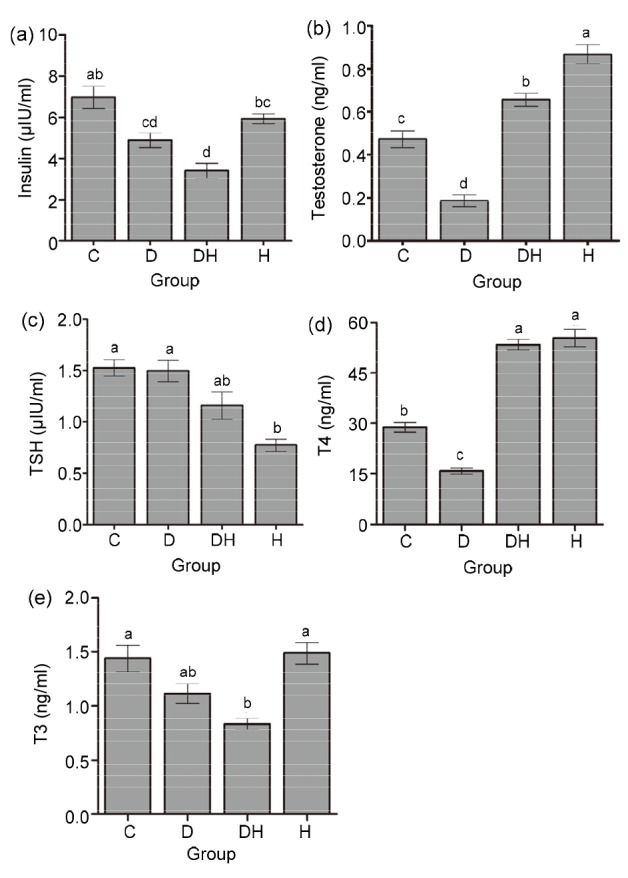
Quantitative measurements of serum levels of insulin (a), testosterone (b), TSH (c), T4 (d), and T3 (e) in different groups of mice
Each value represents the mean±SEM (n=8) and different labels indicate significant (P<0.05) differences among groups
3.5. Histological evaluation of testicular and epididymal sections
Histological observation of the testicular sections of mice showed considerably diminished epithelial height of STs in the D (17%), DH (6%), and H (9%) groups, compared with the control. The sizes of lumina of these tubes were found to be critically increased, with a low cell density in the testes of D mice (54%), followed by H (33%) and DH (24%) mice, while variation among DH and H mice was not significant (Table 1 and Figs. 5 and 6). Panels D, D1, D2, and DH of Fig. 5 depict amorphous material and edema in the interstitial connective tissues in all diabetic groups. Furthermore, distortions of the seminiferous epithelia, along with abnormal cellular attachment in the lineage of germ cells, were also noticed at many sites in the tubules of treated animals (panels D and D1 of Fig. 5). Panels DH1, DH2, H, H1, and H2 of Fig. 5 and panels C1, C2, C5, and D3 of Fig. 6 illustrate the missing or atrophic germinal stem cells and spermatocytes in the DH and H groups, during the cell cycle stages I–VI and X of STs. Masses of residual bodies at stages XI–XII were only seen in the DH group (panel C6 of Fig. 6). In comparison to treated animals, the testicular cells of control mice were well organized, STs were intact, and germinal cells maintained their associations (panels C, C1, and C2 of Fig. 5).
Fig. 5.

Effects of diabetes and hyperthyroidism on the histoarchitecture of seminiferous tubules in adult mice
Following fixation, the paraffin-embedded testes were cut perpendicular to the longest axis of the testes at 5-μm thickness, mounted on glass slides, and stained with hematoxylin and eosin. Ten consecutive seminiferous tubules from each replicate were evaluated, following a line from the edge to the center of the cross section of the testis according to a systematic method of microscopic analysis. The images pasted with letter C represent control mice, showing the following normal features: ST, seminiferous tubule; LC, Leydig cells; SC, Sertoli cells; IS, interstitial space; SG, spermatogonia; PS, primary spermatocytes; S, spermatocytes. The yellow triangular arrow heads show the accumulation of edematous fluid in D, D2, and DH. Missing germinal cells and apoptosis have been marked by red triangular arrow heads in DH1, DH2, H, H1, and H2. The black arrows indicate the increased sizes of lumina of seminiferous tubules. Representative images were captured at 100× and 400× magnifications. Different markings inside the images were inserted through Adobe Photoshop CS5, and bars are 50 μm in size (Note: for interpretation of the references to color in this figure legend, the reader is referred to the web version of this article)
Fig. 6.

Hematoxylin and eosin stained images of testes of STZ-and T4-treated mice at the age of 11 weeks
These micrographs represent the most frequently observed structural changes inside the seminiferous tubules, evaluated by a systematic method of light microscopic examination under 1000× magnification with oil immersion. The images in each column represent the different experimental groups, viz., control (C), diabetic (D), diabetic-plus-hyperthyroid (DH), and hyperthyroid (H). These photomicrographs show the histopathological changes at different stages of the seminiferous tubule at diverse stages in the cycle of spermatogenesis. These stages are marked at the left side of the figure and are denoted according to the staging method defined for laboratory mouse (Russell, 1990). Different abbreviated markings and arrows indicate the following: SG, spermatogonia; PS, primary spermatocytes; RS, round spermatids; ScN, Sertoli cell nuclei; RB, residual bodies. The missing or reduced-size germinal stem cells and spermatocytes are very prominent in C1, C2, C5, D1, D2, and D3 (marked with red triangles) and increased luminal sizes of tubules are marked by black arrows. Different markings inside the images were inserted through Adobe Photoshop CS5, and bars are 10 μm in size (Note: for interpretation of the references to color in this figure legend, the reader is referred to the web version of this article)
The morphometric assessment of epididymal sections showed highly differentiated epithelium surrounded by stroma in the caput, corpus (results not shown), and cauda of control mice. The spermatozoa were seen in the lumen enclosed by pseudostratified epithelium, composed of five distinct cell types, i.e., principal, basal, halo, apical, and clear cells. The tall columnar cells consist of basally located nuclei and are the principal cells. The stereocilia or microvilli were prominent as minute cytoplasmic projections at the plasma membrane of the caput. The plasma membrane of cauda epididymis (CdE) was found confined to a good number of clear cells. In STZ-diabetic-plus-hyperthyroid-treated mice, the mean diameter of the proximal caput epididymis (CpE) was considerably low (32%), followed by the same in the D (21%) and H (9%) groups, compared with the C group. However, the lumen diameter of CpE is significantly increased in the H group (32%) only, compared to all other groups (Table 1). Correspondingly, the diameter of distal CdE was found to be low in the DH group (39%), followed by the D group (14%), compared to the C group, while the diameter of this segment was elevated in the H group (50%) compared with DH; however, no statistical difference was noticed among the C, D, and H groups of mice. Similarly, the lumen diameter of CdE was found to be critically diminished in the DH group (62%), followed by the D group (18%), compared to the C group; nevertheless, the diameter was still considerably wide in the H group (107%) relative to that of DH mice (Table 1). In the D and DH groups of mice, no spermatozoa were seen at the proximal CpE (Fig. 7, B1, B2, C1, and C2); however, few germ cells could be seen in the H animals (Fig. 7, D1 and D2) compared with controls. In contrast, distal cauda segments of the epididymis showed spermatozoa in the lumen of tubes (Fig. 7, C3, C4, D3, and D4). Comparatively, the epididymis of the DH mice was found to be critically damaged, where the stereocilia of the caput were found partially lost, broken, and irregular in their structure (Fig. 7, C2). The tubular shrinkage in the caput and caudal segments of all treated animals caused compaction of the principal and clear cells to variable degrees in the epithelia, leading to heterochromatic cellular lineage and thickened basement membrane. Panels C1 and C2 of Fig. 7 represent lipid vacuolizations and inflammatory infiltrations in the CpE of DH mice, while the CdE of the same group revealed exfoliated cells and round spermatids (Fig. 7, C3 and C4). The cribriform changes were more evident in the DH and H groups in the distal cauda segments (Fig. 7, C4 and D4).
Fig. 7.

Hematoxylin and eosin stained proximal caput and distal cauda of epididymis of adult mice under different treatments
Each column shows different treatment groups, viz., control (C), diabetic (D), diabetic-plus-hyperthyroid (DH), and hyperthyroid (H). Normal findings in control were captured at magnifications of 100× and 400× in A1, A3 and A2, A4, respectively. Comparatively, the epididymis of the DH mice was found to be critically damaged, with the caput depicting lack of germ cells in the lumen, broken and weak stereocilia (black arrows), and lipid vacuolization (green arrow heads) in the principal cells in panels C1 and C2 and inflammatory infiltrations (red arrow heads) were noticed in C1. The round bodies and exfoliated germ cells (yellow arrow heads) in C3 and C4, cribriform changes and compaction of clear cells (red arrows) are marked in the cauda epididymis in C4 and D4. Bars are 50 μm in size (Note: for interpretation of the references to color in this figure legend, the reader is referred to the web version of this article)
4. Discussion
This is the first time that the concomitant effects of diabetes and hyperthyroidism, as well as their subsequent metabolic effects in terms of abnormalities in reproduction and fertility of mice, have been investigated.
STZ-induced diabetes and hyperthyroidism produce adverse effects on growth and body metabolism of the animals by decreasing their absolute weights. This confirms the anabolic role of insulin and T4 as catabolic hormones. Similarly, lower body weights have been reported in nude mice following STZ injection (Graham et al., 2011). The hyperthyroid mice consumed more but gained less, which is because of hyperthyroidism; hyperthyroidism has been shown to cause reduction of weights mainly due to the catabolic effects on adipose and muscle tissues (Iwen et al., 2013). In our study, the body weights of the mice within treated groups at different time points were nonsignificantly decreased from the start of treatment until 2–3 weeks of study. These results suggest that STZ and LT4 may not have a direct effect on the body weight of animals.
Decreased relative testicular weights were observed in hyperthyroid and STZ-diabetic-plus-hyperthyroid mice in our study. Similarly, larger thyroid hormone doses were reported to result in decreased weights of testes and seminal vesicles (Krassas et al., 2010). Our results showed decreased testicular weights (26%) in all diabetic mice. Similarly, in adult IRS2 (Insulin Receptor Substrate 2) deficient mice (8–12 weeks of age), reduced testicular weight (45%) was reported (Griffeth et al., 2013). Furthermore, reduced testicular weights were also observed in Akita homozygous mice at the age of 9 weeks (Schoeller et al., 2012).
The STZ-induced diabetes, individually and concomitantly with hyperthyroidism, produced inhibitory effects on the absolute weight of the epididymis. Consistent atrophic changes in the epididymis were found in STZ-diabetic animals by other investigators (Soudamani et al., 2005; Navarro-Casado et al., 2010).
Following STZ injection, the nonfasting blood glucose level significantly increased in all diabetic (D and DH) animals. Similar findings were reported earlier (Kianifard et al., 2012). Moreover, DH mice showed higher levels of glucose at 3 weeks of treatment in comparison to euthyroid diabetic animals. However, the control and the hyperthyroid mice did not develop any statistically significant difference during the study period. The increment of blood glucose at a time point in DH mice might be due to thyrotoxicosis, which previously has been reported to cause increased gluconeogenesis and reduced glycogen synthesis in subclinical and overt hyperthyroid animals (Maratou et al., 2010). These findings suggest that in the long run, there is no significant effect of hyperthyroidism on random blood glucose level. However, thyroid hormones can produce transient effects on blood glucose homeostasis by altering the serum blood glucose levels in diabetic patients. Furthermore, the blood glucose levels were found to constantly increase in D and DH mice from the point of injection till the end of the study period. This suggests that STZ may not have a direct effect on the blood glucose level of the animals.
This work revealed higher food and water consumption in diabetic mice as compared to the mice in the control group, which is in agreement with previously reported studies (Hayashi et al., 2006; Akbarzadeh et al., 2007). However, hyperthyroidism resulted in increased food and water consumption when induced concomitantly with diabetes only. These findings are consistent with previous reports (Messarah et al., 2011).
Hyperthyroidism, when induced concomitantly with STZ-induced diabetes, can change the levels of various hormones (insulin, testosterone, TSH, T4, and T3). We found that nonfasting serum insulin concentration was markedly reduced in euthyroid D and DH mice. The ddY strain mice showed slightly decreased insulin levels over time, following induction of STZ-DM (Hayashi et al., 2006). We found virtually normal insulin levels in hyperthyroid mice, which were in line with the results of previous researchers (Roubsanthisuk et al., 2006). Our data are in agreement with previous findings (O'Meara et al., 1993) suggesting that the disturbed serum insulin levels in H mice could be due to different degrees of insulin resistance and the half-life of that hormone inside the body.
In this study, the serum testosterone levels were severely decreased in diabetic mice. Similarly, reduced levels of testosterone and luteinizing hormone (LH), along with normal follicle-stimulating hormone (FSH), have been reported earlier in Akita homozygous mice (mutant at ins2 gene) in comparison to wild-type animals (Schoeller et al., 2012). Insulin is known to affect the hypothalamic-pituitary axis, which can alter serum levels of hormones important in spermatogenesis (Bucholtz et al., 2000). Decreased levels of FSH and LH, with nonsignificantly decreased testosterone, have been reported in STZ-diabetic adult rats (Kianifard et al., 2012). Per se, it could be assumed that the lack of insulin in diabetic mice might have reduced the production of pituitary hormones, particularly gonadotropins, and caused the resultant reduced fertility in animals. Our data showed that hyperthyroidism significantly enhanced the testosterone level in diabetic mice (DH) compared with euthyroid D and C mice, and this increment was more profound in the mice of the H group. The steroidogenic enzymes responsible for androgen biosynthesis are regulated directly or indirectly through thyroid hormones (Cortés et al., 2014). The numbers of LH receptors and the steroidogenic regulatory proteins and enzymes are directly affected by T3 hormone. Steroidogenic factor-1 acts as a mediator for T3-induced Leydig cell steroidogenesis (Manna et al., 2001; Maran, 2003). T3 has been proven to induce Leydig cell differentiation and to stimulate steroidogenesis in the rat testis (Mendis-Handagama and Siril Ariyaratne, 2005). Increased testosterone level has been shown by in vitro incubation of hyperthyroid rats’ Leydig cells (Schneider et al., 1979). Decreased FSH level, either via direct pituitary inhibition or via hastened metabolism, has been reported in hyperthyroid rats, which indicates that the thyroid hormone may stimulate intratesticular 17β-hydroxysteroid dehydrogenase (Schneider et al., 1979). Thyroid hormones can directly affect the sensitivity of gonadotrophs toward gonadotropin-releasing hormone (GnRH) and consequently interfere in their production pathways (Krassas et al., 2010).
Unmanaged prediabetes, both type 1 and type 2, may induce a “low T3 state”, characterized by reduced serum T3 levels, but nearly normal T4 and TSH levels (Donckier, 2003). Our study revealed that total serum TSH levels were virtually normal in both diabetic and control groups, while it was markedly reduced in the H group of mice. These findings are in agreement with previous reports (Kim et al., 2012). Conversely, reduced levels of T3 and T4 have also been reported in outdoor human patients (Mouradian and Abourizk, 1983; Radetti et al., 1994). Likewise, we noticed reduced levels of serum total T4 in euthyroid diabetic mice. However, our results verified that when hyperthyroidism was induced concurrently with diabetes, it dominantly raised the values of T4 compared to the levels in euthyroid diabetic animals. Similarly, higher values were also noticed in H mice. Our previous work has shown augmented values of total T3, T4, and estradiol (E2) levels in hyperthyroid female rats at postnatal days 10 and 21 (Fedail et al., 2014). LT4 has been found to enhance serum T3 and T4 levels in adult male rats (Kim et al., 2012).
We have found great discrepancy in published data, regarding normal total T4 levels of mouse and rat. In books, it ranges from 10–80 ng/ml (Foster et al., 1983) to (4700±300) ng/ml (Delahunty and Beamer, 2007). However, the published data of research articles after 2010 show the total T4 level in control subjects as ranging from (13.0±3.92) ng/ml (Sahoo and Roy, 2012) to (39 280.0±11 970) ng/ml (Kim et al., 2012). Such enormous differences in data might be due to the use of different blood samples such as serum or plasma and diverse analytical kits such as RIA and enzyme-linked immunosorbent assay (ELISA).
T3 values were considerably diminished in DH mice, while no apparent variation has been established among other experimental groups. DM influences the assessment of thyrotoxicosis by falsely decreasing the blood levels of T4 and T3 during severely uncontrolled hyperglycemia (Mouradian and Abourizk, 1983). However, significantly reduced T3 level has also been reported 12 h after desistance of insulin treatment in a diabetic patient (Chopra, 1976).
We have reported the novel concomitant STZ-diabetes-and-hyperthyroidism-induced histomorphological changes in the testicular and epididymal tissues in mice. In our experiment, the control group revealed well-organized testicular cell association inside the STs, with intact and regular epithelia. However, pathological changes such as increased luminal sizes of STs, with low cellular densities of variable degrees, were seen amid different groups. The stroma surrounding the STs of diabetic mice showed edematous fluid and amorphous material. In our study, reduced epithelial height and germ cell populations with abnormal cellular lineage were recorded in the STs of diabetic groups. Moreover, missing spermatogonia, primary spermatocytes, and secondary spermatocytes were also observed in the STs of DH animals. Similar changes in the histoarchitecture of testes and disruption of spermatogenesis in adult rats following single intraperitoneal injection of STZ have also been reported by previous researchers (Zhao et al., 2003; Kianifard et al., 2012). Furthermore, supportive evidences for the cellular abnormalities and irregular epithelial lining of STs under thyroid malfunction are available only in neonatal or prepubertal rodents (Lagu et al., 2011; Oatley et al., 2011).
The epididymis, being an important part for the maturation and motility of spermatozoa, remains under the influence of the direct and indirect pathological conditions of testes. Our study has revealed profound adverse effects of STZ-diabetes-plus-hyperthyroidism on the epididymis. Atrophic changes leading to contraction of epididymal sections, along with inflamed epithelial masses, were observed. STZ-diabetes and hyperthyroidism decreased the mean tubular diameters of CpE and CdE. The hyperthyroidism-plus-STZ-diabetes group showed segment-specific effect, as the reduction in diameter and luminal space was more pronounced in the CdE as compared to the caput region. No spermatozoa in the proximal CpE of D or DH groups were seen; however, few germ cells were present in the H group of mice. Similar histological changes under the influence of short-term STZ-induced diabetes have been reported in prepubertal Wistar rats (Soudamani et al., 2005; de Grava Kempinas and Klinefelter, 2014). T4 treatment in prepubertal and adult rats showed fluctuations in the concentrations of different lipid classes in epididymal-specific regions, which indicated fertility disturbances in male animals during hyperthyroidism (Pereira et al., 1984). Positive correlations between vascular endothelial growth factor receptor 2 (VEGFR2), VEGF-A and triglyceride levels have been reported to cause lipid abnormalities in diabetes (Ruszkowska-Ciastek et al., 2014). In our study, thyrotoxicosis along with STZ-induced diabetes pronouncedly affected the histoarchitecture of the epididymal tube, in terms of reduced germ cell population, loss of stereocilia, clumping of epithelial cells, and lipid vacuolization along with inflammatory infiltrations, exfoliated cells, and round spermatids with cribriform changes. All these findings were also revealed to a lesser degree in diabetic and hyperthyroid animals, which, plausibly, indicated male infertility. Our results are in agreement with the result of previous researchers (Kühn-Velten et al., 1984; Singh et al., 2009; Navarro-Casado et al., 2010), who studied STZ-induced diabetes and thyroid alterations individually, in terms of reduced epididymal weight and lumen diameter at different segments with variable degrees and the ages of the animals. Some of them showed that epididymal changes are produced through the indirect deficiency of androgen hormone. Our study showed minor effects on the histology of epididymal segments in STZ-diabetic and hyperthyroid control groups. However, we demonstrated that diabetes together with hyperthyroidism can significantly affect the level of testosterone and lead to severe damages in the histomorphometric organization of the epididymis of adult animals. Similarly, increased testosterone level has long been shown following T4 administration (Schneider et al., 1979). Furthermore, defective sexual development has been noticed due to alteration in LH pulse frequency, in the presence of high level of testosterone (Chandrasekhar et al., 1985). These results suggest that altered testosterone level in the blood can produce detrimental changes in the microenvironment of the epididymis.
5. Conclusions
Herein, we conclude that ICR mice can better serve as a model for polyglandular syndrome, particularly when STZ-induced diabetes is to be induced concomitantly with hyperthyroidism. The results of this study provided the evidence that such syndromes produce distinct influence on the food and water consumption, blood glucose level, and weights of testes and epididymides in adult mice. Likewise, we determined that thyrotoxicosis, independently and concomitantly with diabetes, affects the levels of insulin, testosterone, TSH, T4, and T3 hormones. The histomorphometric analysis in this experiment showed deleterious effects on testicular and epididymal tissues, particularly during concurrent presence of diabetes and hyperthyroidism. This study revealed increased luminal size with low cellular density in the STs of different groups. The stroma surrounding the STs of diabetic mice showed edematous fluid and amorphous material. In the epididymis, germ cell depletion, shrinkage of tubules, packed principal and clear cells, lipid vacuolization, abnormal cellular attachment, damaged epithelia with inflammatory and cribriform changes, exfoliated epithelial cells, and round spermatids were prominent in DH mice. We demonstrated that diabetes together with hyperthyroidism can significantly elevate testosterone level and lead to severe effects in terms of the histomorphometry of the epididymis in adult animals. Collectively, this experiment endeavored to mimic the polyglandular autoimmune syndrome, which will be helpful in better understanding the reasons for male infertility in diabetic-cum-hyperthyroid patients.
Acknowledgments
Dr. Zaheer Ahmed NIZAMANI of Department of Veterinary Pathology of Sindh Agriculture University Tandojam, Pakistan, is acknowledged for reading the original manuscript and offering valuable suggestions.
Footnotes
Project supported by the National Natural Science Foundation of China (Nos. 31572403, 31172206, and 31402075)
Compliance with ethics guidelines: Nazar Ali KOREJO, Quan-wei WEI, Atta Hussain SHAH, and Fang-xiong SHI declare that they have no conflict of interest.
All institutional and national guidelines for the care and use of laboratory animals were followed.
References
- 1.Agbaje IM, Rogers DA, McVicar CM, et al. Insulin dependant diabetes mellitus: implications for male reproductive function. Hum Reprod. 2007;22(7):1871–1877. doi: 10.1093/humrep/dem077. (Available from: http://dx.doi.org/10.1093/humrep/dem077) [DOI] [PubMed] [Google Scholar]
- 2.Akbarzadeh A, Norouzian D, Mehrabi MR, et al. Induction of diabetes by streptozotocin in rats. Indian J Clin Biochem. 2007;22(2):60–64. doi: 10.1007/BF02913315. (Available from: http://dx.doi.org/10.1007/BF02913315) [DOI] [PMC free article] [PubMed] [Google Scholar]
- 3.Barker JM, Yu J, Yu L, et al. Autoantibody “subspecificity” in type 1 diabetes. Diabetes Care. 2005;28(4):850–855. doi: 10.2337/diacare.28.4.850. (Available from: http://dx.doi.org/10.2337/diacare.28.4.850) [DOI] [PubMed] [Google Scholar]
- 4.Betterle C, Zanchetta R. Update on autoimmune polyendocrine syndromes (APS) Acta Biomed. 2003;74(1):9–33. [PubMed] [Google Scholar]
- 5.Betterle C, Dal Pra C, Mantero F, et al. Autoimmune adrenal insufficiency and autoimmune polyendocrine syndromes: autoantibodies, autoantigens, and their applicability in diagnosis and disease prediction. Endocr Rev. 2002;23(3):327–364. doi: 10.1210/edrv.23.3.0466. (Available from: http://dx.doi.org/10.1210/edrv.23.3.0466) [DOI] [PubMed] [Google Scholar]
- 6.Betterle C, Lazzarotto F, Presotto F. Autoimmune polyglandular syndrome type 2: the tip of an iceberg; Clin Ex Immunol; 2004. pp. 225–233. (Available from: http://dx.doi.org/10.1111/j.1365-2249.2004.02561.x) [DOI] [PMC free article] [PubMed] [Google Scholar]
- 7.Blois SL, Dickie EL, Kruth SA, et al. Multiple endocrine diseases in cats: 15 cases (1997–2008) J Feline Med Surg. 2010;12(8):637–642. doi: 10.1016/j.jfms.2010.03.017. (Available from: http://dx.doi.org/10.1016/j.jfms.2010.03.017) [DOI] [PMC free article] [PubMed] [Google Scholar]
- 8.Bucholtz DC, Chiesa A, Pappano WN, et al. Regulation of pulsatile luteinizing hormone secretion by insulin in the diabetic male lamb. Biol Reprod. 2000;62(5):1248–1255. doi: 10.1095/biolreprod62.5.1248. (Available from: http://dx.doi.org/10.1095/biolreprod62.5.1248) [DOI] [PubMed] [Google Scholar]
- 9.Chandra AK, Sinha S, Choudhury SR. Thyroxine induced stress and its possible prevention by catechin. Indian J Exp Biol. 2010;48(6):559–565. [PubMed] [Google Scholar]
- 10.Chandrasekhar Y, D'Occhio MJ, Holland MK, et al. Activity of the hypothalamo-pituitary axis and testicular development in prepubertal ram lambs with induced hypothyroidism or hyperthyroidism. Endocrinology. 1985;117(4):1645–1651. doi: 10.1210/endo-117-4-1645. (Available from: http://dx.doi.org/10.1210/endo-117-4-1645) [DOI] [PubMed] [Google Scholar]
- 11.Chopra IJ. An assessment of daily production and significance of thyroidal secretion of 3,3',5'-triiodothyronine (reverse T3) in man. J Clin Invest. 1976;58(1):32–40. doi: 10.1172/JCI108456. (Available from: http://dx.doi.org/10.1172/JCI108456) [DOI] [PMC free article] [PubMed] [Google Scholar]
- 12.Cortés DCC, Langlois VS, Fernandino JI. Crossover of the hypothalamic pituitary-adrenal/interrenal, -thyroid, and -gonadal axes in testicular development. Front Endocrinol. 2014;5:139. doi: 10.3389/fendo.2014.00139. (Available from: http://dx.doi.org/10.3389/fendo.2014.00139) [DOI] [PMC free article] [PubMed] [Google Scholar]
- 13.de Franca LR, Hess RA, Cooke PS, et al. Neonatal hypothyroidism causes delayed Sertoli cell maturation in rats treated with propylthiouracil: evidence that the Sertoli cell controls testis growth. Anat Rec. 1995;242(1):57–69. doi: 10.1002/ar.1092420108. (Available from: http://dx.doi.org/10.1002/ar.1092420108) [DOI] [PubMed] [Google Scholar]
- 14.de Grava Kempinas W, Klinefelter GR. Interpreting histopathology in the epididymis. Spermatogenesis. 2014;4(2):e979114. doi: 10.4161/21565562.2014.979114. (Available from: http://dx.doi.org/10.4161/21565562.2014.979114) [DOI] [PMC free article] [PubMed] [Google Scholar]
- 15.Delahunty KM, Beamer WG. Endocrinology: bone as a target tissue for hormonal regulation. In: Fox JG, Davisson MT, Quimby FW, et al., editors. The Mouse in Biomedical Research. 2nd Ed. 3 Normative Biology, Husbandry, and Models. Burlington: Academic Press; 2007. pp. 123–132. (Available from: http://dx.doi.org/10.1016/B978-012369454-6/50058-3) [Google Scholar]
- 16.Donckier J. Endocrine diseases and diabetes. In: Pickup JC, Williams G, editors. Text Book of Diabetes Mellitus. Vol. 27. Chichester, UK: Blackwell Publishing Company; 2003. pp. 21–25. [Google Scholar]
- 17.Duntas LH, Orgiazzi J, Brabant G. The interface between thyroid and diabetes mellitus. Clin Endocrinol. 2011;75(1):1–9. doi: 10.1111/j.1365-2265.2011.04029.x. (Available from: http://dx.doi.org/10.1111/j.1365-2265.2011.04029.x) [DOI] [PubMed] [Google Scholar]
- 18.Fedail JS, Zheng K, Wei Q, et al. Roles of thyroid hormones in follicular development in the ovary of neonatal and immature rats. Endocrine. 2014;46(3):594–604. doi: 10.1007/s12020-013-0092-y. (Available from: http://dx.doi.org/10.1007/s12020-013-0092-y) [DOI] [PubMed] [Google Scholar]
- 19.Foster HL, Small JD, Fox JG. The Mouse in Biomedical Research: Normative Biology, Immunology, and Husbandry. Academic Press. http://dx.doi.org/10.1016/B978-0-12-262503-9.50002-5.1983. [Google Scholar]
- 20.Goglia F, Moreno M, Lanni A. Action of thyroid hormones at the cellular level: the mitochondrial target. FEBS Lett. 1999;452(3):115–120. doi: 10.1016/s0014-5793(99)00642-0. (Available from: http://dx.doi.org/10.1016/S0014-5793(99)00642-0) [DOI] [PubMed] [Google Scholar]
- 21.Graham ML, Janecek JL, Kittredge JA, et al. The streptozotocin-induced diabetic nude mouse model: differences between animals from different sources. Comp Med. 2011;61(4):356–360. [PMC free article] [PubMed] [Google Scholar]
- 22.Griffeth RJ, Carretero J, Burks DJ. Insulin receptor substrate 2 is required for testicular development. PLOS ONE. 2013;8(5):e62103. doi: 10.1371/journal.pone.0062103. (Available from: http://dx.doi.org/10.1371/journal.pone.0062103) [DOI] [PMC free article] [PubMed] [Google Scholar]
- 23.Hage M, Zantout MS, Azar ST. Thyroid disorders and diabetes mellitus. J Thyroid Res. 2011;2011:439463. doi: 10.4061/2011/439463. (Available from: http://dx.doi.org/10.4061/2011/439463) [DOI] [PMC free article] [PubMed] [Google Scholar]
- 24.Hayashi K, Kojima R, Ito M. Strain differences in the diabetogenic activity of streptozotocin in mice. Biol Pharm Bull. 2006;29(6):1110–1119. doi: 10.1248/bpb.29.1110. (Available from: http://dx.doi.org/10.1248/bpb.29.1110) [DOI] [PubMed] [Google Scholar]
- 25.Hoenig M. Comparative aspects of diabetes mellitus in dogs and cats. Mol Cell Endocrinol. 2002;197(1-9):221–229. doi: 10.1016/s0303-7207(02)00264-2. (Available from: http://dx.doi.org/10.1016/S0303-7207(02)00264-2) [DOI] [PubMed] [Google Scholar]
- 26.Hoenig M. Kumar, T.R. (Ed.), Progress in Molecular Biology and Translational Science. Glucose Homeostatis and the Pathogenesis of Diabetes Mellitus. Academic Press, Vol. 121; 2014. Carbohydrate metabolism and pathogenesis of diabetes mellitus in dogs and cats; pp. 377–412. (Available from: http://dx.doi.org/10.1016/B978-0-12-800101-1.00012-0) [DOI] [PubMed] [Google Scholar]
- 27.Iwen KA, Schröder E, Brabant G. Thyroid hormones and the metabolic syndrome. Eur Thyroid J. 2013;2(2):83–92. doi: 10.1159/000351249. (Available from: http://dx.doi.org/10.1159/000351249) [DOI] [PMC free article] [PubMed] [Google Scholar]
- 28.Kadiyala R, Peter R, Okosieme OE. Thyroid dysfunction in patients with diabetes: clinical implications and screening strategies. Int J Clin Pract. 2010;64(8):1130–1139. doi: 10.1111/j.1742-1241.2010.02376.x. (Available from: http://dx.doi.org/10.1111/j.1742-1241.2010.02376.x) [DOI] [PubMed] [Google Scholar]
- 29.Kianifard D, Sadrkhanlou RA, Hasanzadeh S. The ultrastructural changes of the Sertoli and Leydig cells following streptozotocin induced diabetes. Iran J Basic Med Sci. 2012;15(1):623–635. [PMC free article] [PubMed] [Google Scholar]
- 30.Kim SM, Kim SC, Chung IK, et al. Antioxidant and protective effects of Bupleurum falcatum on the L-thyroxine-induced hyperthyroidism in rats. Evid-Based Compl Altern Med. 2012;2012:578497. doi: 10.1155/2012/578497. (Available from: http://dx.doi.org/10.1155/2012/578497) [DOI] [PMC free article] [PubMed] [Google Scholar]
- 31.Krassas GE, Poppe K, Glinoer D. Thyroid function and human reproductive health. Endocr Rev. 2010;31(5):702–755. doi: 10.1210/er.2009-0041. (Available from: http://dx.doi.org/10.1210/er.2009-0041) [DOI] [PubMed] [Google Scholar]
- 32.Kühn-Velten N, Schermer R, Staib W. Effect of streptozotocin-induced hyperglycaemia on androgen-binding protein in rat testis and epididymis. Diabetologia. 1984;26(4):300–303. doi: 10.1007/BF00283654. (Available from: http://dx.doi.org/10.1007/BF00283654) [DOI] [PubMed] [Google Scholar]
- 33.Kung AWC, Ng F. A rat model of thyroid hormone-induced bone loss: effect of antiresorptive agents on regional bone density and osteocalcin gene expression. Thyroid. 1994;4(1):93–98. doi: 10.1089/thy.1994.4.93. (Available from: http://dx.doi.org/10.1089/thy.1994.4.93) [DOI] [PubMed] [Google Scholar]
- 34.Lagu S, Bhavsar NG, Ramachandran A. Neonatal thyroid hormone programming decreases adult testes size, Sertoli cell number and sperm mass but does not alter overall premeiotic germ cell number. Ann Biol Res. 2011;2(2):276–289. [Google Scholar]
- 35.Lederer R, Rand JS, Jonsson NN, et al. Frequency of feline diabetes mellitus and breed predisposition in domestic cats in Australia. Vet J. 2009;179(2):254–258. doi: 10.1016/j.tvjl.2007.09.019. (Available from: http://dx.doi.org/10.1016/j.tvjl.2007.09.019) [DOI] [PubMed] [Google Scholar]
- 36.Manna PR, Kero J, Tena-Sempere M, et al. Assessment of mechanisms of thyroid hormone action in mouse Leydig cells: regulation of the steroidogenic acute regulatory protein, steroidogenesis, and luteinizing hormone receptor function. Endocrinology. 2001;142(1):319–331. doi: 10.1210/endo.142.1.7900. (Available from: http://dx.doi.org/10.1210/endo.142.1.7900) [DOI] [PubMed] [Google Scholar]
- 37.Maran R. Thyroid hormones: their role in testicular steroidogenesis. Arch Androl. 2003;49(5):375–388. doi: 10.1080/01485010390204968. (Available from: http://dx.doi.org/10.1080/01485010390204968) [DOI] [PubMed] [Google Scholar]
- 38.Maratou E, Hadjidakis DJ, Peppa M, et al. Studies of insulin resistance in patients with clinical and subclinical hyperthyroidism. Eur J Endocrinol. 2010;163(4):625–630. doi: 10.1530/EJE-10-0246. (Available from: http://dx.doi.org/10.1530/EJE-10-0246) [DOI] [PubMed] [Google Scholar]
- 39.Mendis-Handagama SM, Siril Ariyaratne HB. Leydig cells, thyroid hormones and steroidogenesis. Indian J Exp Biol. 2005;43(11):939–962. [PubMed] [Google Scholar]
- 40.Messarah M, Saoudi M, Boumendjel A, et al. Oxidative stress induced by thyroid dysfunction in rat erythrocytes and heart. Environ Toxicol Pharmacol. 2011;31(1):33–41. doi: 10.1016/j.etap.2010.09.003. (Available from: http://dx.doi.org/10.1016/j.etap.2010.09.003) [DOI] [PubMed] [Google Scholar]
- 41.Mouradian M, Abourizk N. Diabetes mellitus and thyroid disease. Diabetes Care. 1983;6(5):512–520. doi: 10.2337/diacare.6.5.512. [DOI] [PubMed] [Google Scholar]
- 42.Mulholland J, Mallidis C, Agbaje I, et al. Male diabetes mellitus and assisted reproduction treatment outcome. Reprod Biomed. 2011;22(2):215–219. doi: 10.1016/j.rbmo.2010.10.005. (Available from: http://dx.doi.org/10.1016/j.rbmo.2010.10.005) [DOI] [PubMed] [Google Scholar]
- 43.Navarro-Casado L, Juncos-Tobarra MA, Cháfer-Rudilla M, et al. Effect of experimental diabetes and STZ on male fertility capacity. Study in rats. J Androl. 2010;31(6):584–592. doi: 10.2164/jandrol.108.007260. (Available from: http://dx.doi.org/10.2164/jandrol.108.007260) [DOI] [PubMed] [Google Scholar]
- 44.Oatley MJ, Racicot KE, Oatley JM. Sertoli cells dictate spermatogonial stem cell niches in the mouse testis. Biol Reprod. 2011;84(4):639–645. doi: 10.1095/biolreprod.110.087320. (Available from: http://dx.doi.org/10.1095/biolreprod.110.087320) [DOI] [PMC free article] [PubMed] [Google Scholar]
- 45.O'Meara N, Blackman J, Sturis J, et al. Alterations in the kinetics of C-peptide and insulin secretion in hyperthyroidism. J Clin Endocrinol Metab. 1993;76(1):79–84. doi: 10.1210/jcem.76.1.8421108. (Available from: http://dx.doi.org/10.1210/jcem.76.1.8421108) [DOI] [PubMed] [Google Scholar]
- 46.Pereira BMJ, Balasubramanian K, Govindarajulu P. Thyroid epididymal relationship: II. Influence of hyperthyroidism on epididymal lipids. Biochim Biophys Acta (BBA)-Lipids Lipid Metab. 1984;792(2):207–213. doi: 10.1016/0005-2760(84)90224-8. (Available from: http://dx.doi.org/10.1016/0005-2760(84)90224-8) [DOI] [PubMed] [Google Scholar]
- 47.Radetti G, Paganini C, Gentili L, et al. Altered adrenal and thyroid function in children with insulin-dependent diabetes mellitus. Acta Diabetol. 1994;31(3):138–140. doi: 10.1007/BF00570367. (Available from: http://dx.doi.org/10.1007/BF00570367) [DOI] [PubMed] [Google Scholar]
- 48.Roubsanthisuk W, Watanakejorn P, Tunlakit M, et al. Hyperthyroidism induces glucose intolerance by lowering both insulin secretion and peripheral insulin sensitivity. J Med Assoc Thai. 2006;89(Suppl. 5):S133–S140. [PubMed] [Google Scholar]
- 49.Russell LD. Histological and Histopathological Evaluation of the Testis. Cache River Press, Clearwater, Florida; 1990. [Google Scholar]
- 50.Ruszkowska-Ciastek B, Sokup A, Socha MW, et al. A preliminary evaluation of VEGF-A, VEGFR1 and VEGFR2 in patients with well-controlled type 2 diabetes mellitus. J Zhejiang Univ-Sci B (Biomed & Biotechnol) 2014;15(6):575–581. doi: 10.1631/jzus.B1400024. (Available from: http://dx.doi.org/10.1631/jzus.B1400024) [DOI] [PMC free article] [PubMed] [Google Scholar]
- 51.Sahoo DK, Roy A. Compromised rat testicular antioxidant defence system by hypothyroidism before puberty. Int J Endocrinol. 2012;2012:637825. doi: 10.1155/2012/637825. (Available from: http://dx.doi.org/10.1155/2012/637825) [DOI] [PMC free article] [PubMed] [Google Scholar]
- 52.Sahoo DK, Roy A, Bhanja S, et al. Hypothyroidism impairs antioxidant defence system and testicular physiology during development and maturation. Gen Comp Endocrinol. 2008;156(1):63–70. doi: 10.1016/j.ygcen.2007.11.007. (Available from: http://dx.doi.org/10.1016/j.ygcen.2007.11.007) [DOI] [PubMed] [Google Scholar]
- 53.Schneider G, Kopach K, Ohanian H, et al. The hypothalamic-pituitary-gonadal axis during hyperthyroidism in the rat. Endocrinology. 1979;105(3):674–679. doi: 10.1210/endo-105-3-674. [DOI] [PubMed] [Google Scholar]
- 54.Schoeller EL, Albanna G, Frolova AI, et al. Insulin rescues impaired spermatogenesis via the hypothalamic-pituitary-gonadal axis in Akita diabetic mice and restores male fertility. Diabetes. 2012;61(7):1869–1878. doi: 10.2337/db11-1527. (Available from: http://dx.doi.org/10.2337/db11-1527) [DOI] [PMC free article] [PubMed] [Google Scholar]
- 55.Shaikh SB, Haji IM, Doddamani P, et al. A study of autoimmune polyglandular syndrome (APS) in patients with type1 diabetes mellitus (T1DM) followed up at a teritiary care hospital. J Clin Diagn Res. 2014;8(2):70–72. doi: 10.7860/JCDR/2014/7013.4011. (Available from: http://dx.doi.org/10.7860/JCDR/2014/7013.4011) [DOI] [PMC free article] [PubMed] [Google Scholar]
- 56.Singh R, Beigh SA. Payan-Carreira, R. (Ed.), Insights from Veterinary Medicine. InTech. http://dx.doi.org/10.5772/55377; 2013. Diseases of thyroid in animals and their management. [Google Scholar]
- 57.Singh S, Malini T, Rengarajan S, et al. Impact of experimental diabetes and insulin replacement on epididymal secretory products and sperm maturation in albino rats. J Cell Biochem. 2009;108(5):1094–1101. doi: 10.1002/jcb.22337. (Available from: http://dx.doi.org/10.1002/jcb.22337) [DOI] [PubMed] [Google Scholar]
- 58.Soudamani S, Malini T, Balasubramanian K. Effects of streptozotocin-diabetes and insulin replacement on the epididymis of prepubertal rats: histological and histomorphometric studies. Endocr Res. 2005;31(2):81–98. doi: 10.1080/07435800500229193. (Available from: http://dx.doi.org/10.1080/07435800500229193) [DOI] [PubMed] [Google Scholar]
- 59.Taniyama H, Shirakawa T, Furuoka H, et al. Spontaneous diabetes mellitus in young cattle: histologic, immunohistochemical, and electron microscopic studies of the islets of Langerhans. Vet Pathol. 1993;30(1):46–54. doi: 10.1177/030098589303000106. (Available from: http://dx.doi.org/10.1177/030098589303000106) [DOI] [PubMed] [Google Scholar]
- 60.van Haaster LH, de Jong FH, Docter R, et al. High neonatal triiodothyronine levels reduce the period of Sertoli cell proliferation and accelerate tubular lumen formation in the rat testis, and increase serum inhibin levels. Endocrinology. 1993;133(2):755–760. doi: 10.1210/endo.133.2.8344214. (Available from: http://dx.doi.org/10.1210/endo.133.2.8344214) [DOI] [PubMed] [Google Scholar]
- 61.Wu P. Thyroid disease and diabetes. Clin Diabetes. 2000;18(1):38–39. [Google Scholar]
- 62.Zamoner A, Barreto KP, Wilhelm Filho D, et al. Hyperthyroidism in the developing rat testis is associated with oxidative stress and hyperphosphorylated vimentin accumulation. Mol Cell Endocrinol. 2007;267(1-2):116–126. doi: 10.1016/j.mce.2007.01.005. (Available from: http://dx.doi.org/10.1016/j.mce.2007.01.005) [DOI] [PubMed] [Google Scholar]
- 63.Zhao H, Wang ZS, Zou DH, et al. Cytological changes in testes of male rats with short-term diabetes mellitus. Reprod Contrac. 2003;1:002. (in Chinese) [Google Scholar]