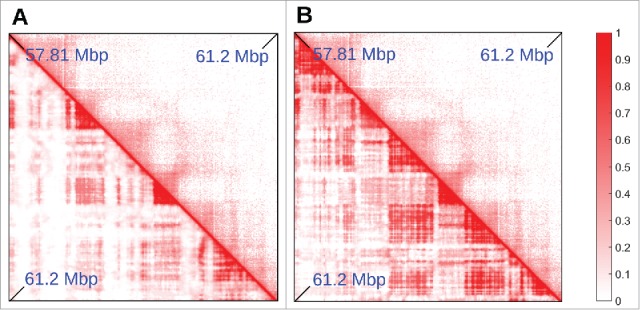
Figure 4.

Adding “colors” to the minimal model. (A,B) Comparison between Hi-C (top triangle) and simulated (bottom triangle) contact maps, for the region between 57.81 and 61.2 Mbp in chromosome 14 in HUVEC cells (coordinates from hg19). Simulations were done similarly to those in Fig. 2, and involved 15.5 Mbp of chromatin at 3 kbp resolution, so the region shown is a subset of the whole simulated fragment, chosen to highlight the effect of adding a new species of protein and an additional binding site color to the model. In (A), heterochromatin was colored according to GC content (threshold ∼40.69%). It can be seen that several TADs are missing in the simulations. In (B), heterochromatin beads are colored according to H3K9me3 and H3K27me3 tracks (so there are now 2 possible heterochromatic colors). The latter procedure gives better agreement with the Hi-C data.
